

Do you have a timeseries connection to an Aveva PI historian? Are you connecting to the PI data archive using TrendMiner’s ‘PI data archive (PI AF SDK)’ provider?
If that case it could be worth checking if you have connection pooling enabled.
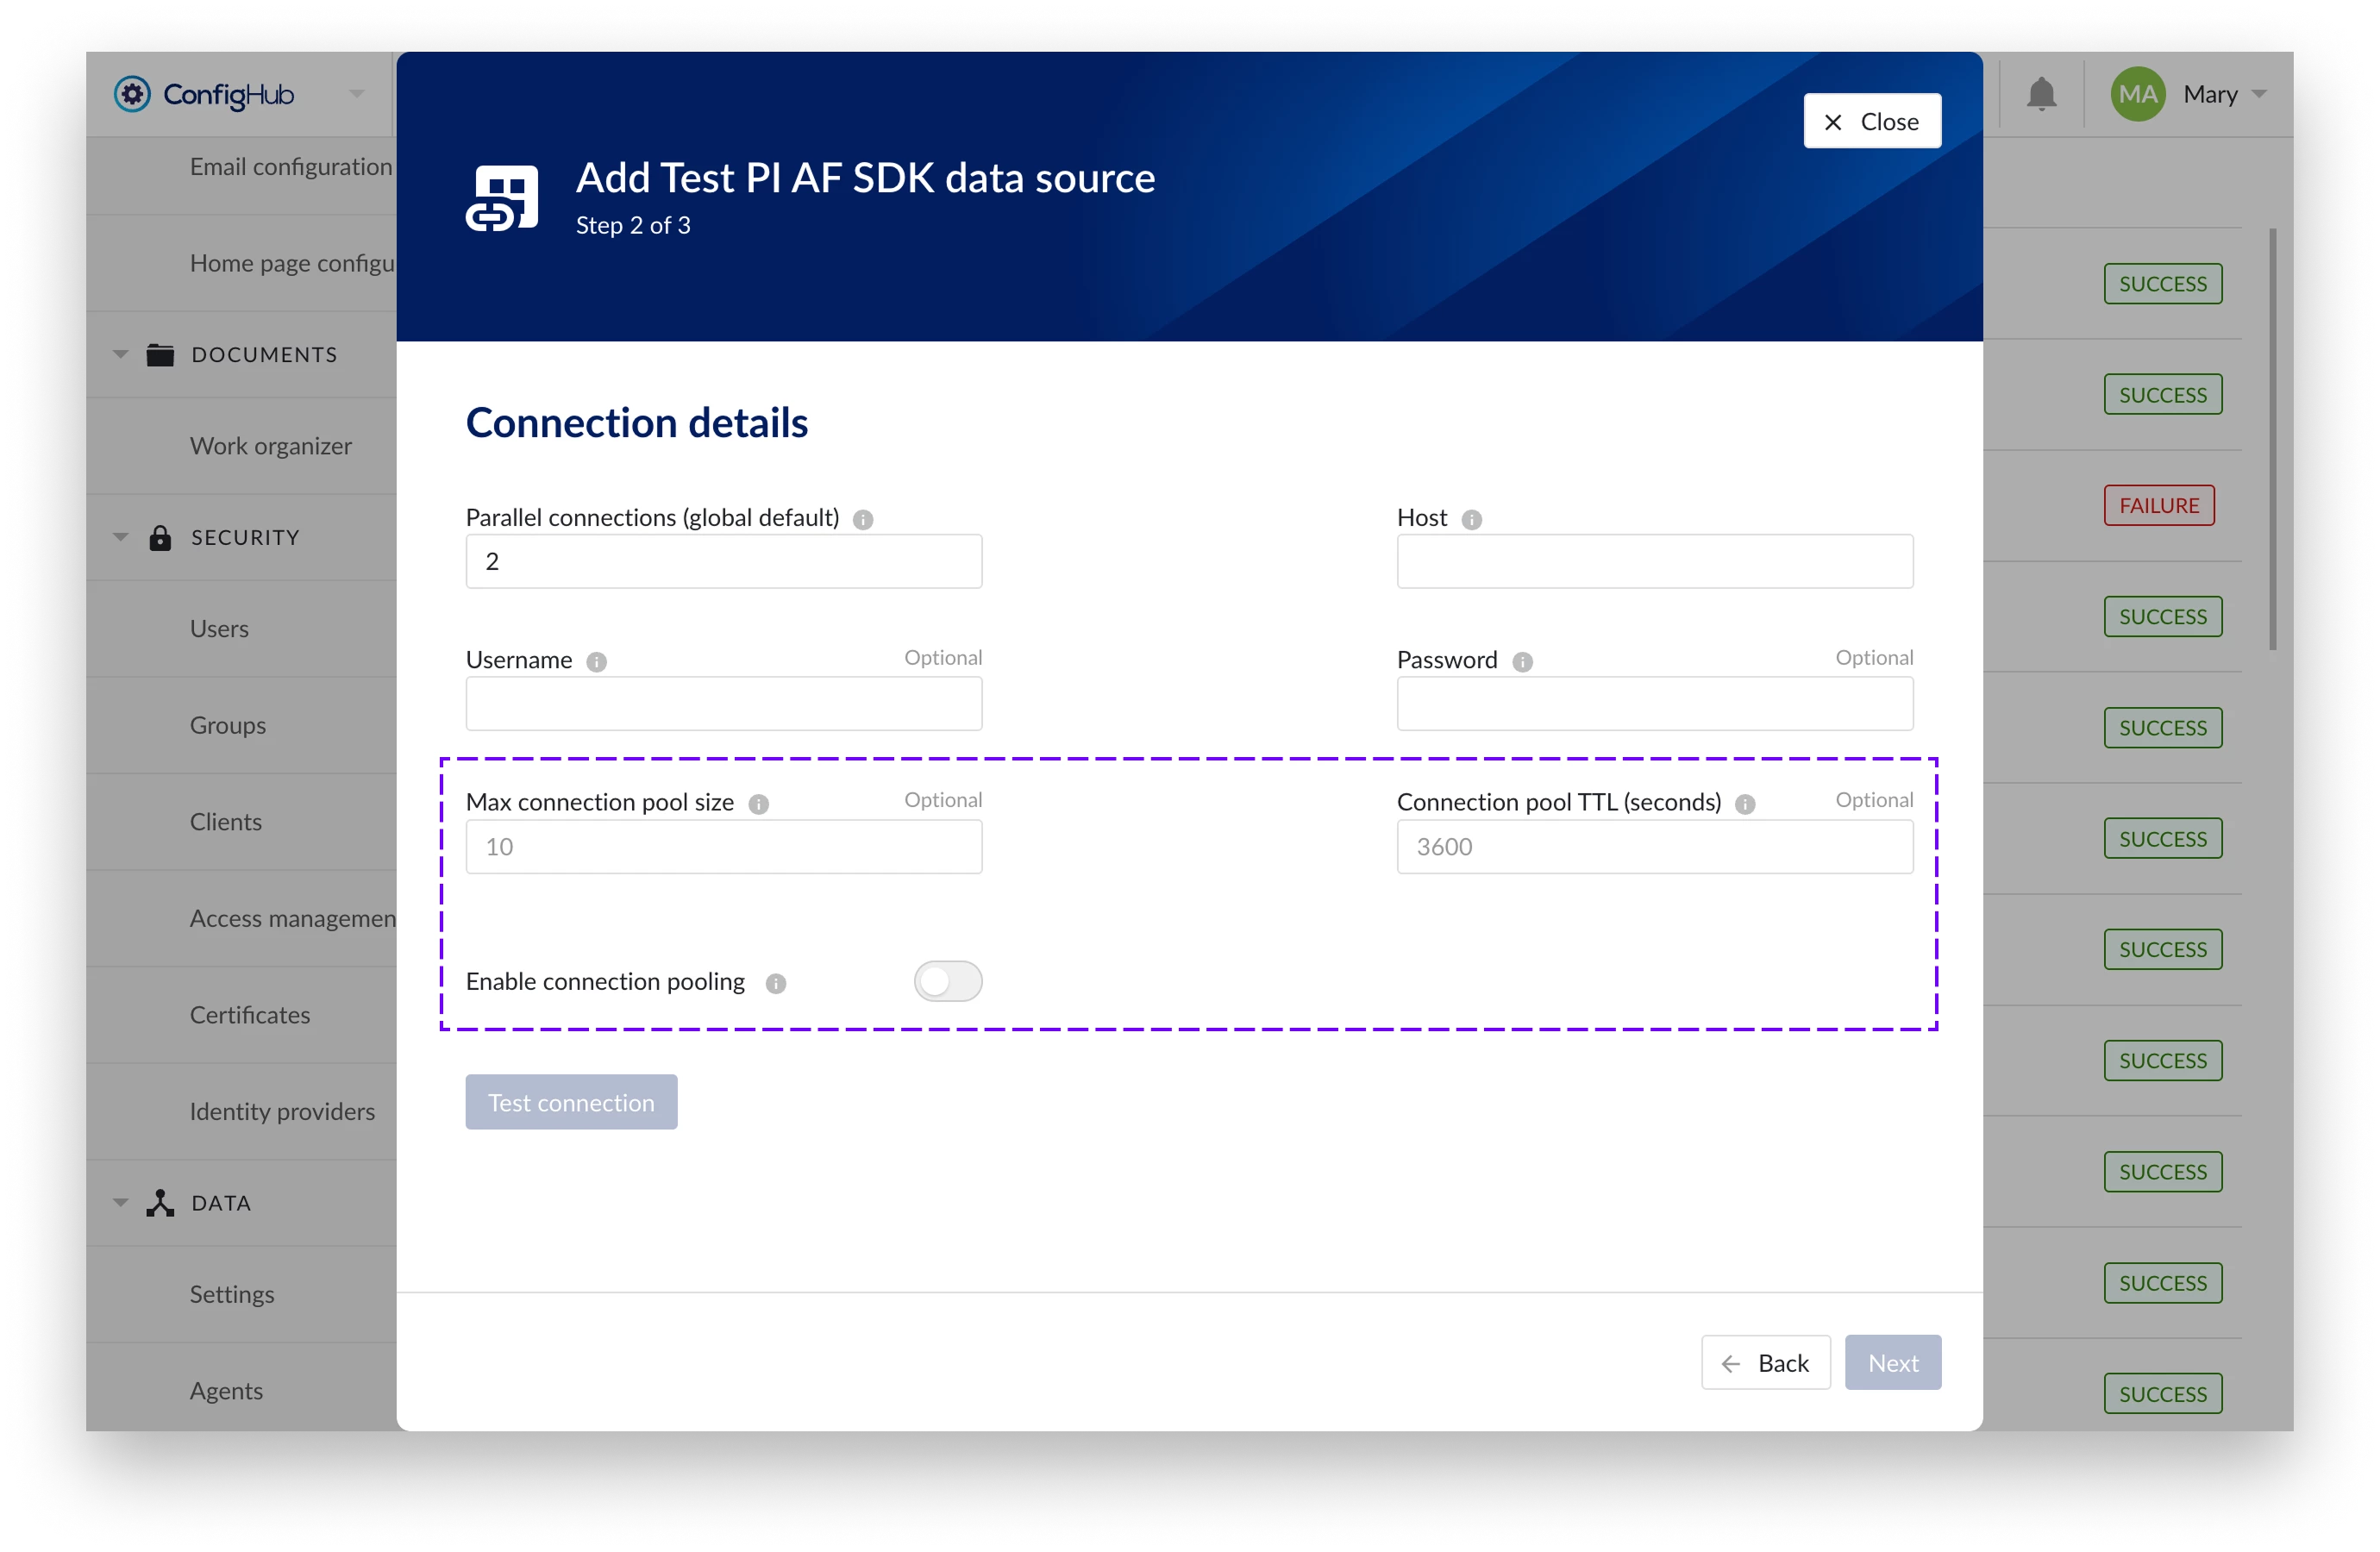
What is connection pooling?
When connection pooling is disabled, each TrendMiner data request will create a new connection to the historian. When the data is received the connection is closed again. When connection pooling is enabled a connection will be set up and multiple requests will be sent over that same connection.
Why should I enabled connection pooling?
Setting up a new connection causes some overhead, and hence delay in the data responses. Since TrendMiner does a lot of data requests (up to 5k requests per minute or more) the overhead of setting up this connection can be significant. Enabling connection pooling reduces this overhead significantly and therefor can lead to high performance improvements in fetching tag data (used for indexing and plotting).
What’s the disadvantage of connection pooling?
Since connections are not closed anymore after the data request is sent the connection is also occupied on the historian side, leaving less connections available for other applications to query data from the historian. In most cases this is not an issue though, and the number of connections which are set up by TrendMiner can be tweaked.
How can I enable connection pooling?
For existing data sources you can edit the properties via ConfigHub → data sources → edit and enable the option in the connection details. Connection pooling can be enabled or disabled at any time and on the fly.
There are 2 additional parameters to tweak the connection pooling:
-
Max connection pool size: Defines the maximum number of parallel connections per data source between connector and historian that can be maintained in the pool simultaneously. The default is 10.
-
Connection pool TTL (seconds): Specifies how long an idle connection should be kept alive in the pool before being discarded. The default is 3600 (1 hour).
How can I verify the performance increased?
Data should load faster and metrics should improve. More info on how to interpret the metrics: