












Share your own use case or explore our use case repository
Recently active
📌 BackgroundEvery production site collects and stores massive amounts of process data — far more than is typically analyzed. For engineers, gaining a holistic view of plant operations can be a daunting task.TrendMiner’s layer comparison and compare table features make it easy to visualize and quantify how different operating periods performed, side by side.By leveraging this functionality, users can quickly identify high-performing periods and understand which process conditions led to those results. 📌 ObjectiveUse historical data to identify ideal operating conditions by comparing performance over several time periods (for example, across months).With just a few clicks, TrendMiner users can: Compare key process variables over multiple months, Identify which periods performed best, and Spot potential process differences that may have led to underperformance. 🛠️ Solution1. Create a Layer for Each PeriodStart by selecting the process tags you want to compare — for example: Raw m
📣 If you missed our March 24th webinar, Optimizing Batch Processing Time and Increasing Daily Production with TrendMiner, the recording is now available and well worth your time. The session featured a compelling real-world from Mallard Creek Polymers, a specialty latex manufacturer, showing how their team used TrendMiner to reduce stripper cycle times by 10-20% and directly increase daily production output.Even better, an analysis that could have taken an engineer hours or days to complete, now takes about ten minutes to repeat.Find the webinar recording here 🔊
One of my favorite uses for the multi-layer scatter plots is to check performance before and after asset maintenance. Not only is it interesting to compare how much the situation improved by maintenance, you can also see at a glance whether your maintenance is always equally successful, and whether you are performing it at a consistent level of degraded performance.This scatter plot shows the correlation between product throughput (x-axis) and specific energy consumption (y-axis) for 1 day periods just before and after 3 maintenance events. I picked the same color for the layer just before and after each maintenance event, so I can see what layers belong together. What we can indeed see from this plot is that the specific energy consumption decreases after maintenance, always returning to approximately the same level. This indicates maintenance was done successfully each time. We should also notice though that we clearly do not perform maintenance at the same level of performance degra
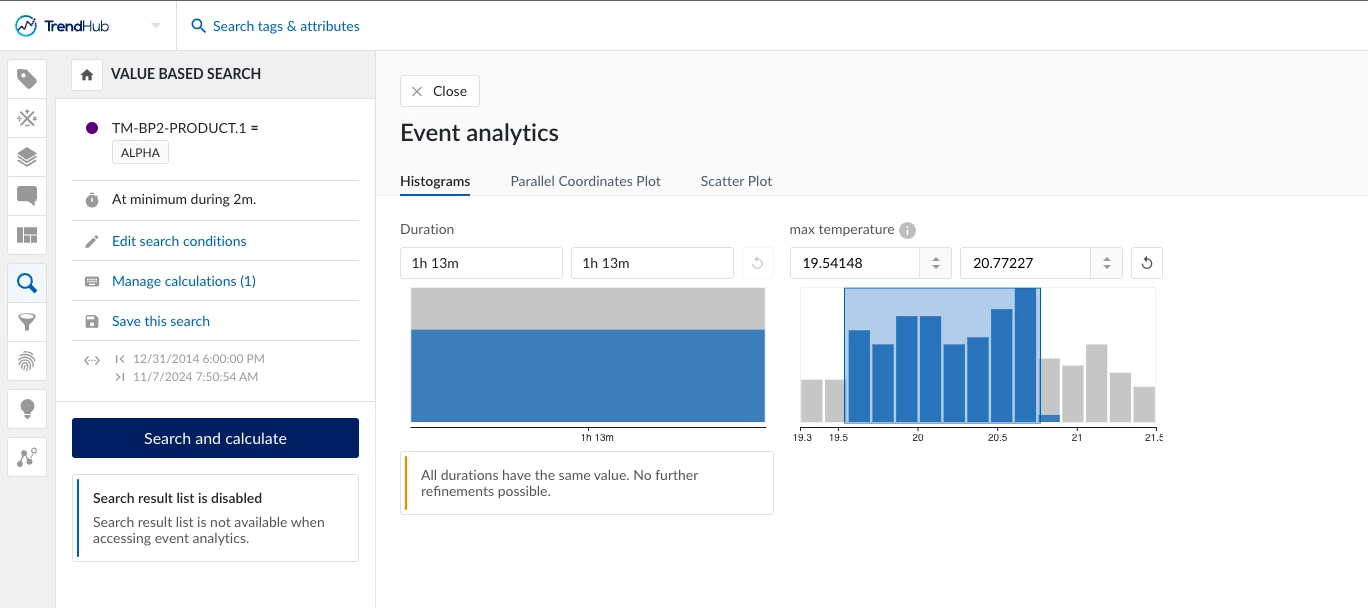
📌 BackgroundIn many chemical plants, reactors contain catalyst beds that gradually lose activity and need to be replaced on a routine basis. Because catalyst life can vary significantly, it is difficult to predict exactly when a failure will occur.A premature catalyst failure would have a major impact on production, supply chain, and maintenance. Therefore, it is critical to plan preventative maintenance well in advance – at least a few weeks prior to failure – to avoid costly unplanned downtime and production losses. 🎯 ChallengeWith TrendMiner, a workflow can be set up to monitor and predict catalyst performance: Searching on Process Values The first step is to use value-based searches to identify when process values reach certain limits. These searches can be saved and later used as the basis for monitors. In this way, early indicators, warning levels, and critical conditions can be defined, all providing valuable insights into catalyst performance. Event analytics can of course a
Background Manufacturing plants often rely on both railcars and trucks to ship their products to distributors, retailers, or directly to customers. The choice between these transportation methods depends on various factors such as the nature of the goods, cost, distance, and delivery time requirements. Railcars are typically used for bulk shipments of heavy and large quantities of goods, such as raw materials, chemicals, and pellets, due to their capacity to transport large volumes efficiently over long distances. Conversely, trucks offer greater flexibility and are ideal for shorter distances and time-sensitive deliveries, providing door-to-door service and easier access to various destinations. This combination of transportation methods allows manufacturing plants to optimize their logistics and ensure timely and cost-effective distribution of their products. Method #1 can be reviewed here. Although that method yields accurate results, it may not always capture events of varying du
BackgroundInterpreting time-series data at a glance can be challenging, especially when process experts need a quick update on what’s happening in their plant. Instead of scanning raw trends directly, it’s often more effective to use a dashboard that highlights key incidents and events. With TrendMiner, dashboards can be configured to automatically track setpoints, rapid process changes, error codes, and much more, providing immediate insights without the need for manual data review. As an example, we will set up a productivity tracking system to monitor sulfur production in a sulfur recovery plant.Sulfur recovery plant dashboard. Workflow1. Set up monitoring on interesting sensor data2. Create a new ContextHub view with corresponding filters3. Add a Gantt-chart tile on a dashboard.4. Configure new Context Types (Optional; Admin rights)--------------------------------------------------------------------------------------------------------------------------------------------1. Set up mo
Produced batches often need to meet specific quality criteria depending on the product grade. In TrendMiner, dashboards can be used to monitor the different types of batches produced. For example, batches can be categorized by parameters such as product grade or quality. This provides a clear, real-time overview of how many batches of each category were produced over a user-defined time period. As an example, we’ll use lab quality data from a polymer production process. The plant produces three different product grades, and quality is evaluated based on viscosity measurements. WorkflowCreate a new ContextHub view Add a ContextHub counter tile Repeat for multiple trackers 1. Create a new ContextHub viewThe content of a ContextHub list can be customized using a variety of filters. Common filter options include time period, fields, tags or assets, types, and keywords. For our specific case, we are going to select:Period filter: Event open in range from 01/01/2018 until 01/01/2020 Field fi
📌 BackgroundIn batch processes in the process industry, quality fluctuations occasionally occur—for example, in the form of low concentration in the end product. These "bad batches" lead to increased waste, uncertainty in process control, and additional analysis effort. Often, it is unclear what exactly causes these deviations. 📌 ObjectiveThis article demonstrates how TrendMiner’s Event Analytics can be used to identify the root causes of poor batch quality. Value-based search, calculated KPIs, and graphical evaluations are employed. 🎯 ChallengeHow can all relevant batches of a product type be systematically identified, meaningful KPIs calculated, and differences between good and poor-quality batches visualized using Event Analytics? 🛠️ Solution1. Load tagsFirst, load all relevant process data (e.g., pressure, temperature, concentration, fill level, dosing behavior) into TrendHub. Example of a TrendHub view 2. Define time intervalLimit the time window to the relevant period to foc
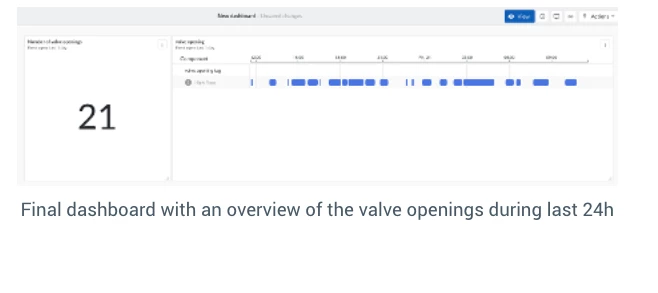
BackgroundThis use case shows how to create a dashboard that shows an overview of the number of valve openings and the current valve state. In the past this used to be a non-automated procedure, requiring a lot of manual work to count the amount The objective of this dashboard is to streamline and automate the monitoring of valve operations, reducing manual effort and enhancing real-time visibility.Example of a valve opening tagSolutionThe solution includes the following steps:Value based search: Create a value based search to identify all the valve opening events you want to display on your dashboard. Save this search for later use. Contextualisation of Events: Select “Add as Context Item” for the identified events. Fill in the context item details such as Component (valve opening tag), Type (High Flow), and Description (Valve open). Monitor Setup: Go to the “Monitoring” tab and enable a new monitor. Use the saved valve opening search and set it to create a context item for each event
Improve asset availability and energy efficiency with self-service analytics 📌 BackgroundIn many process-driven industries, heat exchangers play a crucial role in maintaining efficient thermal operations. For example, process gases exiting a shell-and-tube heat exchanger are often routed to downstream equipment like baghouse filters, which are subject to strict temperature limits. To prevent safety risks or equipment damage, conservative temperature thresholds are often used—typically set well below actual specification limits.However, over time, systems may experience efficiency losses due to fouling, which can increase outlet temperatures and push operations closer to critical thresholds. Being able to detect and address fouling at an early stage is key to maintaining asset availability and optimizing energy use. ⚙️ ChallengeFouling inside heat exchangers reduces thermal efficiency, leading to higher outlet temperatures and potential process deviations.To ensure safe and optimal ope
Knowing how certain settings impact our main KPIs is key in fine-tuning a process to driveproductivity. Such a feat can only be accomplished by actually measuring the relevant KPIs in acomparative study.In this use case, you will see how you can very quickly assess the impact of process conditions on agiven KPI during a selected period. process conditions: equipment on/off, product grade, day of the week... KPI: energy usage, setpoint deviations, total production, ... period of choice: the period you currently have on your focus chartAn example would be assessing the impact our Advanced Process Controller (APC) has on the averagedeviation of our Process Value (PV) from our Setpoint (SP). Is it actually doing its job in reducing theaverage deviation? Step 1 - Defining the KPIAssuming we don't already have a KPI tag, we will need to use a formula to calculate the KPI we want.In the case of APC performance, a typical KPI would be the absolute value of the difference between a process valu
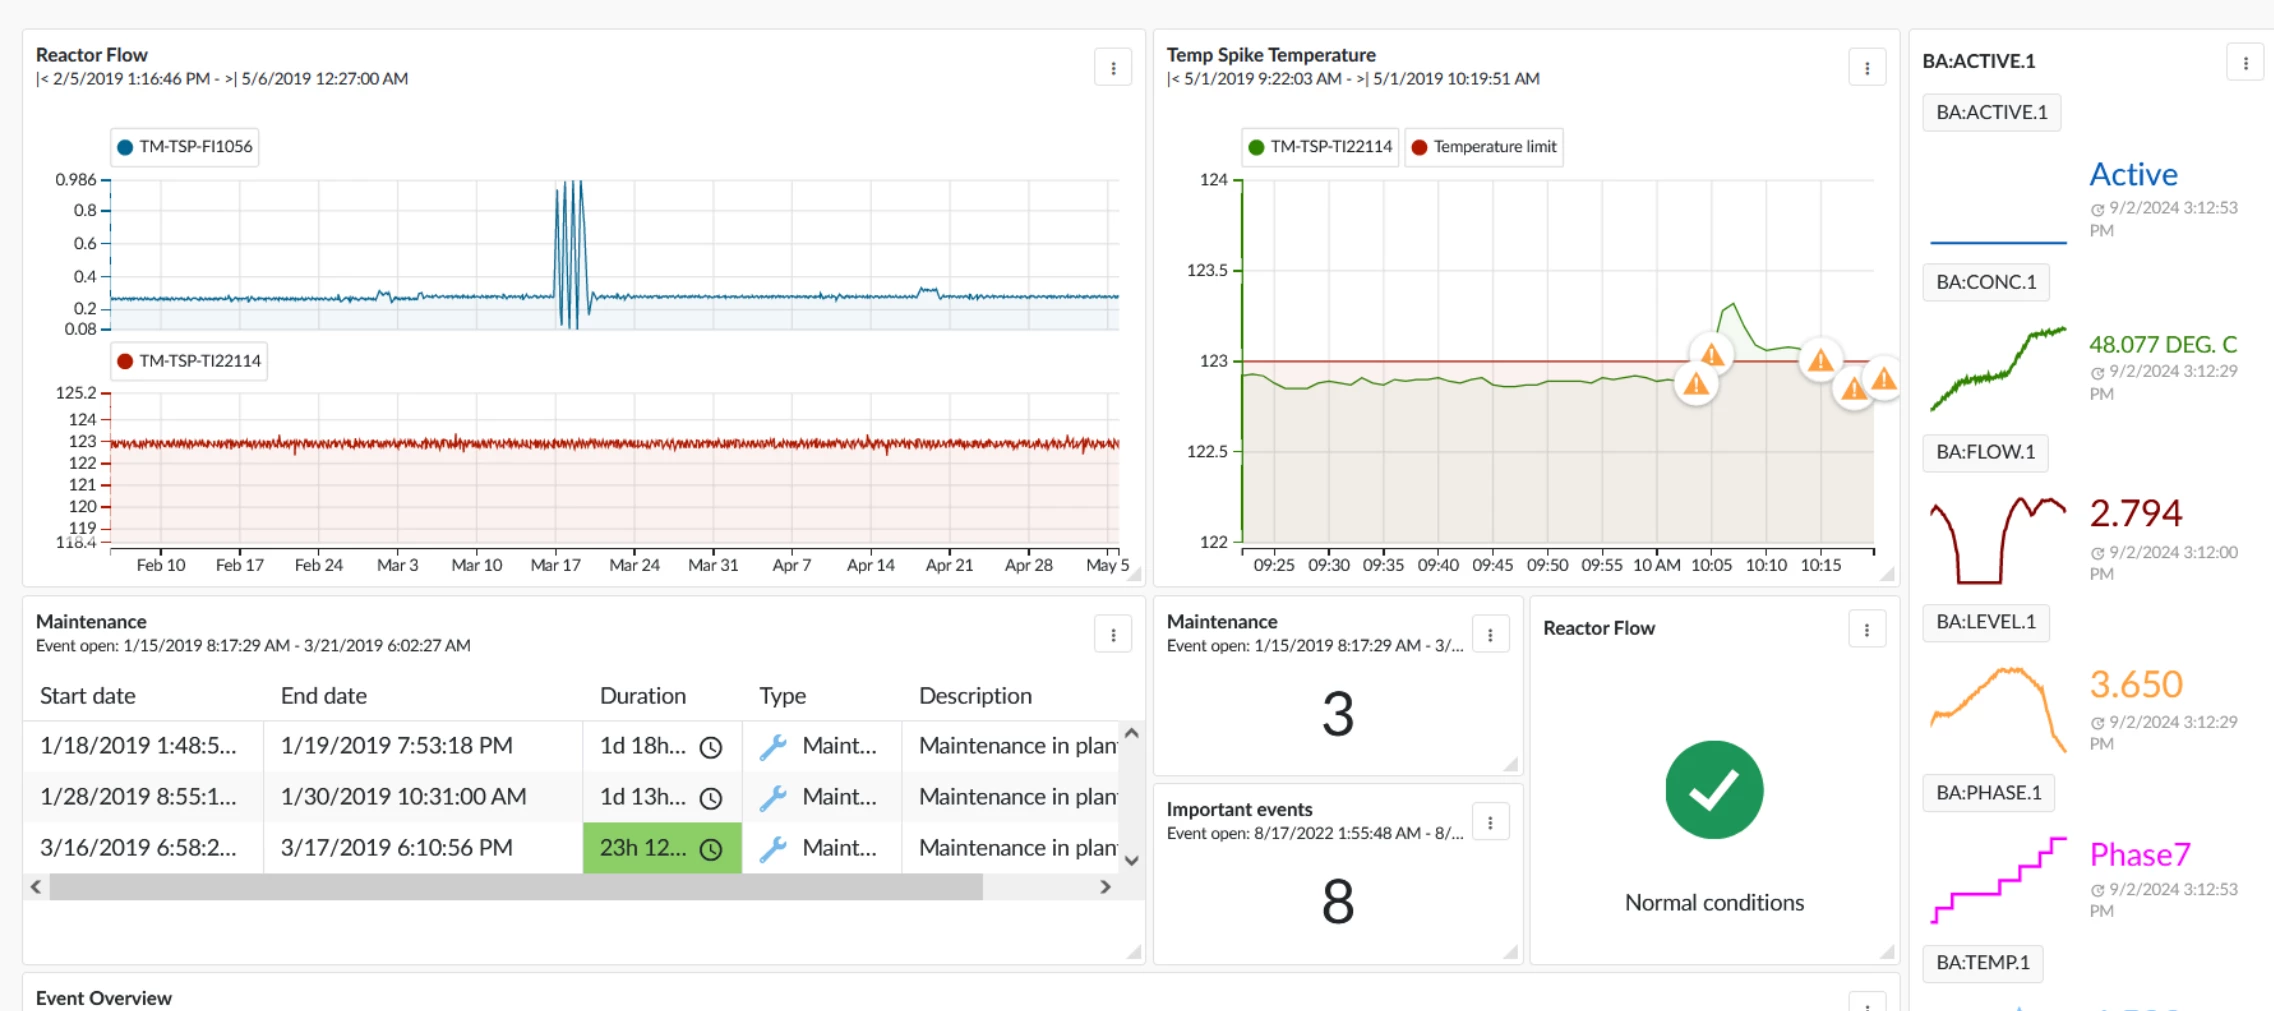
TrendMiner can be used to automatically track the status of our sensor data during a batch process. To prevent losing time continuously having to check process trends, we can make a dashboard telling the user immediately the status of the production process during a period of choice. This can also detect problems, which were missed before and have had a big impact on, for example, product quality. As an example, we will look at the production of an active pharmaceutical ingredient in a batch process. To show the principle, we are going to monitor if a batch is currently running, and subsequently we are going to check whether the temperature does not increase too much during the batch. WorkflowSet up monitoring on timeseries we want to track Create a new ContextHub view with corresponding filters Add a Gantt-chart tile on a dashboard Optional for admins: configure the context item Set up monitoring on timeseries we want to trackFirst step is to track the events we want to have on our da
On a daily basis, a process expert evaluates key process parameters. In TrendMiner, a process expert can easily populate a dashboard with the preferred parameters making your most important process parameters available with one click of a button. As an example, we are going to visualize the general status of a heat exchanger on a dashboard for the last 24 hours to immediately follow up on important process changes. WorkflowSaving important trends in the work organizer Creating a TrendHub view tile on a dashboard in DashHub Creating a traffic light tile on a dashboard Saving important trends in the work organizerFirstly, we need to save the correct views we want to put on our dashboard. This can be done in TrendHub where we can save the view that is visualized.For our case we are going to:Load the tags related to the heat exchanger: TM-T200.* Visualize the outlet temperature of the product, and the inlet and outlet temperature of the heating medium. Put the focus chart on 24 hours, fix
💡 Extending the concept of hourly averages to shorter time intervals📎 Related post: Calculations of hourly average consumption values 📌 BackgroundIn process industries, consumption monitoring of resources such as steam, water, electricity, and compressed air is key to ensuring energy efficiency and sustainable operations. While hourly averages provide a solid overview, shorter intervals like 30 minutes can deliver even more granular insights—especially for fast-changing processes or detailed performance analysis.👉 In some cases, half-hourly averages are required for regulatory reporting, for example to comply with environmental or energy-related limits imposed by authorities. Having these values available ensures transparency and compliance. 🎯 ChallengeHow can we calculate average consumption values for fixed 30-minute intervals and distinguish them from rolling values? And how can we ensure the values are visualized cleanly as stepwise changes in the trend? 🛠️ Solution✅ Rolling
📌 BackgroundIn any industrial process, there are typically periods of optimal (good) and sub-optimal (bad) performance. Identifying and comparing these periods helps in understanding the differences and optimizing operations. By analyzing the variations between good and bad periods, process engineers can uncover key factors affecting efficiency and quality. ⚠️ ChallengeOne of the main challenges in process optimization is recognizing the factors that differentiate a good period from a bad one. Some common difficulties include: 🔎 Identifying relevant time periods or batches in continuous and batch processes. 📊 Establishing objective quality metrics to categorize periods. 🔄 Effectively comparing periods visually and numerically to extract actionable insights. 🛠 SolutionTrendMiner provides a structured approach to compare good and bad process periods through the following steps:✅ 1. Feature Search Use the value-based search function to find operating periods or batches. For b
For rotating equipment, we need to seal off moving components with mechanical seals that use a barrier fluid. There is no way to seal off moving components perfectly so there will always be some leakage. If product leakage to the environment is unacceptable (typically for SHE reasons), a zero emission seal needs to be used. For zero emission seals, there can only be leakage from the barrier fluid into the product, which is why a barrier fluid that is under higher pressure than the pumped fluid needs to be used that is compatible with the product. After all, at least some of this barrier fluid will end up in the product. A classical example of this is the usage of N2 as a barrier fluid to natural gas.Mechanical seals are common but critical components, and they can be monitored quite easily in TrendMiner as the monitoring criteria are simply value-based. We can sometimes use a value-based search directly, but if we need to compare two measurement (e.g. to ensure a difference in pressure
BackgroundIn batch processes, tracking key metrics like batch start and end times, cycle durations, and critical values such as maximum temperature can provide valuable insights. For instance, maintaining temperature within a certain threshold during a batch step can prevent quality issues and ensure process safety. This use case will guide you through how to document, track, and analyze batch cycle times, utilizing TrendMiner’s TrendHub and ContextHub features to streamline and automate this process.ChallengeTraditionally, batch cycle times have been recorded manually in Excel spreadsheets by board operators. This manual entry system often results in inconsistencies, especially when operators miss recording the start or end times of batches. TrendMiner provides a more reliable solution by automatically identifying and documenting batch steps and storing this information alongside tag data. By automating these records, TrendMiner reduces the reliance on Excel and increases accuracy.Sol
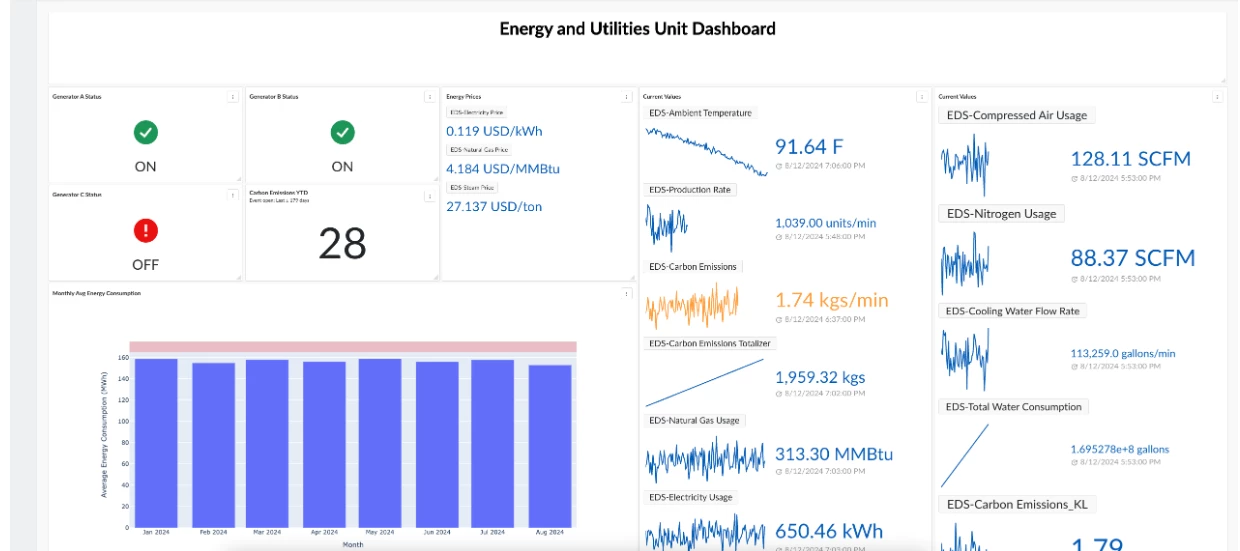
BackgroundThis use case shows how to create a custom visualization / chart that can be displayed on your DashHub dashboard as a tile. We can do this via MLHub. In this use case example, we will create a bar chart to track a key process metric at a facility, monthly average energy usage. Once we have added this visualization as a tile to the target dashboard, we can add other visualizations, as needed, following a similar procedure. These dashboards can then be shared with your peers. SolutionThe solution includes the following steps:Create a TrendHub view: Create a TrendHub view with all of the relevant tags. Adjust the time period on your focus chart. You will want to include all of the data that will be used to create your visualization. Save this TrendHub view. TrendHub view with focus chart duration spanning the entire year of 2024. Create a new MLHub notebook: Navigate to MLHub and create a new notebook. In
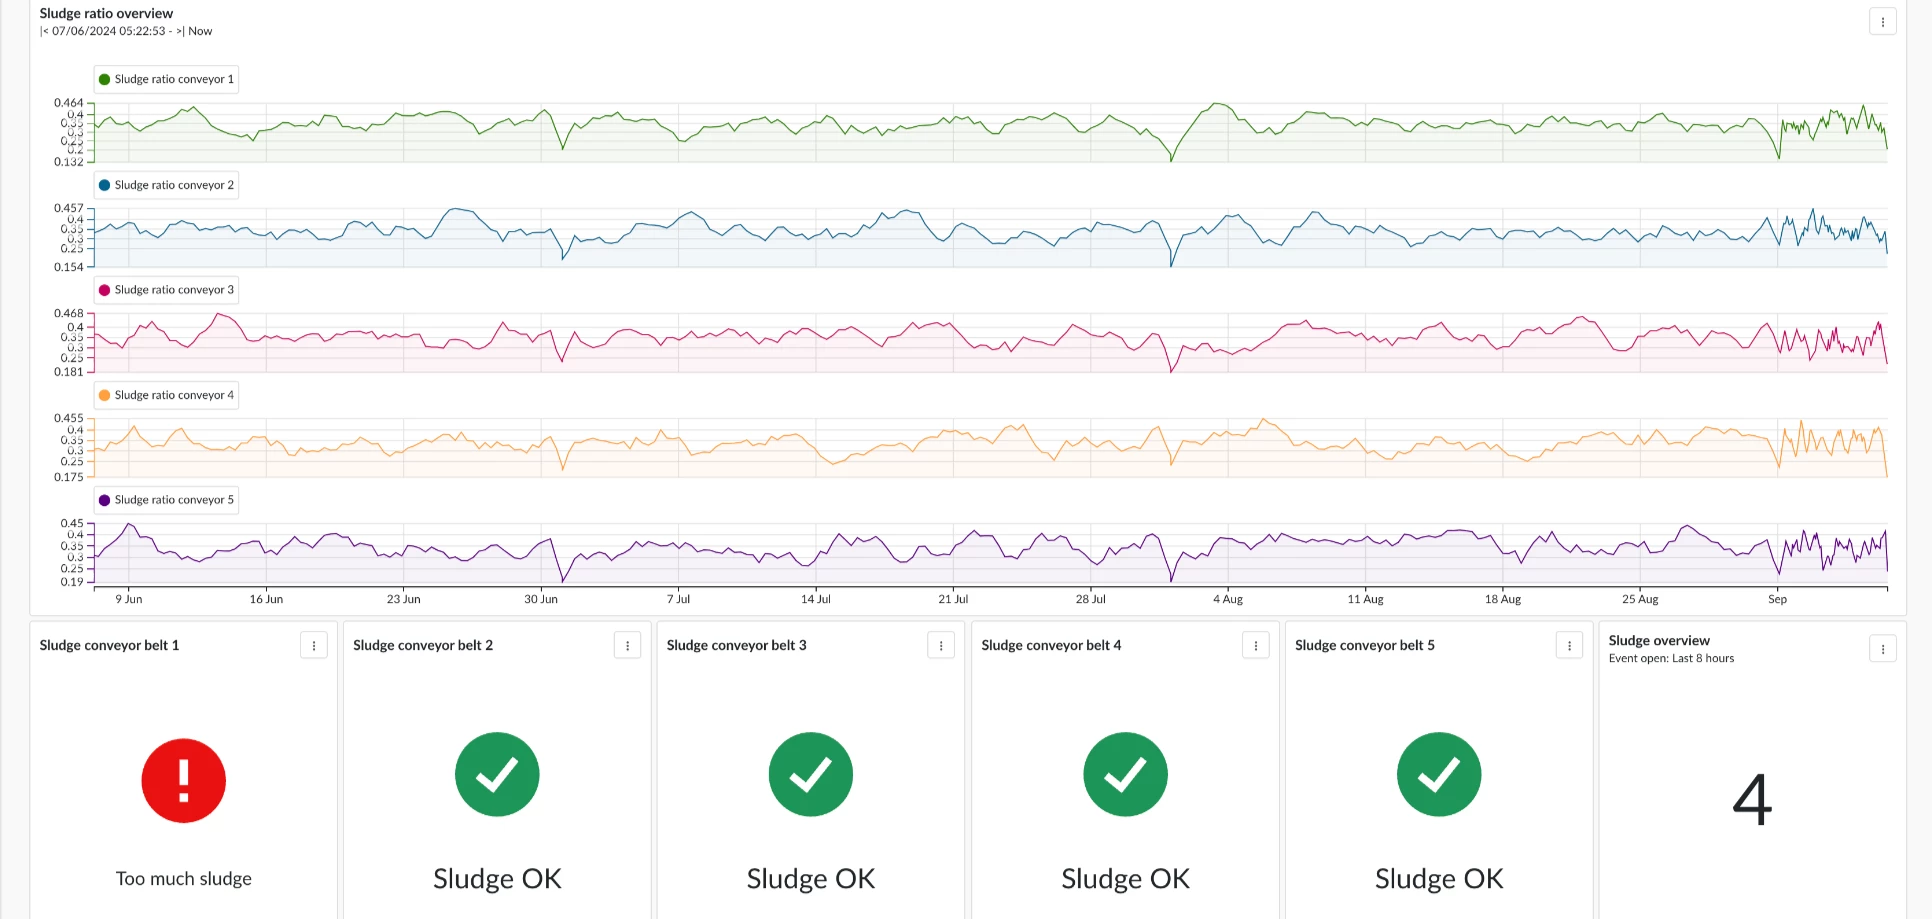
👉🏻 BackgroundIn a water purification system, efficient sludge transport is crucial tomaintaining optimal operations. The system employs five conveyor belts,which are dynamically activated based on the sludge load. At any giventime, a minimum of one and a maximum of four belts may be inoperation. However, the dynamic nature of this system introduceschallenges. If one of the belts malfunctions or operates inefficiently, it canlead to increased sludge accumulation, potentially disrupting the entirepurification process. To prevent this issue, a robust monitoring solution isessential to ensure that all belts function properly, regardless of the load.🕵 ChallengeMonitoring the operation of the conveyor belts is complicated by thevariability in the number of active belts. This dynamic operation makes itdifficult to determine when a belt is malfunctioning versus when it issimply under a different load condition. The challenge lies indistinguishing normal variations in performance from actual
Background Monitoring thresholds is a common use case in the chemical industry, essential for maintaining consistent production quality and ensuring operational safety. Thresholds act as predefined limits, signaling potential issues in the process when exceeded. Failure to effectively monitor these thresholds can lead to production inefficiencies, equipment damage, and reduced product quality. Such deviations can be caused by factors like temperature fluctuations, pressure variations, or torque instability, as well as unexpected changes in raw material quality. TrendMiner provides an effective solution by enabling reliable and continuous monitoring of these thresholds. ChallengeThe challenge in monitoring thresholds lies in precisely defining and continuously tracking them. TrendMiner offers a solution by enabling users to set up monitoring through value-based searches, which can trigger automatic alerts. Additionally, the creation of context items can be activated to allow for detai
BackgroundIn one of the distillation units, one of the product temperatures is being lower than expected for around 1 year, leading to lower product recovery, as the separation is not as efficient as it should. This means a 10% recovery loss in the company, which is an important economical loss. ChallengeTroubleshoot the causes for this deterioration in performance, by detecting the influencing variables and the respective influence of each. Solution-Load all the related tags, as well as the key temperature-Run the correlations engine to find correlations against the potentially correlated variables and against all the variables of the asset-Layer 2 periods (high and low recovery) and compare statistics and trends of the potentially influencing parameters Results and value-Two process variables were identified as the main influencing factors. -It was identified that both variables weren't acting at the same time, but separately. That's why by themselves, the correlation is not to high,
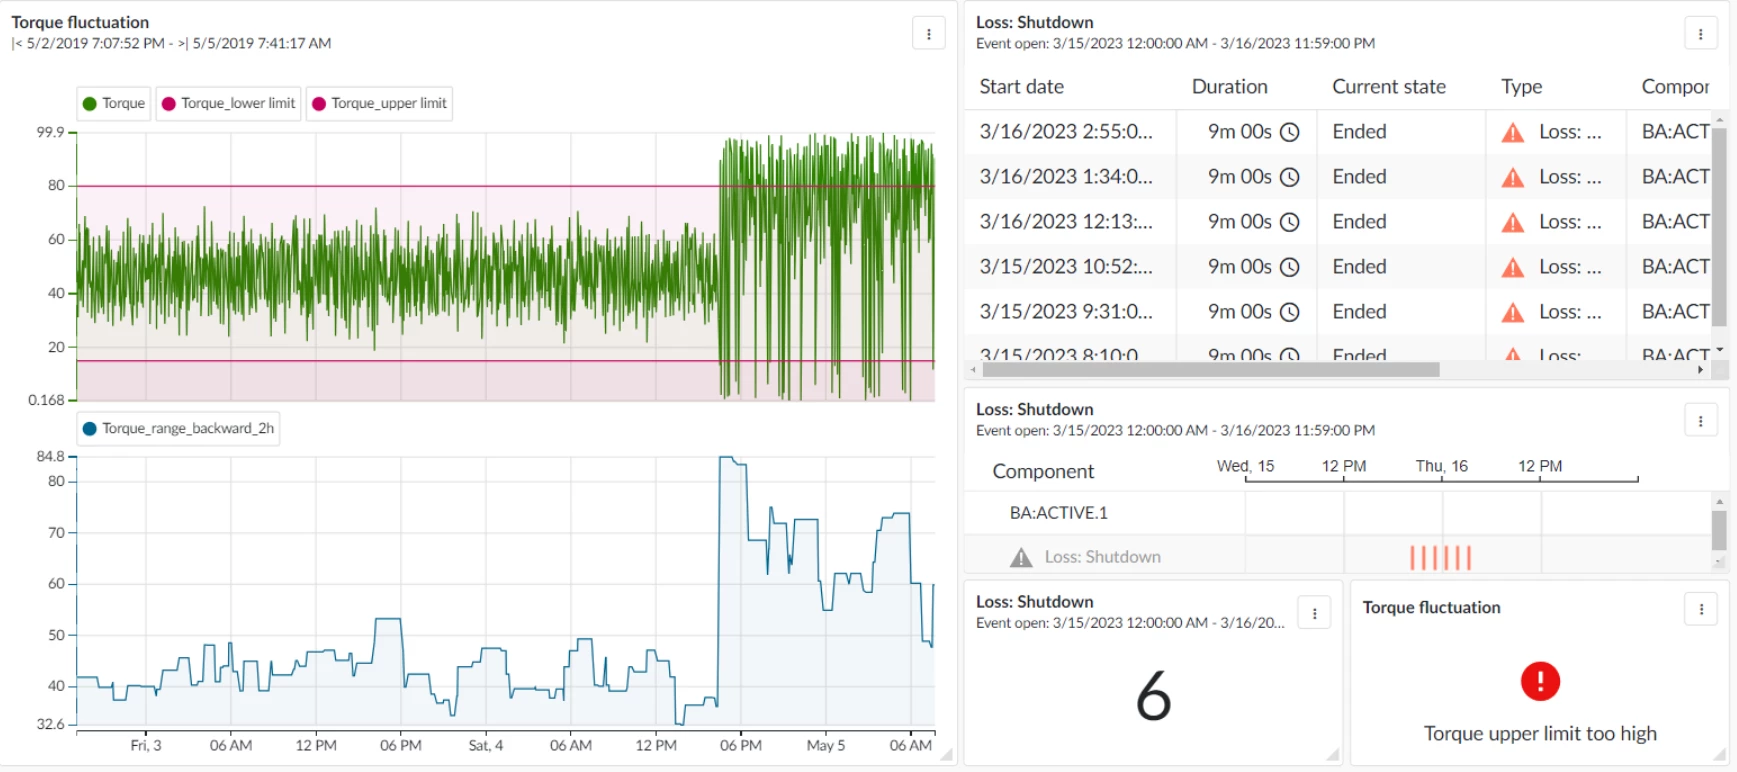
Background Fluctuating process parameters in the chemical industry present a significant challenge as they can impact the efficiency and quality of production. These variations can be caused by inaccurate measurements, unstable raw material quality, or insufficient process controls.For instance, Torque fluctuations in machinery may lead to mechanical damage, compromising operational safety. Temperature fluctuations in reactors can affect reaction kinetics, resulting in inconsistent product quality. Likewise, pressure fluctuations in pipelines or reaction vessels can affect product consistency and equipment safety. ChallengeManaging fluctuating process parameters may require setting and monitoring thresholds, tracking the range of variations, and creating context items. TrendMiner simplifies this by allowing users to define and oversee limits, measure fluctuations, and visualize all relevant data on a dashboard. SolutionDefining upper and lower limitsIn this step, upper and lower torq
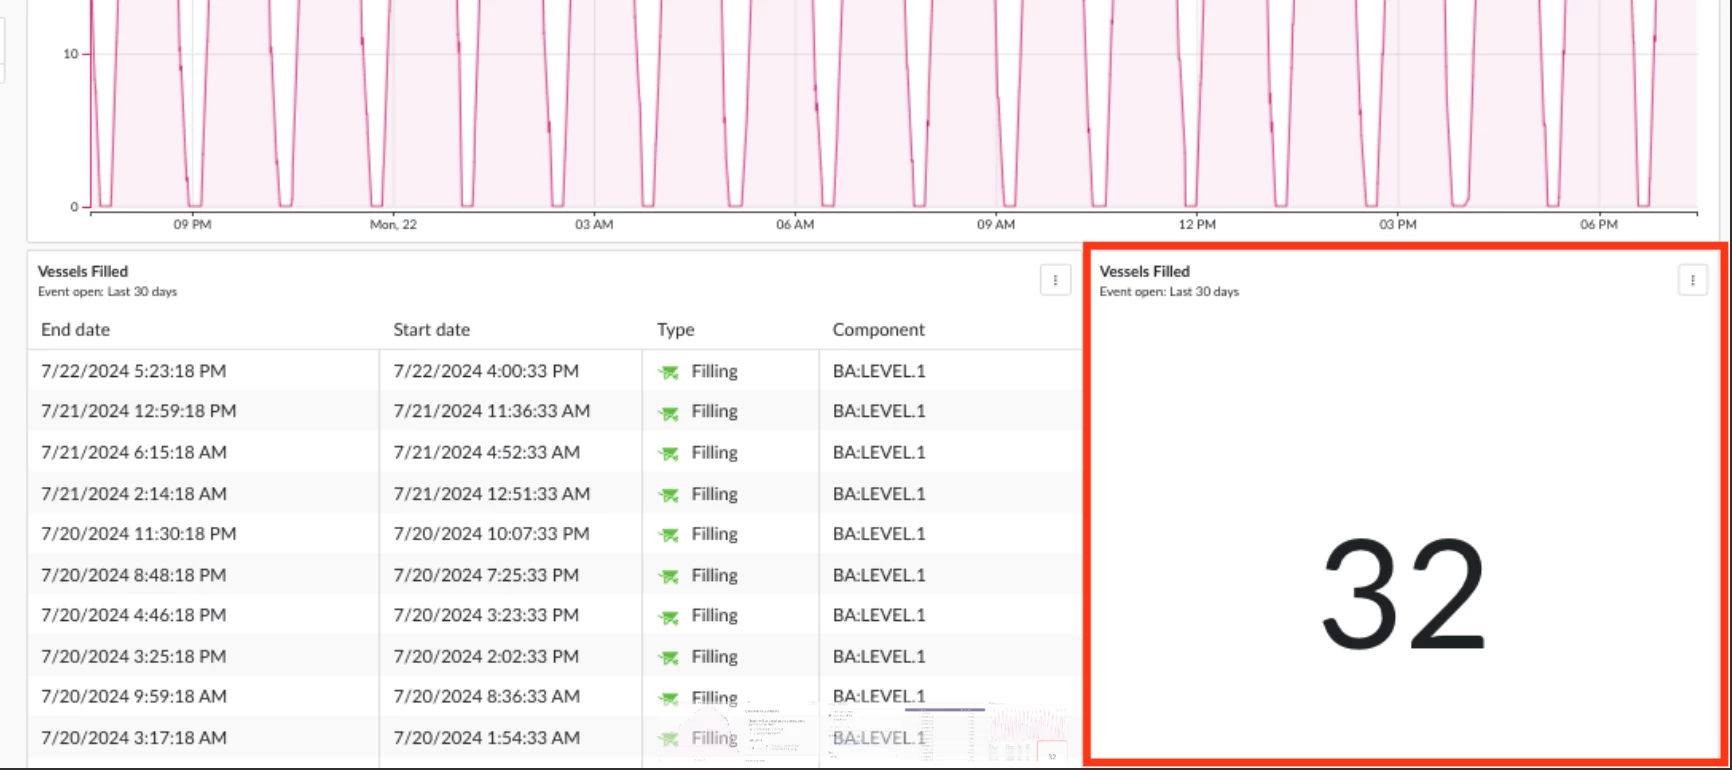
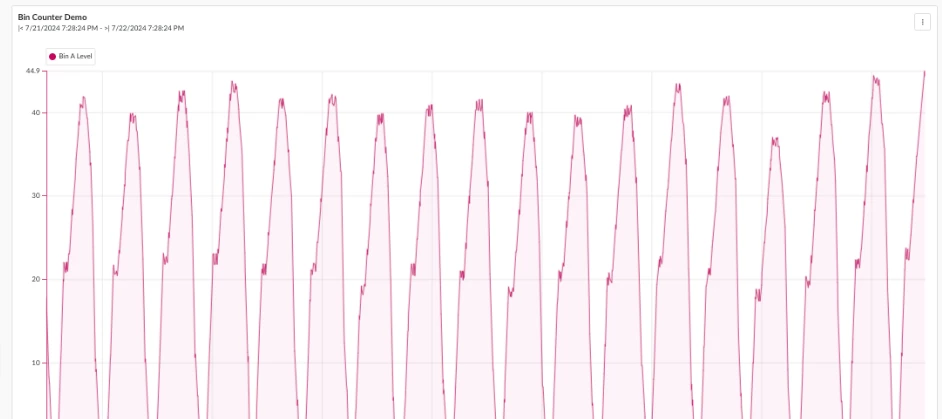
BackgroundManufacturing plants often rely on both railcars and trucks to ship their products to distributors, retailers, or directly to customers. The choice between these transportation methods depends on various factors such as the nature of the goods, cost, distance, and delivery time requirements. Railcars are typically used for bulk shipments of heavy and large quantities of goods, such as raw materials, chemicals, and pellets, due to their capacity to transport large volumes efficiently over long distances. Conversely, trucks offer greater flexibility and are ideal for shorter distances and time-sensitive deliveries, providing door-to-door service and easier access to various destinations. This combination of transportation methods allows manufacturing plants to optimize their logistics and ensure timely and cost-effective distribution of their products. ChallengeKeeping an accurate count of how many vessels have been filled can be a challenging task for manufacturing plants, par
BackgroundThe material management department needs the daily consumption of caustic to order the correct amount from suppliers and avoid shortages or excess.This is calculated from the reactor's weight sensor after each of the approximately 20 daily discharges.Before TrendMiner, we manually recorded these weights, a tedious process prone to errors, missing data, and a lack of consumption analysis. ChallengesUnderstand the normal daily raw material consumption to request the needed amount from providers and optimize inventory space. SolutionCreate a formula to create the derivative of the reactor weight only when it's negative (discharge). Value based search to search every day in the last 6 months Add calculations with the day name and the integral of the formula (daily consumption) Export report Results and value-A report of the last 6 months was created in 10 minutes, the same amount of time that it takes to manually get the report of 1 day. From now on, only 1 click is needed
This use case demonstrates how TrendMiner's functionalities can be leveraged to perform retrospective analyses, leading to enhanced productivity and efficiency in our power plant operations. BackgroundIn our power plant, managing fuel consumption efficiently is crucial for operational cost savings and environmental impact reduction. This use case focuses on a retrospective analysis aimed at reducing fuel consumption by adjusting PID (Proportional-Integral-Derivative) parameters within our system.ChallengeThe primary challenge was to reduce fuel consumption without compromising the performance and stability of the power plant. The desired outcome was to identify the impact of PID parameter adjustments on fuel consumption by comparing data from specific periods before and after the changes were implemented.SolutionTo address this challenge, the following steps were taken: Parameter Adjustment: The PID parameters were adjusted in our power plant system to optimize fuel consumption. Data
Already have an account? Login
No account yet? Create an account
Enter your E-mail address. We'll send you an e-mail with instructions to reset your password.