TrendMiner 2026.R1.0 is here!
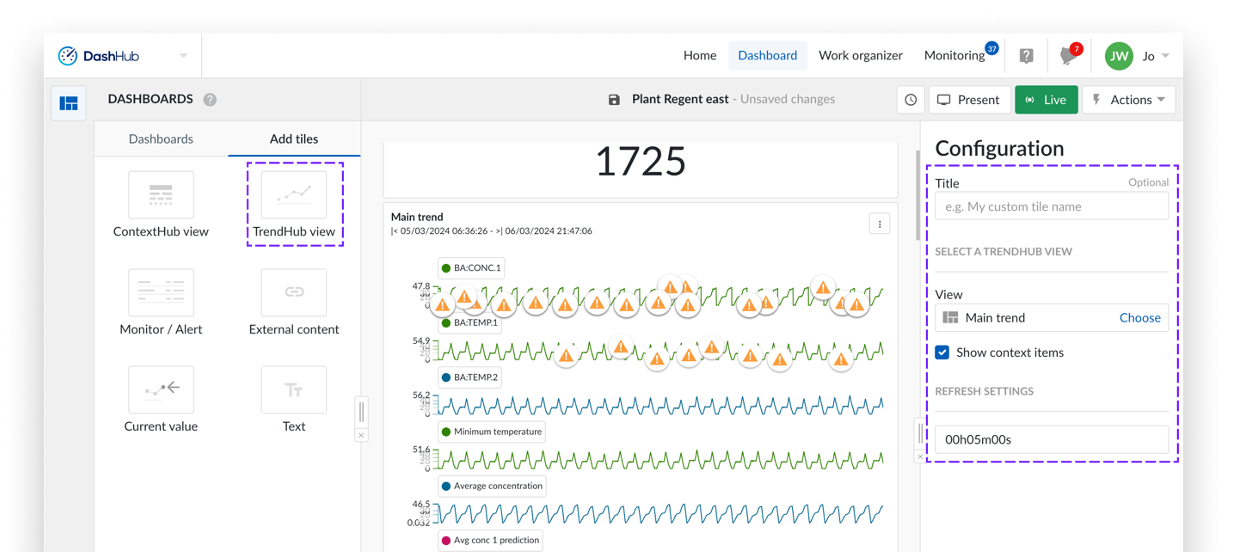
A new release dropped and there's plenty to explore. Here's what's new in 2026.R1.0.Collapsed Plotting Working with filtered data just got a lot cleaner. You can now collapse filtered periods on trend and stacked trend plots, stitching unfiltered data seamlessly together. Patterns become immediately obvious and this focused view carries straight into DashHub, so your View Tiles always show exactly what your team needs.Smarter context field configuration Admins now have much finer control over context fields per context type: mark fields as required, set them to read-only after creation, define decimal precision, and control display order. When filtering by context type in search, the Field filter automatically narrows to show only relevant fields. Field values starting with http(s):// now render as clickable links in the detail modal.Index storage visibility and optimization From ConfigHub, you can now generate a report showing how much disk space your index data uses and how much you can recover by adjusting the horizon, including which similarity searches would be affected. Adjusting the horizon automatically cleans up older index data and notifies you when done.SMTP modernization SMTP settings can now be fully configured from Edge Manager, with support for Amazon SES, Microsoft 365, and Google Workspace out of the box.Plant Integrations V5, Generally Available A single installer now handles everything. No IIS, no manual config files. Settings are stored centrally so nothing is lost during upgrades. V5 also adds HTTPS and Basic Authentication support for environments that require it.Full release notes are in the User Guide. Questions or excited about something specific? Drop it below!
![[Recording] Release Webinar: What's New in TrendMiner 2025.R4.0?](https://uploads-eu-west-1.insided.com/trendminer-en/attachment/2ad17fbf-f655-42b1-a2e2-5246ba7df239_thumb.png)