






Discover our learning resources and share your experiences...
Recently active
New to TrendMiner? Ready to start analyzing your process data more easily and faster than ever before? Here's a learning path to quickly reach first value with our platform and to gradually build your TrendMiner knowledge and ability: In-App Onboarding FlowUpon your first login, you can follow the in-app onboarding flow. This guided process is designed to familiarize you quickly with our platform's functionalities and capabilities which will improve your work flow. If you prefer, you can access the in-app guides at any time via the Help Center.Onboarding EmailsYou'll receive a series of onboarding emails that contain valuable information and tips to help you start your journey with TrendMiner. However, please note that your company might have disabled these resources, so ensure to check with your admin if you don't receive them.Walk through the TrendMiner Basic GuidesThe bite sized short Basic Guides videos help you understand how to use TrendMiner in your daily work by focussing on pr
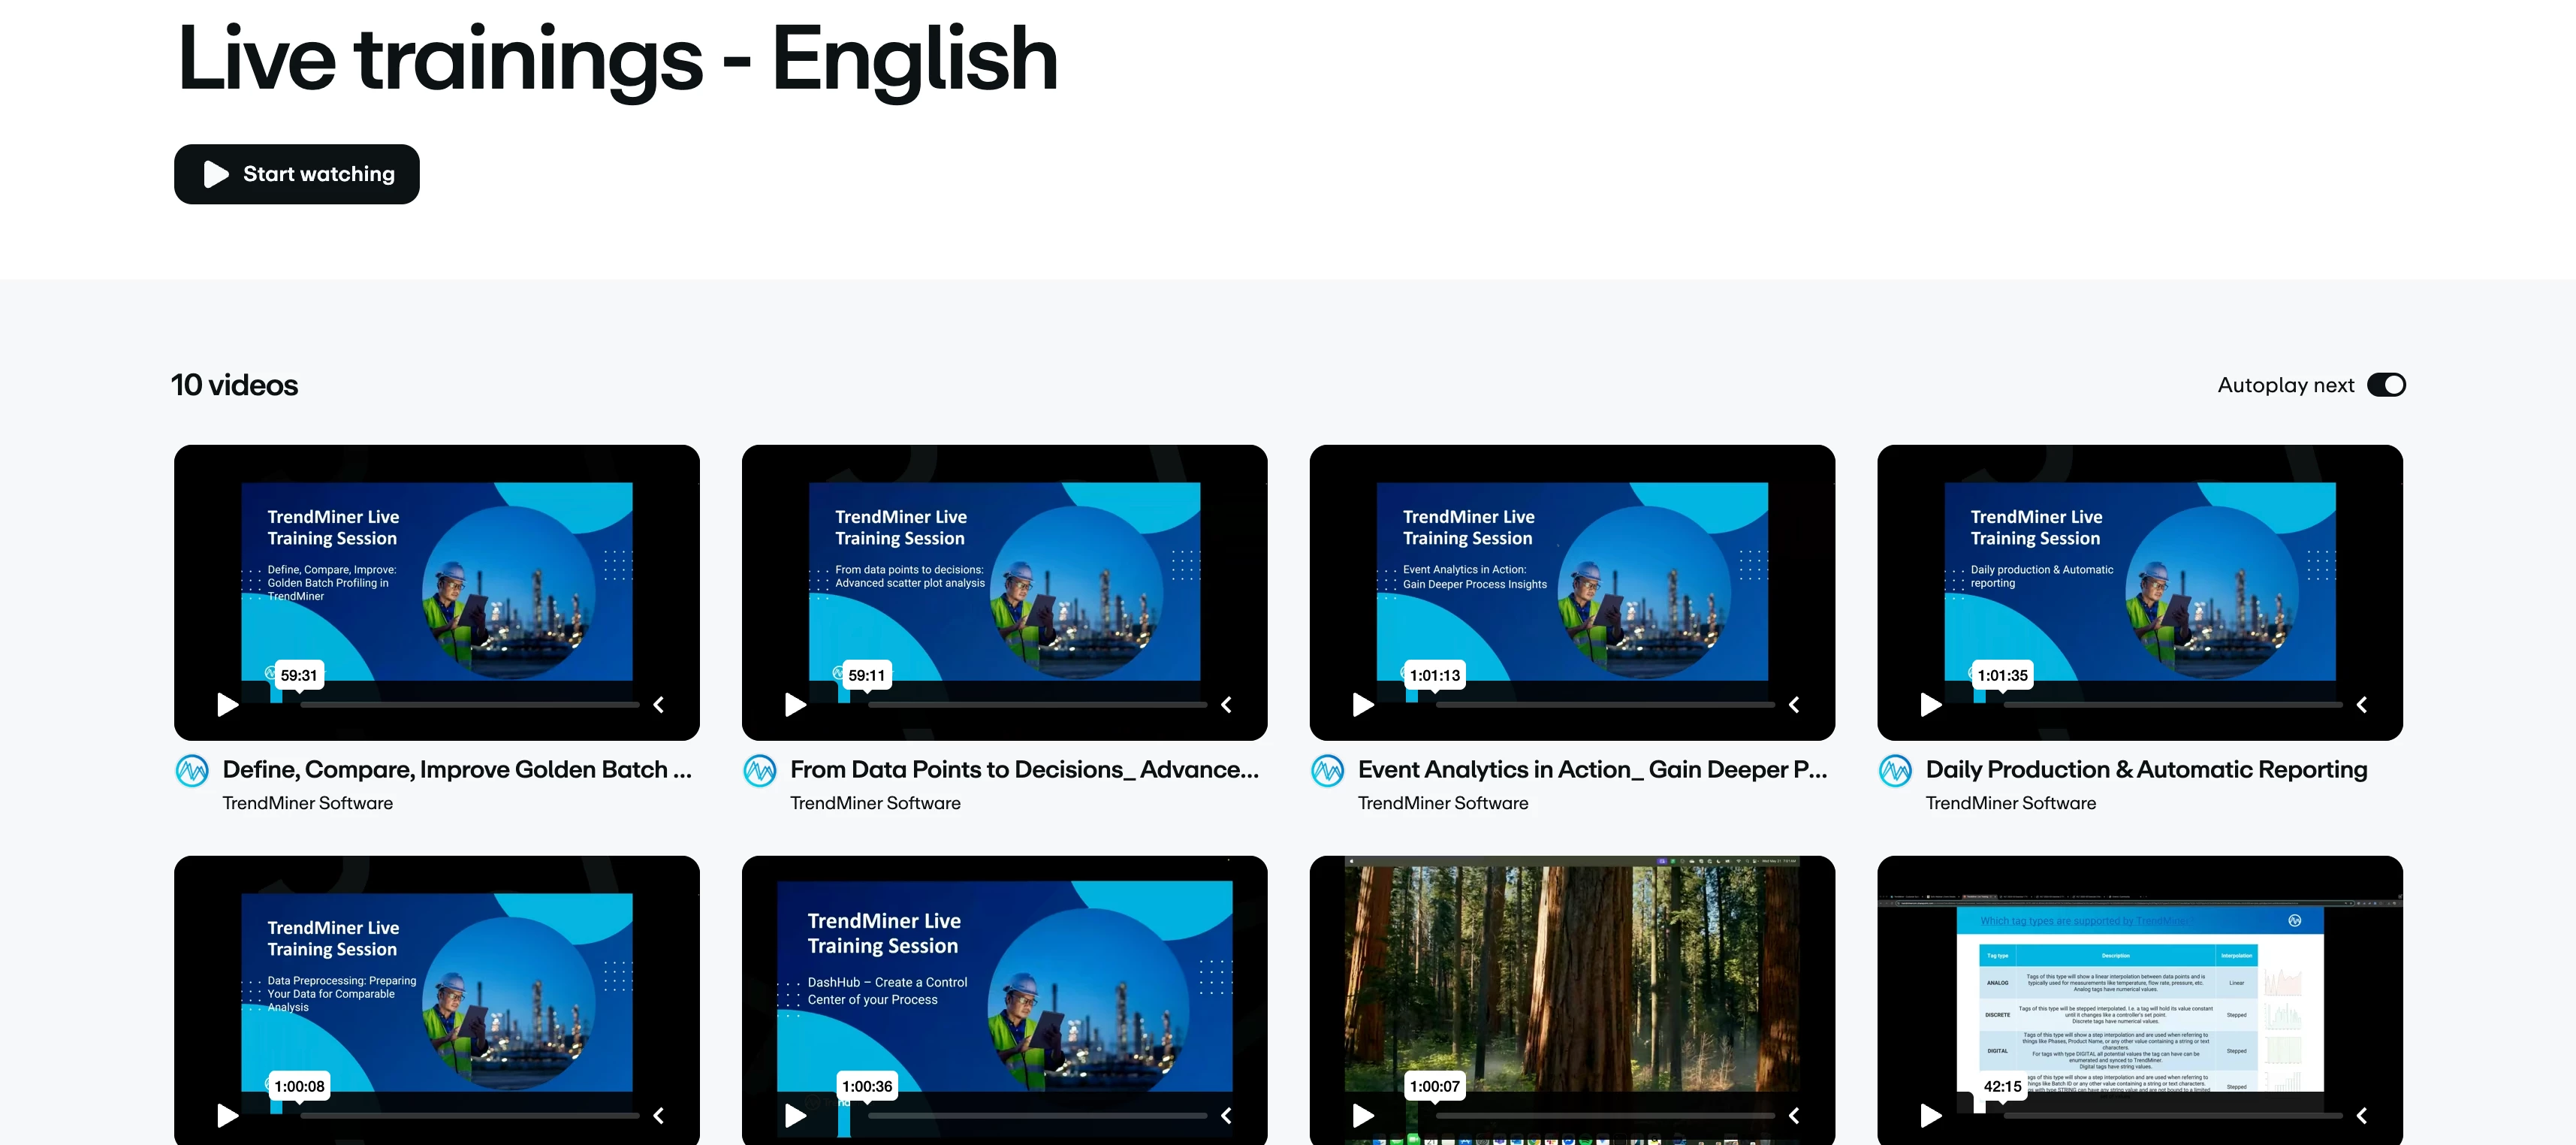
Recordings of our recent advanced trainings are available via the following Vimeo playlists:English GermanHere's an overview of the available recordings:Define, Compare, Improve: Golden Batch Profiling in TrendMiner [English, German] From Data Points to Decisions: Advanced Scatter Plot Analysis [English, German] Event Analytics in Action: Gain Deeper Process Insight [English, German] Daily Production & Automatic Reporting [English, German] Data Preprocessing: Preparing Your Data for Comparable Analysis [English, German] DashHub – Create a Control Center of your Process [English, German] Statistical Reporting Tricks: Track the Danger of Climate Change [English, German] Mastering Tag Types in TrendMiner – Tips, Tricks & Hands-On Exercises [English, German] Value Based Searches – Tips & Tricks [English, German] Data Importing - Everything you need to know [English, German]
Gantt charts give morning meetings a clear starting point. Every asset, its operational state, and any events from the last shift are laid out on one timeline, so teams can quickly see what happened overnight, agree on which anomalies are worth digging into, and move into investigation without spending the first 15 minutes piecing the story together from trends.A few practical applications we've seen work well:Instant "did we run?" answer. Green operational bars show uptime coverage at a glance, and any gaps immediately draw the eye. Batch cycle flags. Conditional formatting turns any batch red when cycle time, temperature, or quality exceeds threshold, so the meeting starts with the exceptions rather than the routine. Planned vs. unplanned at a glance. SAP or CMMS maintenance events sit inline with process upsets, removing the "was this us or them?" debate. One-click drill-down. Click any bar to open the context item and jump into TrendHub with tags and timeframe pre-loaded, moving fr
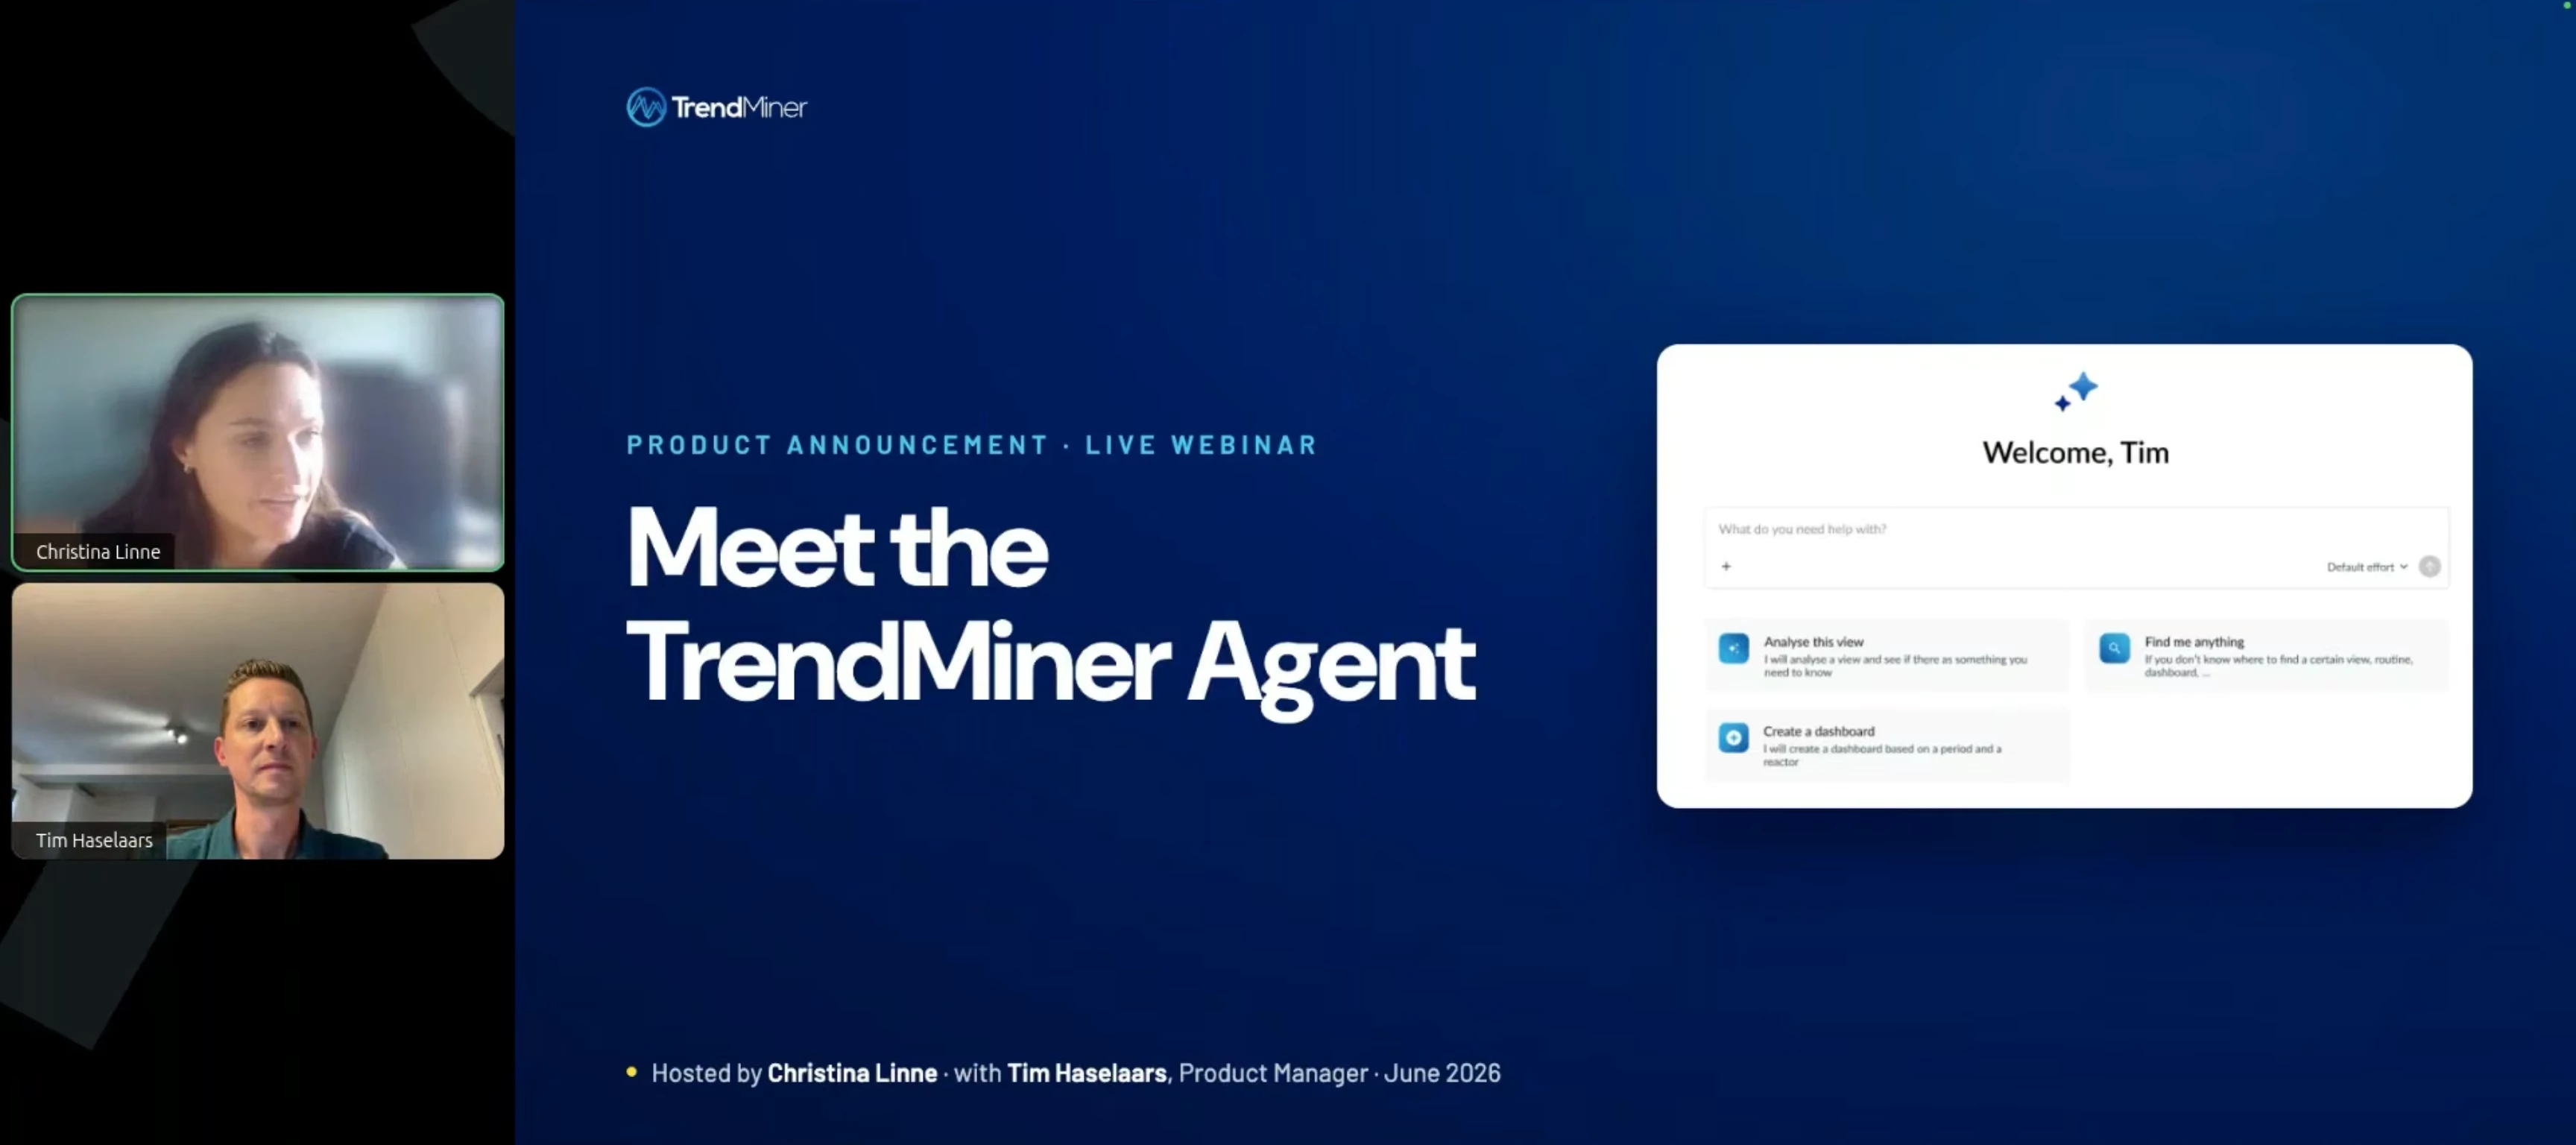
Yesterday, Christina Linne (Head of Product Marketing) and Tim Haselaars (Product Manager) hosted a webinar introducing the TrendMiner Agent, our native in-application AI capability. If you missed it or want to revisit it, the recording is available below. What's covered The session walks through what the TrendMiner Agent is, how it's built, and what it looks like in practice:The foundation: how the agent combines an LLM of your choice, TrendMiner's analytics tools, and your historian data into a single, orchestrated experience native to the TrendMiner interface Agent skills vs. agent tools: why giving an AI access to your data isn't enough, and how process engineering expertise is encoded into the agent's reasoning Live demo: a combined cycle gas turbine use case, from a rising heat rate anomaly through root cause analysis to economic impact quantification Routines: the companion feature that turns a one-time agentic analysis into a repeatable, structured workflow How this differs fro
Hello 👋In this session, we covered the different types of administrators in TrendMiner and what each one can do, the identity providers you can connect to manage authentication, and how user roles determine what people see and can act on. You can find the slides here. Watch the recording here 👇https://vimeo.com/1202174203?share=copy&fl=sv&fe=ci
Hello 🖐In Part 1, we got to know Yves and looked back on his journey with TrendMiner and our Community. Yves is Director Technology at Valero Energy, the largest independent refiner in America, based at their San Antonio headquarters. He’s responsible for some key applications related to Process Key Performance Indicators (KPI) monitoring, engineering documentation management and analytics with TrendMiner.Now let's look together at the lesson Yves believes every process expert should know and his advice for the next generation.Your LegacyWhat’s the achievement or moment you’re most proud of in your career?My unique background allowed me to be at the service of others, like Process SMEs, and I am proud that my work helps them with their day-to-day work and make them shine.What’s the most valuable lesson you’ve learned that you’d say “every process expert should know this”?This may sound odd, but I believe that there is a very high value in documenting your work and sharing knowledge.
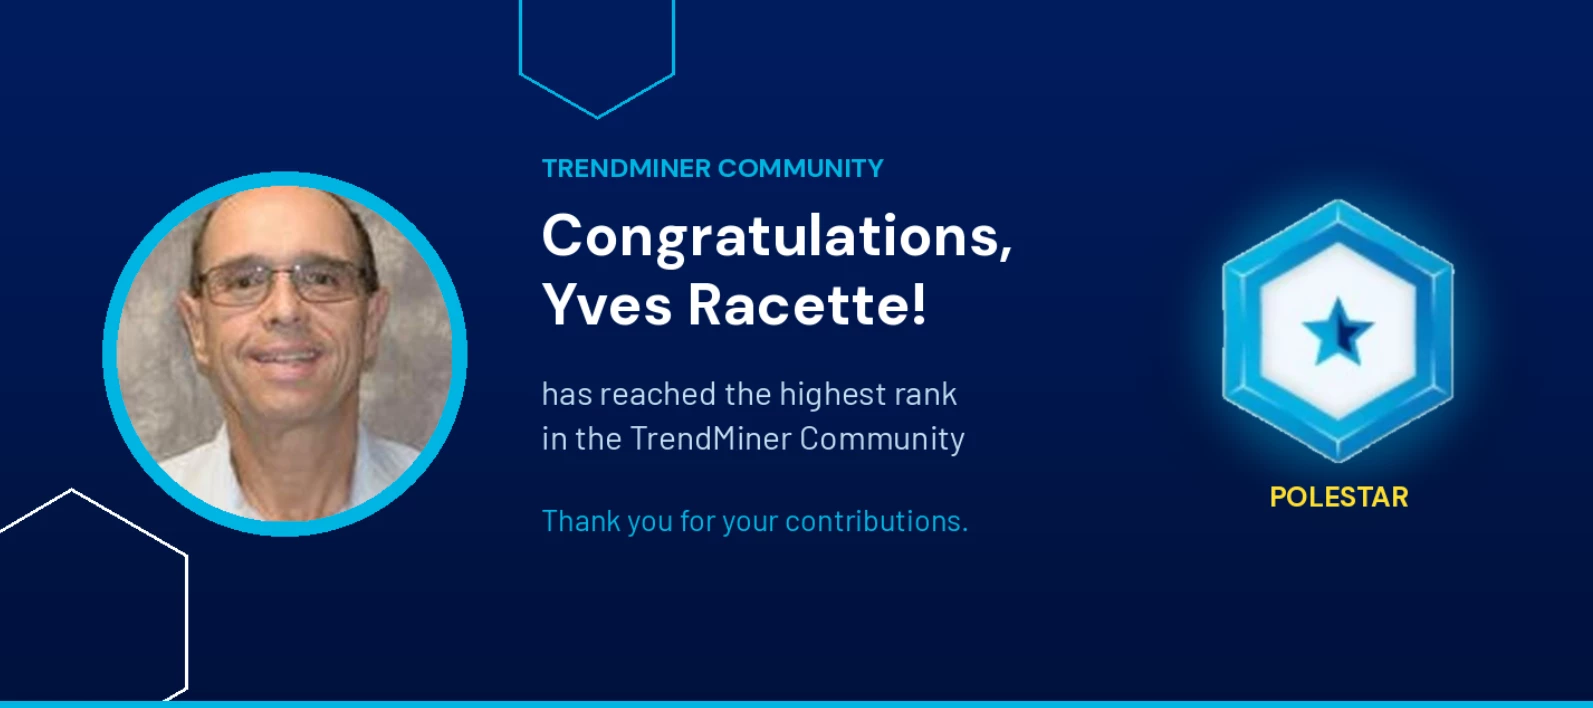
Hello 👋 We want to take a moment to recognize one of our most valued Community members: Yves Racette, who has reached Polestar🌟, the highest rank in our Community. 🎉 Yves is Director Technology at Valero Energy, the largest independent refiner in America, based at their San Antonio headquarters. He’s responsible for some key applications related to Process Key Performance Indicators (KPI) monitoring, engineering documentation management and analytics with TrendMiner.As Yves prepares to retire, we did an interview with him to capture his journey, the lessons he’s learned over a full career as a process expert, and his advice for the rest of us. Let’s Get to Know YouCan you tell us about your background?I graduated as a Chemical Engineer from Laval University in Quebec City, Canada. I had an unusual career for a Chemical Engineer as I worked in Automation, with Data Historian systems and in software development during my entire career.What’s your role day to day? I typically manage u
Hi! 👋The recording of our May 2026 live training Define, Compare, Improve: Golden Batch Profiling in TrendMiner is now available! 🎉In this webinar you can learn how to define your ideal process profile based on multiple calculations, analyze deviating process values, and detect and track deviations from the ideal profile. Perfect for users who want to establish best-practice baselines and drive consistent process performance.Recordings:German EnglishSlides:German English
"How do I prove the ROI of TrendMiner?"The value is usually there. But it lives in people's heads, in emails or in reports that have gone lost in Sharepoint. When the business asks for proof, you end up reconstructing instead of reporting.In the latest Success Series webinar for Strategic stakeholders, our CSM Lead @Tommy Peters presented a framework to capture value continuously. It's a lightweight system with three layers, explained below… Curious to see the full webinar? Check it out here: Layer 1: Capture at the moment of workWhen an engineer finishes a meaningful piece of analysis, they report four things right then:What problem it addresses How big it is roughly Who should validate it When it was completed.Don’t ask them to make a full ROI calculation, just capture enough context to build on later.Give the size scale some shape (e.g., Large means it affects a full production line or represents an estimated annual impact of €50,000 or more). Use whatever you already have: a field
Bridge the gap between identifying issues in your enterprise applications and analyzing the underlying process data, cutting troubleshooting time dramatically.Create a linkage between your external applications and TrendMiner by dynamically creating a URL to either a Dashboard or a TrendView with a pre-populated timestamps and process tags.Following the structure below to create URL Link to a (1) Dashboard or (2) Trend View.Dashboard Embed:https://your_trendminer_url/dashhub/dashboard/123?embed=true&startDate=2025-09-16T14:05:17.590Z&endDate=2025-09-18T14:05:17.590Z TrendHub View:https://your_trendminer_url/hps/index.html#/chart/externalView?start=1709856000000&end=1710374400000&tag=tagname1&tag=tagname2&tag=tagname3
Hello,Our third TrendMiner Success Series Strategy webinar's recording is now available! In this session, we walked through the three stages of value maturity we see across our customer base, the behavioural reasons most programs stall in stage one, and a three-layer approach you can start applying next week to catch value at the moment it happens, harvest it as a team, and build a portfolio your sponsor can defend.Watch the recording:
Here’s a question that pops up regularly in customer meetings, usually 2 to 3 years in:"What value are we actually getting from TrendMiner?"It's a fair question. And it almost always leads to a second one that's harder to answer:"What value were we hoping to achieve?"When nobody has a clean answer to that second question, people start listing anecdotes, pulling up usage numbers, trying to build a case on the fly. It feels defensive rather than confident. Even when the results are real… The fix is actually simple: a one-line vision. One sentence, written before the program gets started (or now if you don’t have one yet), that answers: what are we trying to achieve, for whom, by when. Bayer called it: "Uncover hidden potential to initiate process improvements directly on site." Ten words that gave the program lead a filter for every use case decision and the sponsor something concrete to fund and protect.From there, the use cases selected themselves. A root cause analysis of viscosity pr
Hello,In this session we walked through how indexing works, what the different index statuses mean, how to read and act on indexing performance, and which parameters are worth tuning for your specific setup.You can find the tag index update simulator here. It calculates if index delays can be expected based on the number of indexed tags and their index policy, the configured number of indexing threads and the data source response times.You can read the slides here.Watch the recording: Got questions about this webinar? Share them with us in the comments! 👇
Hello 👋,We had the 2026.R1.0 release webinar yesterday. Thanks to everyone who joined!For those who missed it, here are the recording, slides and full release notes:📽️ Watch the recording 📊 Check out the slides📄 Full release notes Share Your Product Ideas with usFunctionality requests can be submitted at https://community.trendminer.com/ideas Requests are reviewed regularly by the product team. Several features in this release originated from Community submissions. Here is the summary of the webinar: Collapsed Plotting When a filter is active, users can now collapse filtered-out time periods. The remaining data is stitched together and scaled to fill the full chart area. Gap indicators mark where data is non-continuous. This view also applies to Dash Hub tiles. Context Field Configuration Administrators can now configure individual context fields per type with the following options: mark a field as required, set a field to read-only, define field display order, set decimal precis
Remember when creating a downtime report meant hours of digging through data, building charts, and wrestling with spreadsheets? Those days are over!By integrating TrendMiner's AI MCP server with your own company’s AI platform (MS Copilot, ChatGPT, Anthropic, etc.) you can now generate comprehensive downtime reports in seconds with just a simple prompt. Behind the scenes, TrendMiner's AI MCP talks directly to your instance while pre-trained skills handle extracting the right data, analyzing patterns, and formatting everything into a professional report.Reach out your CSM or Account Executive if you want to learn more about our AI Early Access Program so you can start leveraging AI with TrendMiner.
Every process engineer has been there. A lab sample comes back out of spec, and now you're working backwards through twelve hours of data trying to figure out what went wrong. The investigation eventually finds something. Maybe a feed shift, a heat exchanger drift, a utility upset. By then the batch is already off-spec and the conversation in the morning meeting is uncomfortable.The goal isn't to investigate faster. It's to see the excursion coming. TrendMiner has the building blocks for predictive analytics in the standard toolkit, no ML Hub required. The workflow below turns one investigation into a soft sensor that runs continuously and warns you before the next excursion lands. Customers like Bayer (a 10% production capacity increase), Kuraray (30 hours of unscheduled downtime prevented) and CP Kelco (potential savings above $1M per year from process deviation reduction) have all turned this kind of analytical work into measurable operational outcomes.The path from excursion to sof
The TrendMiner version lifecycle policy is something many admins only discover after something goes wrong. This post explains what it means and what kind of support you can expect at each level. For the current list of supported versions and end of life dates, always refer to the TrendMiner Lifecycle page. Support levelsEvery major TrendMiner release has a support level associated with it. Minor versions always inherit the same support level as their major release.Full support (latest and latest − 1) : The two most recent major releases receive full SLA coverage. High-impact bugs and security issues are actively patched, and fixes for low-impact issues are included in the next release. Patches are released periodically — subscribe to the patch notification form to stay informed, or check the Patch Release Updates page directly.Upgrade support (at least 1 year after release date) : Once a version falls outside the two most recent releases, it enters upgrade support. Only upgrade-blockin
Enhance your TrendMiner dashboards with AI-generated video walkthroughs. Use Copilot-powered Clipchamp to quickly create professional videos that help users understand and get more value from your dashboard data. Step 1: Create a Clipchamp Video in SharePoint Step 2: Generate Your Video with AIWrite a clear description of your video's purpose and provide the script for your audio or on-screen text. Let Copilot AI do the heavy lifting—it will generate a polished, professional video in seconds. Once created, export it as an MP4 file, ready for embedding. Step 3: Embed as an External Content Tile in TrendMinerPreview your video in SharePoint to get the iframe source URL, then embed it as an external content tile in TrendMiner.
📌 BackgroundEvery production site collects and stores massive amounts of process data — far more than is typically analyzed. For engineers, gaining a holistic view of plant operations can be a daunting task.TrendMiner’s layer comparison and compare table features make it easy to visualize and quantify how different operating periods performed, side by side.By leveraging this functionality, users can quickly identify high-performing periods and understand which process conditions led to those results. 📌 ObjectiveUse historical data to identify ideal operating conditions by comparing performance over several time periods (for example, across months).With just a few clicks, TrendMiner users can: Compare key process variables over multiple months, Identify which periods performed best, and Spot potential process differences that may have led to underperformance. 🛠️ Solution1. Create a Layer for Each PeriodStart by selecting the process tags you want to compare — for example: Raw m
After 10+ years of seeing TrendMiner implementations succeed (and sometimes not), one thing stands out: our most successful customers share the same characteristics. That observation, combined with change management principles, is what led us to build the TrendMiner Success Framework.You're already using TrendMiner to solve real process challenges. The question is how much more value is within reach. Across different implementations, we consistently see the same areas where untapped potential lies:Adoption stays limited to a handful of enthusiasts Value remains anecdotal rather than quantified Best practices live in the heads of individuals Momentum is hard to sustain after initial onboarding Success at one site doesn't spread to others The program isn't clearly connected to company strategyThese are not problems, they are opportunities. And the framework is built to address these... The 5 pillars of successful adoption 1. Vision & ObjectivesA clear vision converts a technology pur
Hello,We are bringing back our dedicated Admin Training for TrendLab 2026. This training is a unique opportunity to learn more on how TrendMiner is working under the hood and how you as an admin can support your users to get most out of TrendMiner.What can you expect from this training:Learn how to configure and fine tune your instance for optimal performance Get to know the latest improvements and features and what's coming up Learn basic and more advanced troubleshooting Share experiences with us and other participants and get detailed feedback on all your technical questionsThis session is aimed towards TrendMiner application and system administrators with at least a basic knowledge of networking, API's, Linux, SQL, …Note: If you joined the Admin training at TrendLab 2025, we recommend exploring our other trainings to learn new skills. 👉 TrendLab 2026📍 Eindhoven (Europe): Sep 23 & 24📍 Houston (Americas): Oct 7 & 8Register today: https://community.trendminer.com/p/trendlab
Hello,At TrendLab 2026, we are introducing another new training specifically for Project Managers.On this session you will get TrendMiner Impact Playbook and see proven strategies from our leading customers on how they successfully scaled TrendMiner and delivered measurable business value.🗓 Here is the agenda for this training:MorningWelcome, coffee & introductions What separates high-performing analytics programs from the rest Why some programs grow and others stall — and the five decisions that make the difference Building a vision people actually follow Connecting TrendMiner to business priorities that leadership cares about Getting the right people in the right roles The champions, sponsors, and enablers high-performing programs have in common Keeping TrendMiner visible and momentum alive Communication strategies that sustain engagement long after go-liveLunch & Peer NetworkingAfternoonProving the value your business needs to see Moving beyond usage metrics to business im
Big news for our Community!For the very first time, we are introducing a dedicated Basic Training on Day 1 of TrendLab 2026! Join this entry level training and get kickstarted on your Industrial AI and Analytics journey with TrendMiner.Why this mattersInstead of only functionality tour, we will focus on performing essential, high-value tasks using real-life operational examples. You can expect clear takeaways you can apply the same day. What you’ll get: Fundamentals: Get acquainted with the basic concepts and terms. AI Agent: Learn to leverage the powerful new AI capabilities, and see how your first steps in TrendMiner immediately lead to high-value actionable outcomes. Everyday workflows: Step-by-step guides for the essential high-value workflows. Real Life Use Cases: Short exercises where you will produce usable insights during the session. Practical tips: Best practices to avoid common mistakes and use TrendMiner more efficiently. 👉 TrendLab 2026📍 Eindhoven (Europe): Sep
Hello,Transcend self-service data analytics and learn how TrendMiner becomes a true platform for scaled out solution packages.In this session, you will combine the powerful AI capabilities and Python-based customization options to build a smart asset health dashboard. You will then use those same tools to roll out that dashboard at scale, automatically replicating it across multiple assets. Session Agenda: Tooling: Combining TrendMiner’s embedded AI agent with Python‑based customization. Development: Hands-on build of a smart asset health dashboard. Deployment: Leveraging automation to roll out the dashboard across the entire asset fleet. Discover how your creativity becomes the only limit to what you can build in TrendMiner.👉 TrendLab 2026📍 Eindhoven (Europe): Sep 23 & 24 📍 Houston (Americas): Oct 7 & 8Why should you join this training day? Because nothing beats learning directly from experts, in-person, with a community of peers who face the same challenges as you.Regi
Hi! 👋The recording of our April 2026 live training From Data Points to Decisions: Advanced Scatter Plot Analysis is now available! 🎉This training is about Advanced Scatter Plot Analysis, and you can learn how to analyze heat‑exchanger behavior, identify operating areas, compare different time ranges, and visualize relationships through flexible curve drawing.Recordings:German English Slides:🇩🇪 German🇬🇧 English Got any questions? Share them with us in the comments below! 😊
Already have an account? Login
No account yet? Create an account
Enter your E-mail address. We'll send you an e-mail with instructions to reset your password.