I want to trend a highly fluctuating tag over a period of 2 - 3 years to find a possible Trend below. Aggregation over 24 h ) is not sufficient. How can I do do stronger aggregated trending?

Page 1 / 1
Hello
Maybe the Event Analytics functionalities available on the TrendMiner Searches, combined with a Value Based Search on a monthly time tag can help you out here.
This is what I would suggest:
- Add the tag TM_month_Europe_Brussels (or any other time tag for your time zone) to your view
- Perform a Value Based Search with condition TM_month_Europe_Brussels constant
- Add a calculation for the average of your tag of interest
- Via the 3 dot menu on the search results, open Event Analytics
- Navigate to the Scatter plot and dive into the plot that represents your average value vs. the start date of the search results. This will show you the average value of your tag per month over time.
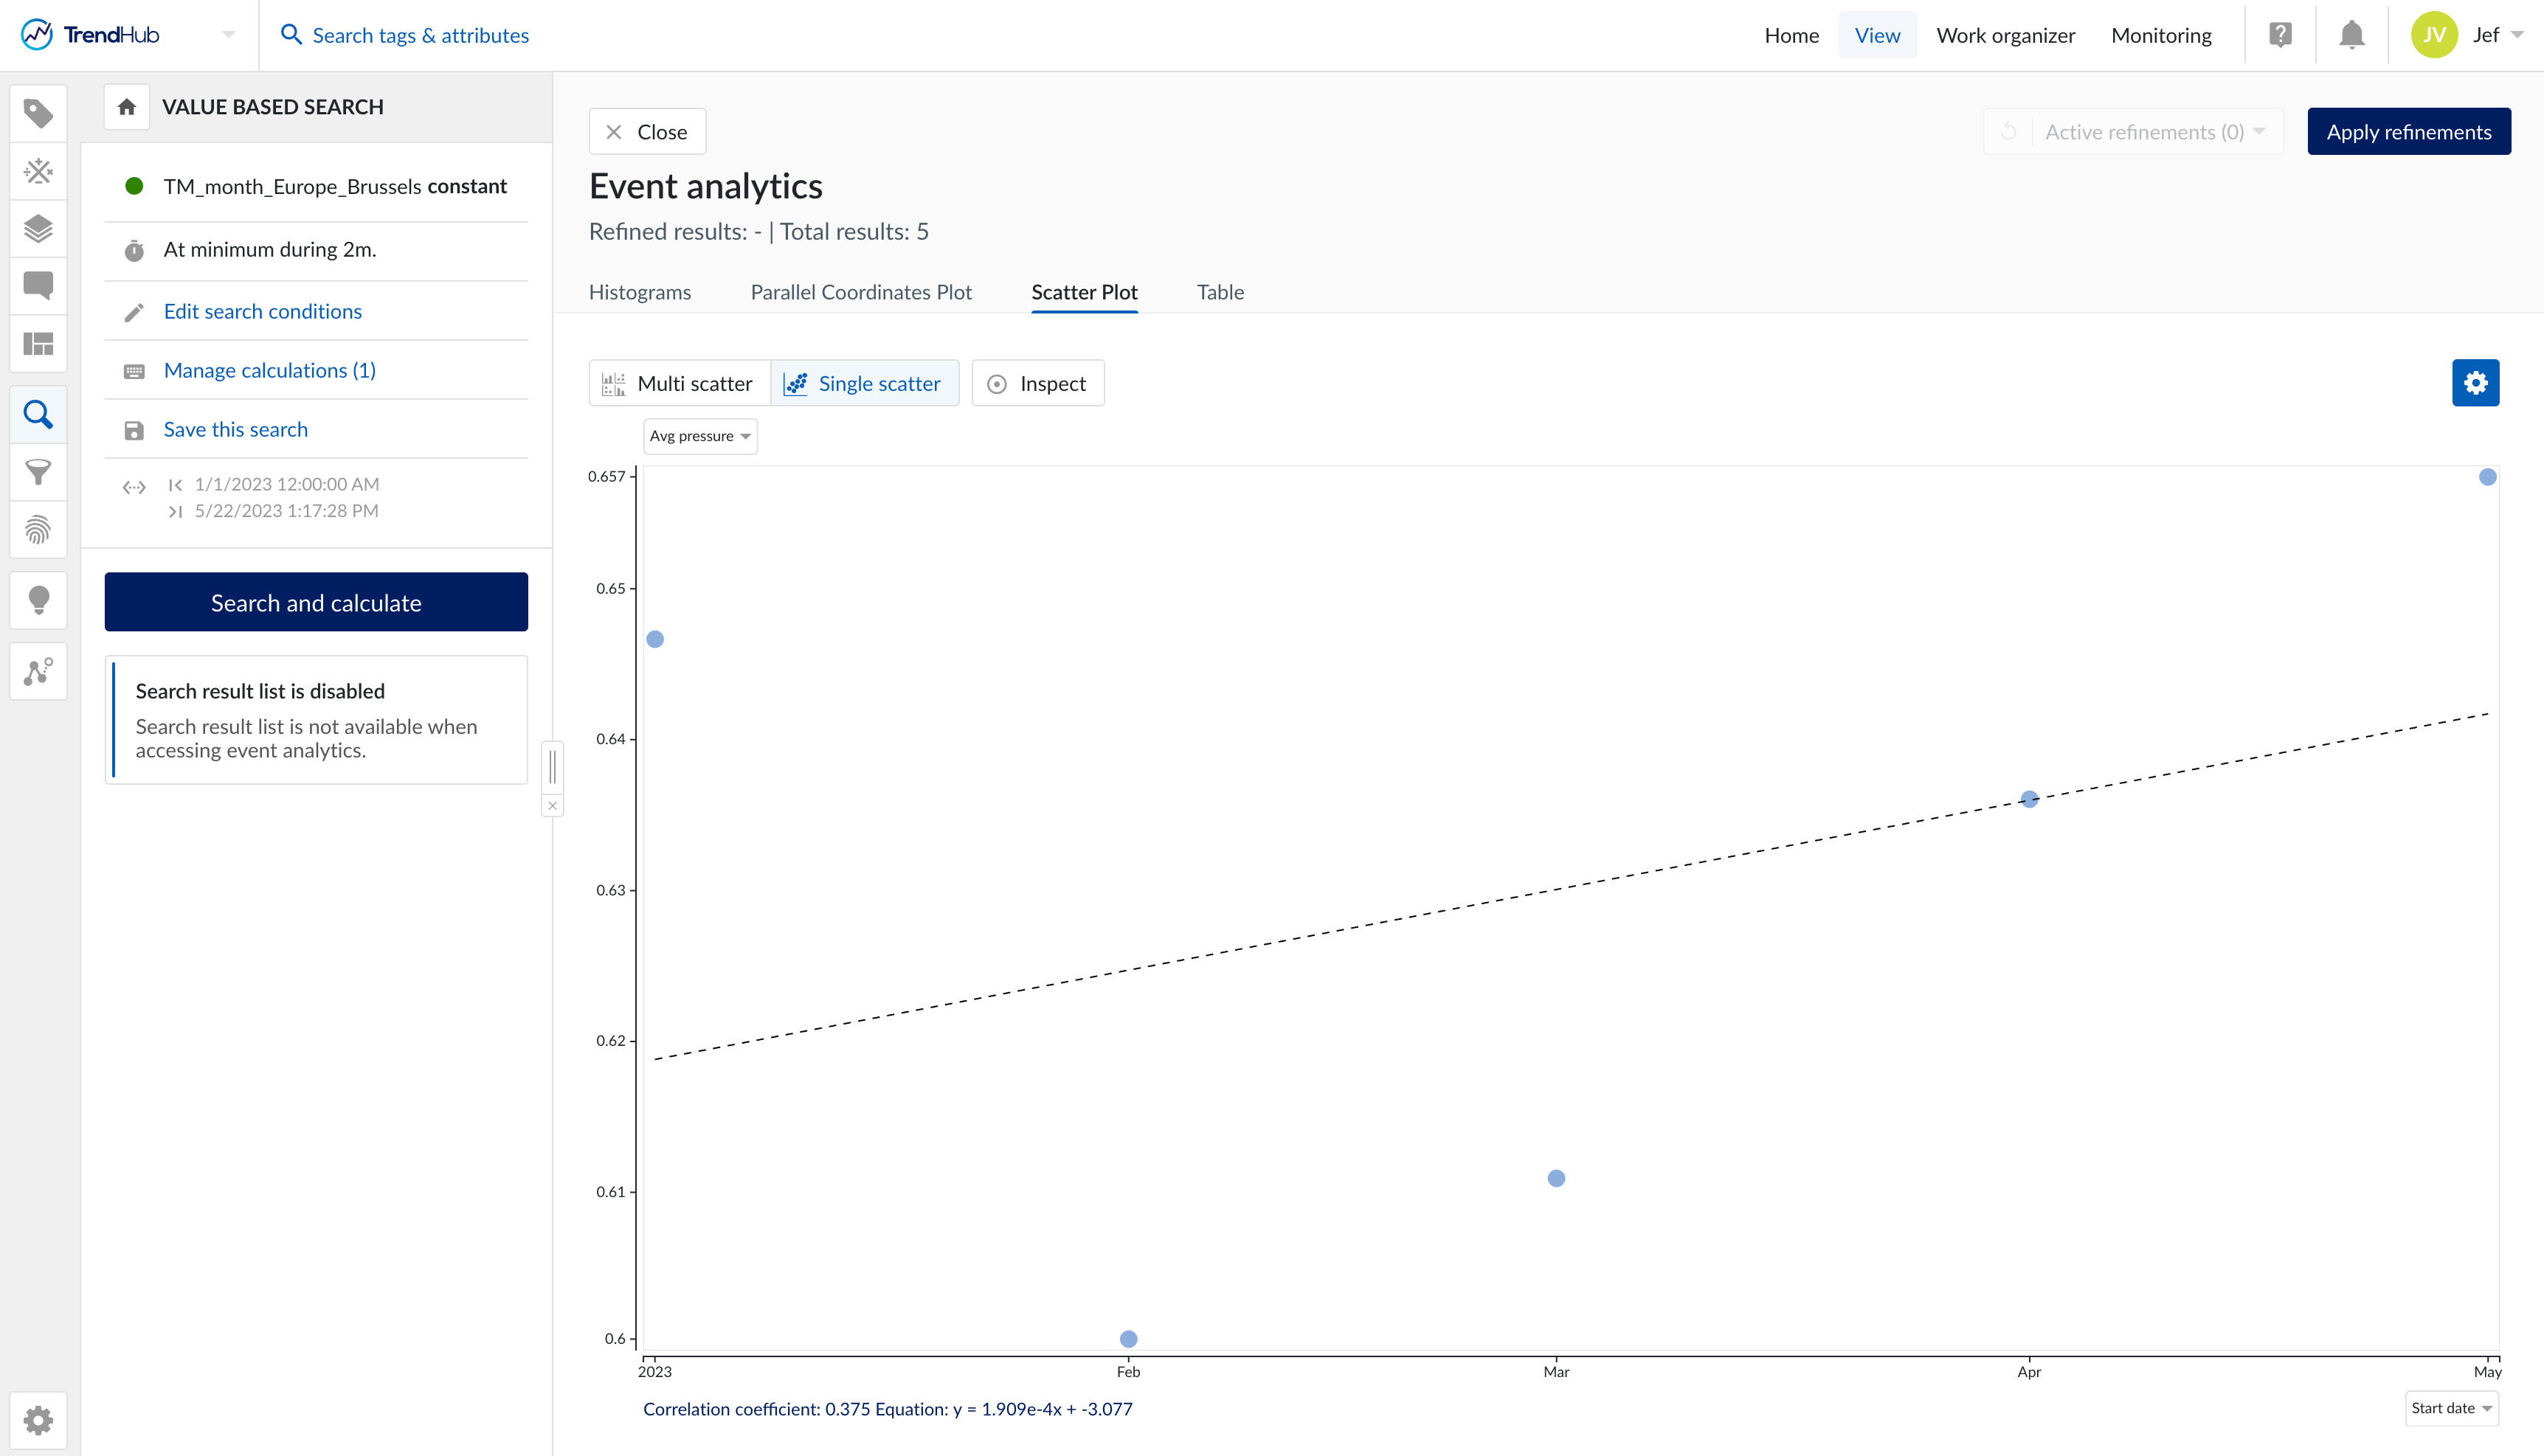
Mind that this functionality is only fully available in TrendMiner version 2024.R3.1.
Also feel free to add a Product Idea for Aggregation Tags over longer time periods in the Product Ideas section of this Community, so other customers can indicate their interest in this kind of functionality by voting on your idea.
As an alternative, the Custom Calculations functionality (available with an expert license) would also make it possible to define your aggregated tag yourself.
Hi Jef,
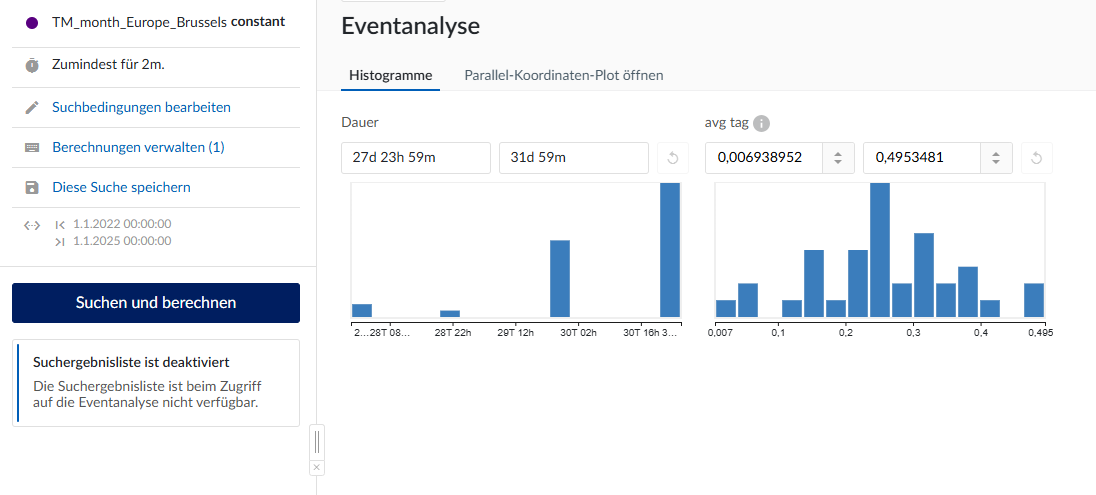
thank for the solution. Looks indeed like something I look for. Unfortunatelly I only have histogramm and parallel coordinate plot as option available and we have not licensed the ML user.
Think I will push for an update of our TrendMiner to the latest version at our IT.
Thank you for your effort.
Hi
Happy to hear this is helpful. Upgrading should get you access to the Scatterplots in Event Analytics indeed. Event Analytics received multiple upgrades and extensions throughout the latest TrendMiner releases, with more to come.
In the meantime, you could export your search results to an Excel file and create a similar graph there, so you can make progress while the upgrade is in the works.
Reply
Login to the community
No account yet? Create an account
Enter your E-mail address. We'll send you an e-mail with instructions to reset your password.