

Applying Transformations to Your Tag Data in TrendHub
In process data analysis, relationships between variables are often assumed to be linear. However, real-world process relationships can be more complex and often are. For example, the relationship between pressure drop and flowrate is only linear under laminar flow conditions. In turbulent flow, which is more common in industrial processes, the relationship follows a quadratic function, as described by the Darcy-Weisbach equation.
Because of these complexities, it is crucial to apply transformations to your data to properly analyze and interpret process relationships. TrendMiner's formula tag builder provides a way to achieve this.
Example: Analyzing Pressure Drop Across a Flow Pump
In this example, we analyze the pressure drop across a pump using two tags:
-
Flowmeter Tag (Q) - “TM-HEX-FI0620”
-
Pressure Drop Tag (ΔP) - “TM-HEX-PDI0620”
When plotting these tags on a scatterplot, we observe that the relationship is not linear. Instead, it follows a quadratic trend, which aligns with the fluid dynamics theory that predicts pressure drop is proportional to the square of flowrate.
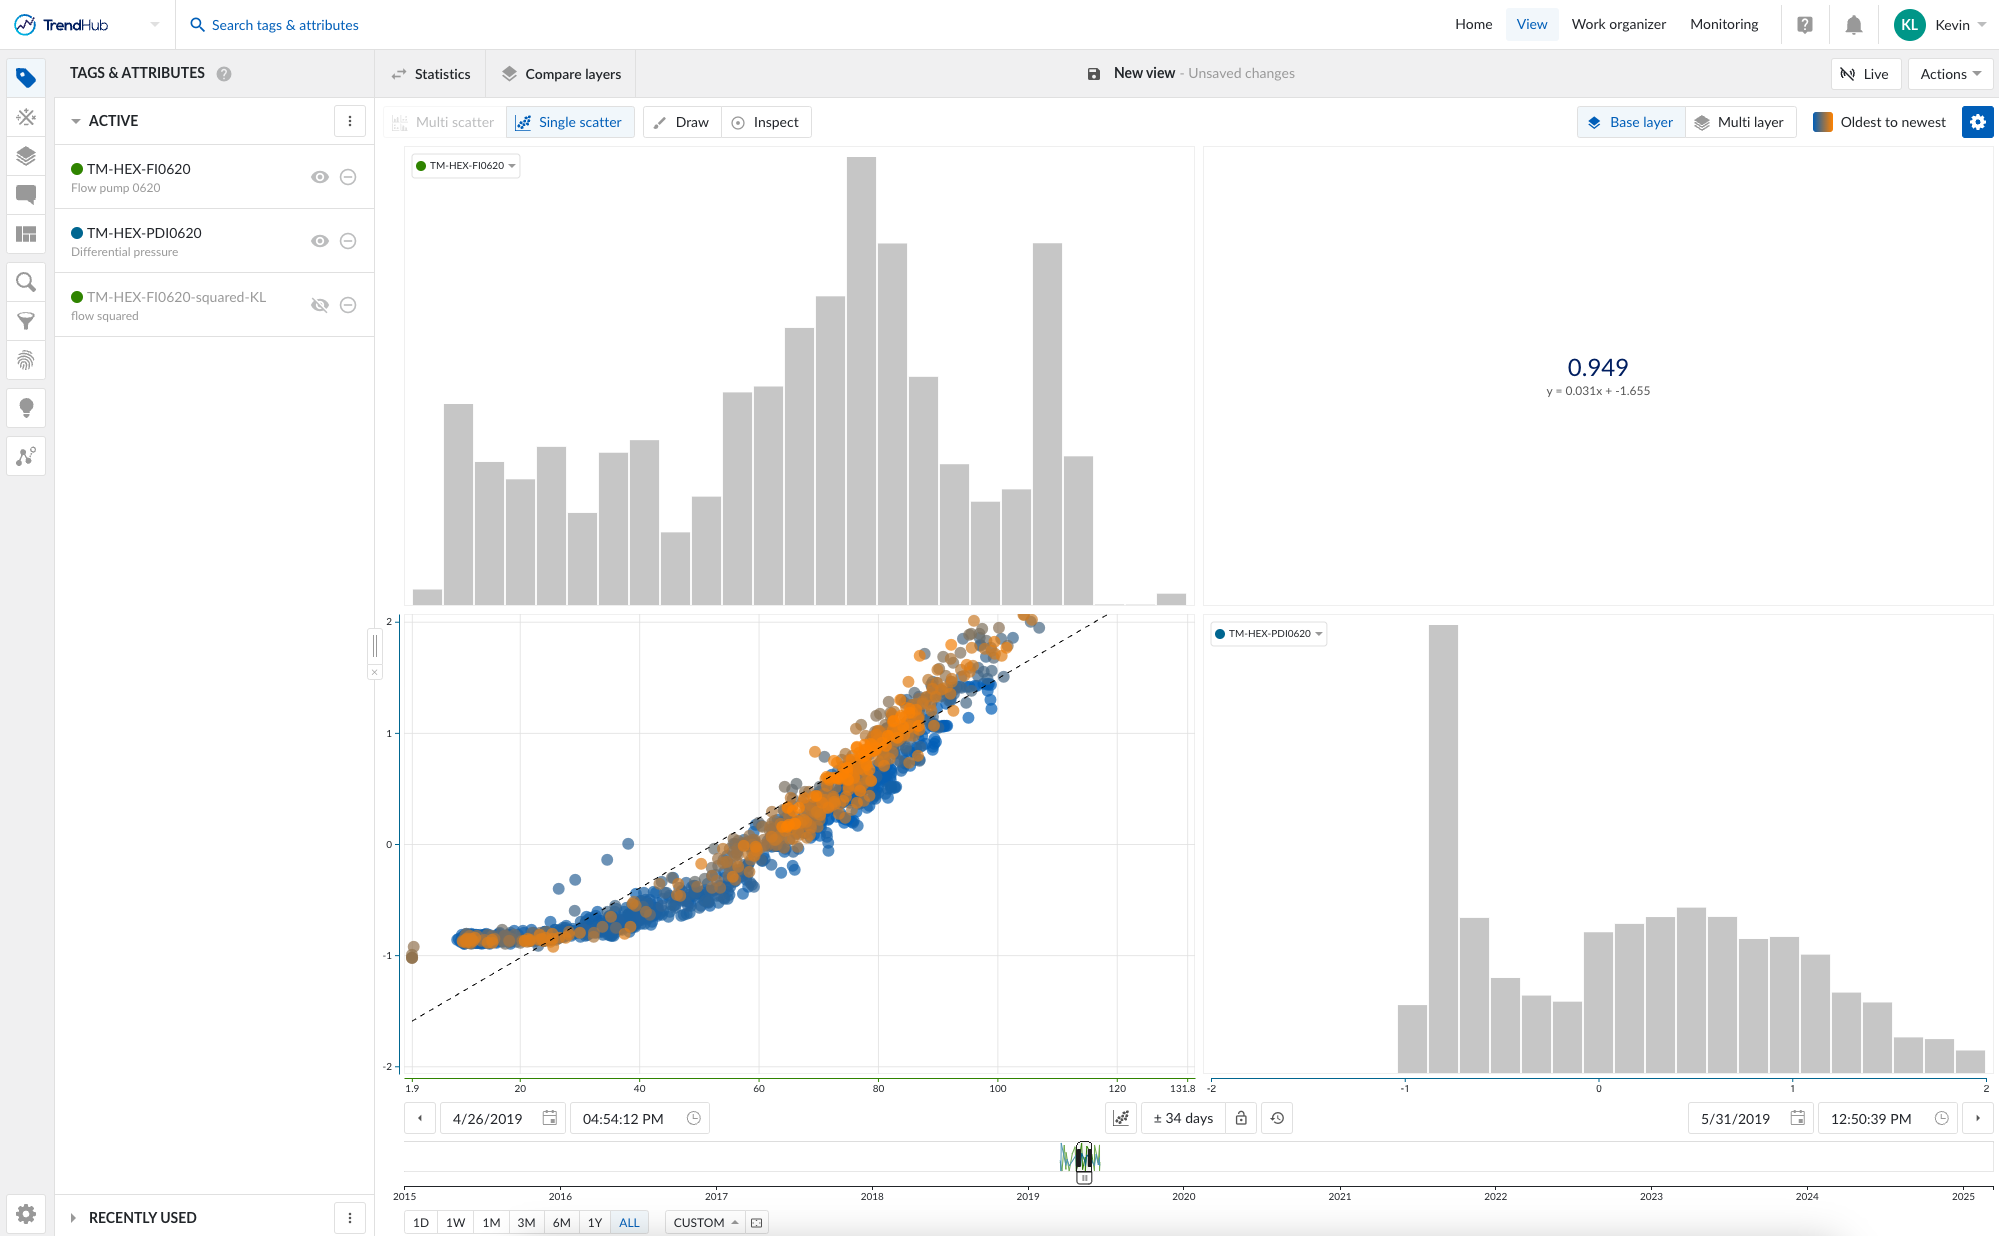
Applying a Transformation in TrendMiner
To linearize this relationship, we can apply a transformation using the formula tag builder:
-
Create a New Formula Tag
-
Open the formula tag builder in TrendHub.
-
Define the formula as Q * Q.
-
Map the variable Q to the flowmeter tag.
-
Save the new squared-flowrate tag.
-
-
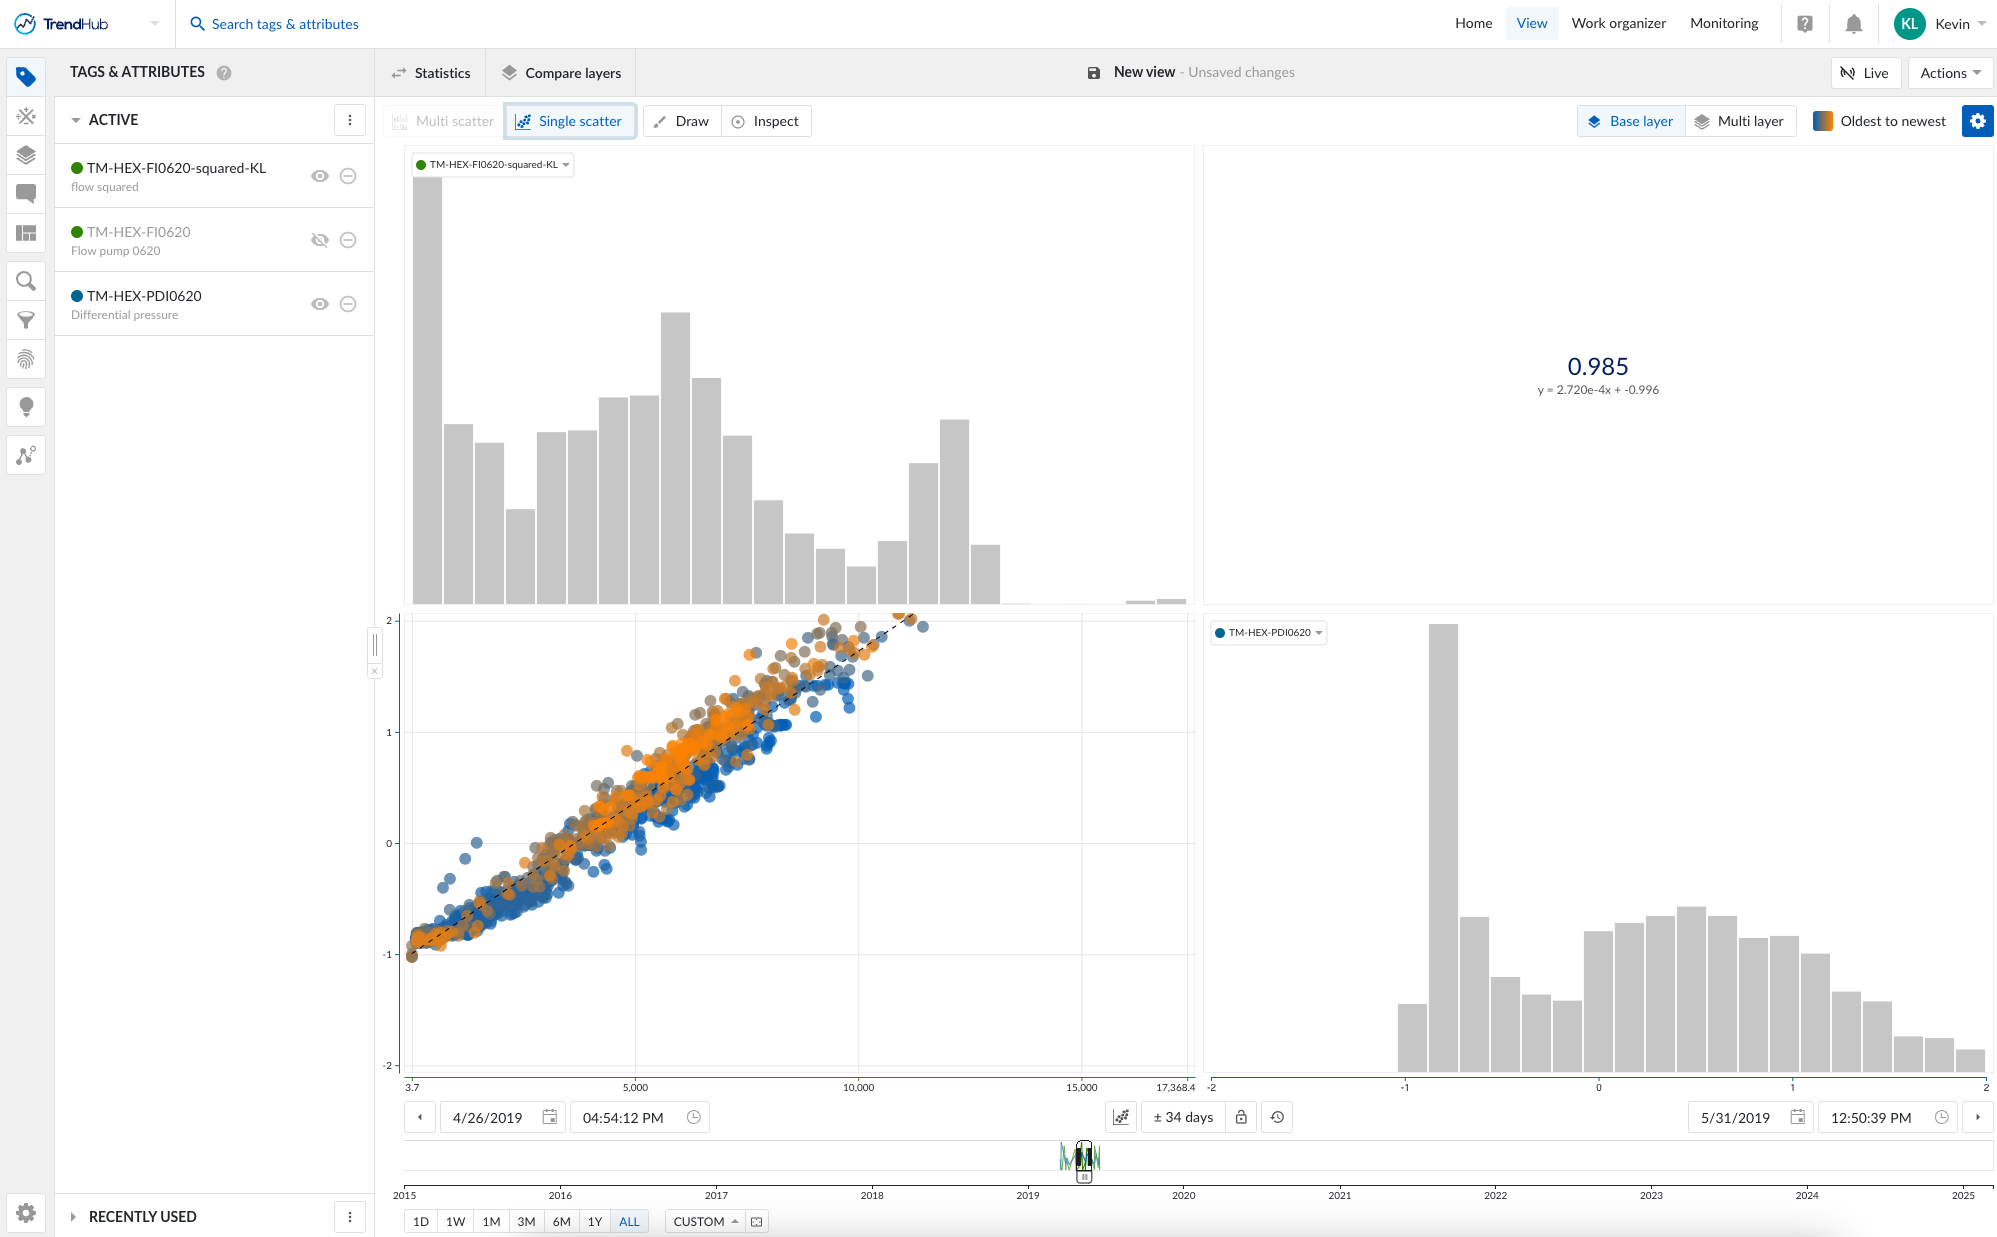
Re-examine the Scatterplot
-
Plot the newly created flowrate squared tag against the pressure drop tag.
-
The scatterplot now exhibits a more linear relationship.
-
-
Evaluate the Correlation
-
Use the correlation coefficient and line of best fit tools in TrendMiner.
-
These statistics are now more meaningful because the transformation has revealed the true linear relationship.
-
Key Takeaways
-
Process relationships are often nonlinear, so transformations can improve data interpretation.
-
Applying the appropriate transformation (e.g., squaring flowrate) helps linearize the relationship.
-
Linearized data allows for better statistical insights and more accurate process optimization.
Try applying transformations to other nonlinear relationships in your data and see how they enhance your analysis!