
Sometimes, for better visualization and monitoring, it is helpful to represent the durations of certain important events in the plant within a variable. This is possible in TrendMiner by following a couple of steps.
First, it is necessary to create a slope tag, from 0 to 1, that connects the start and end points of the event.
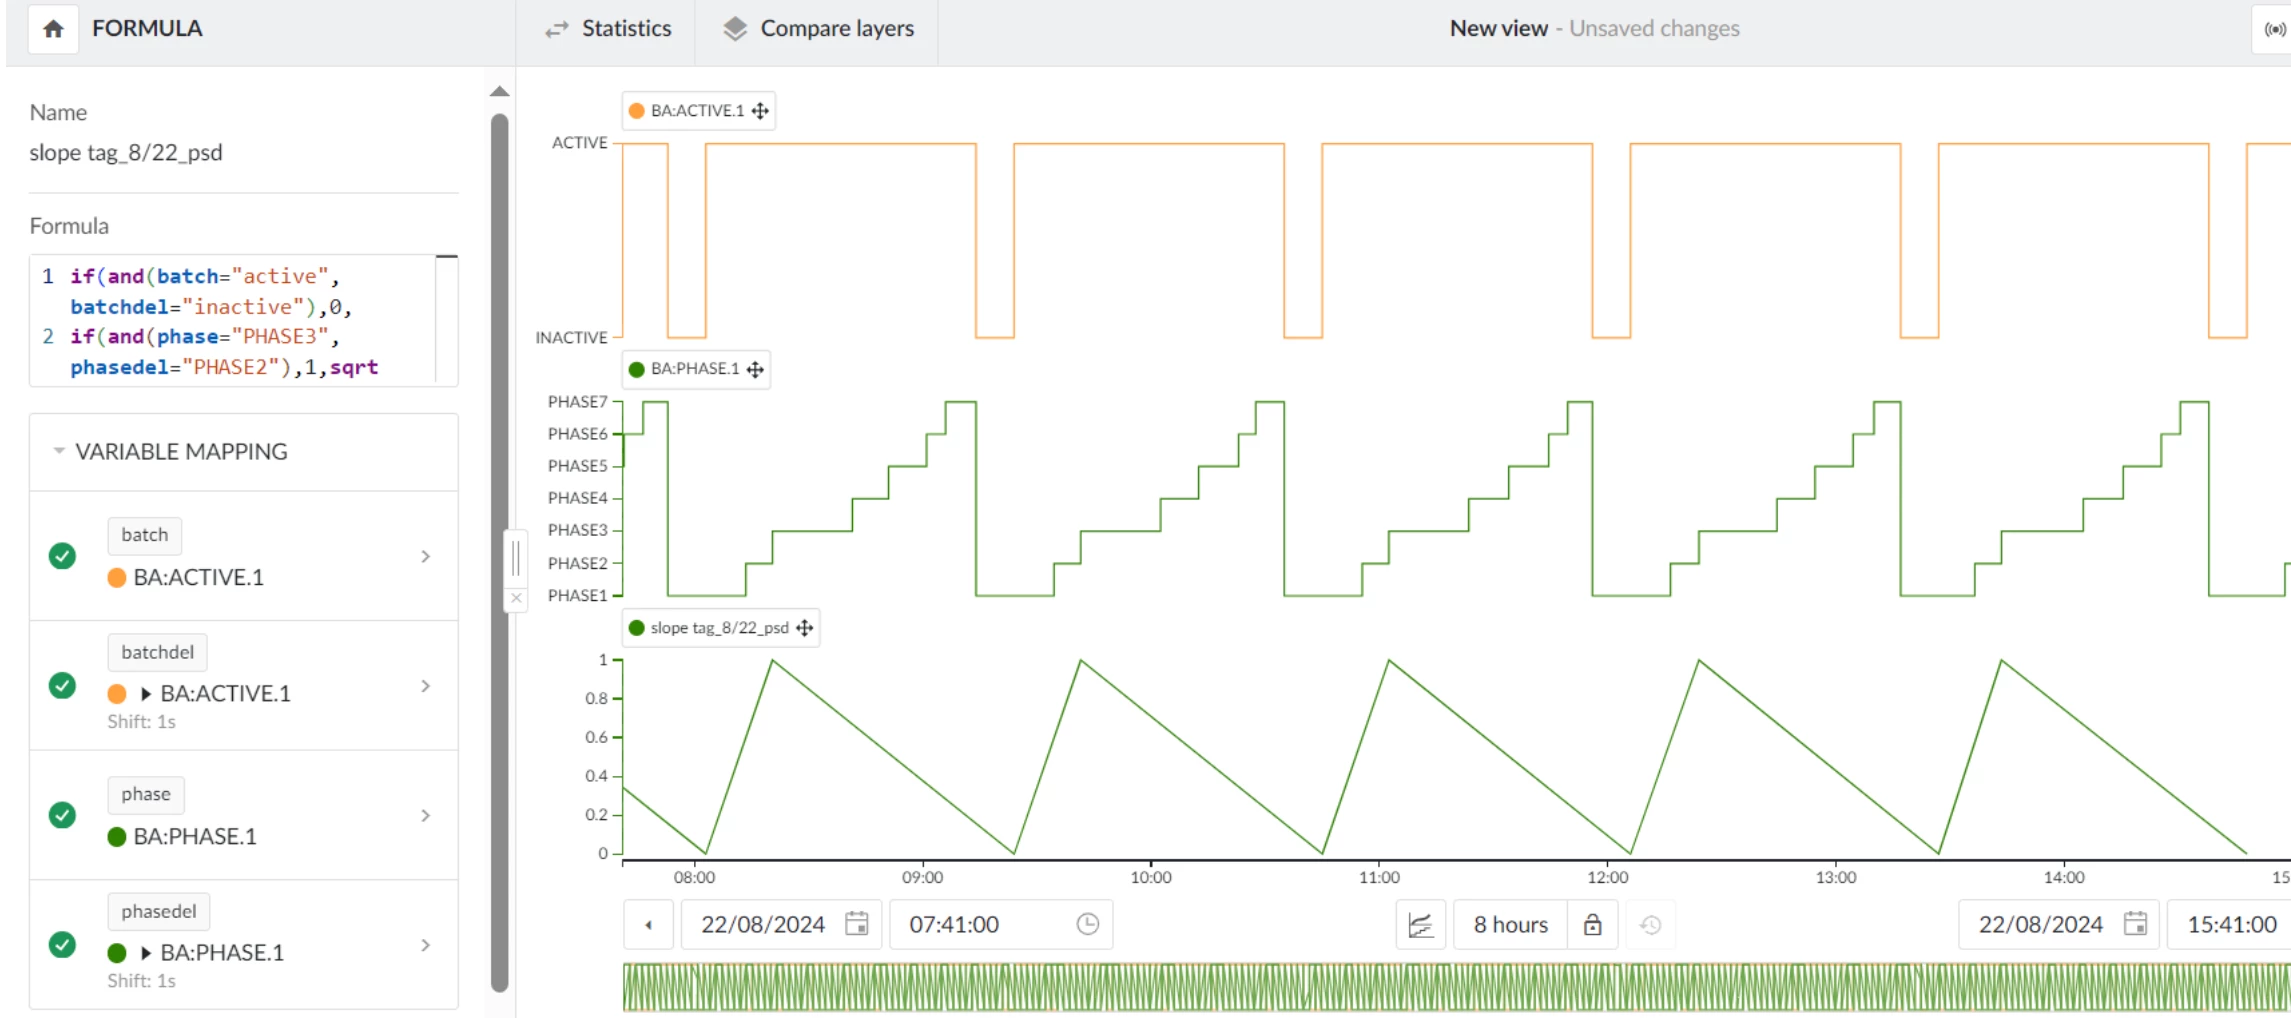
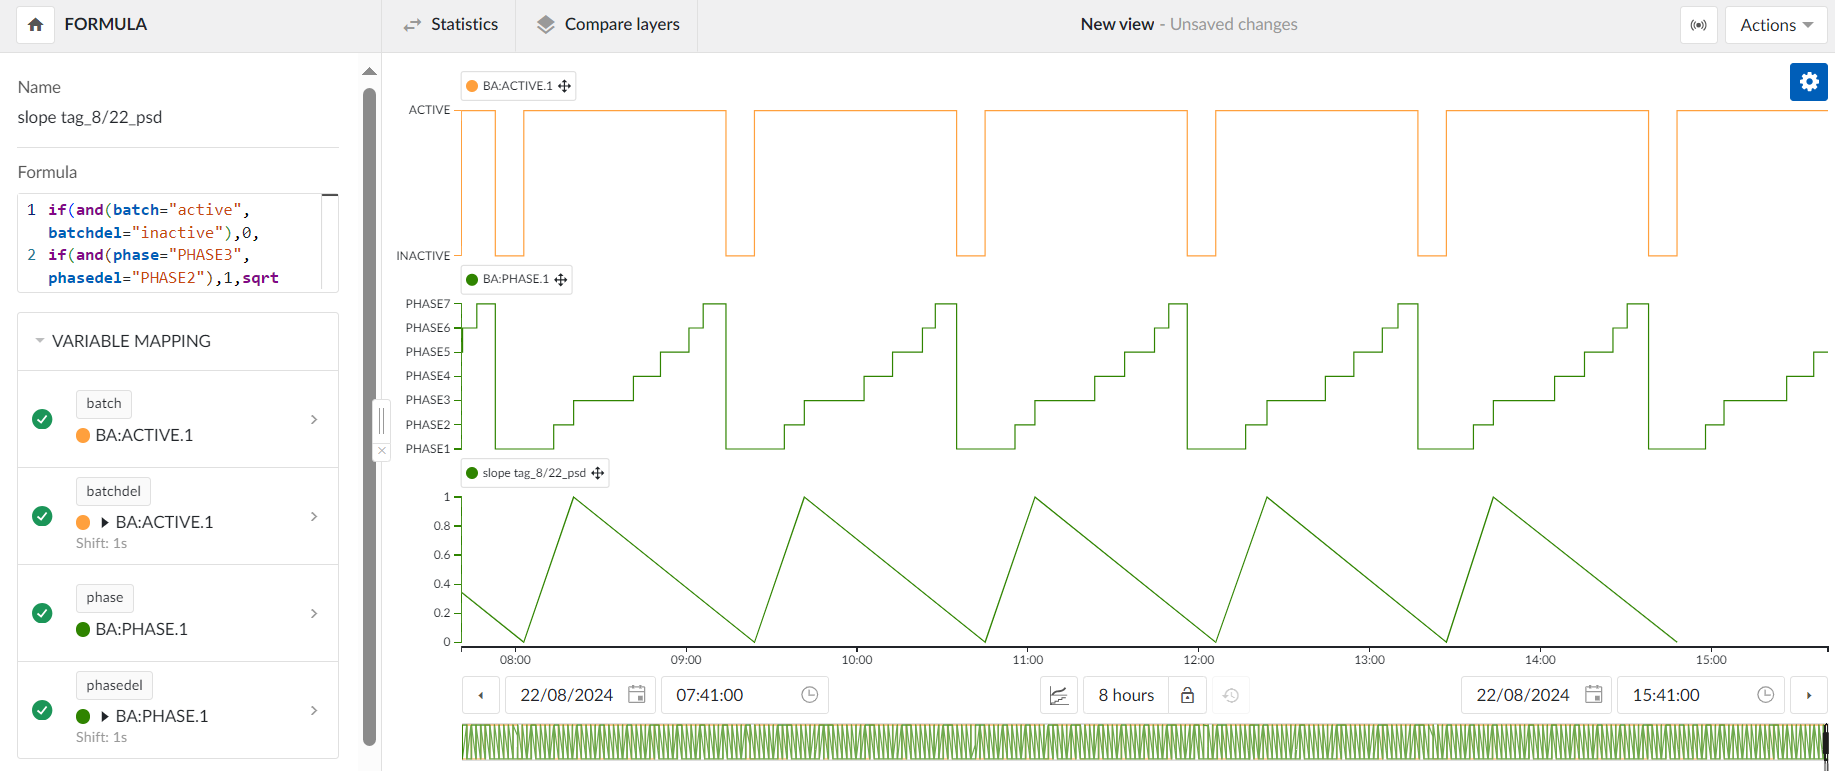
This can be done with a conditional formula and time changes. For example, an event from the moment a batch starts until the “Phase 3” starts:
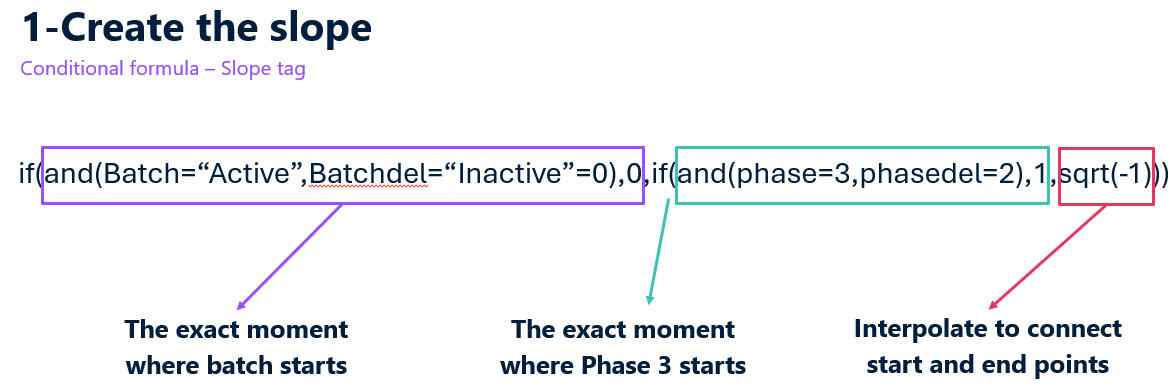
It is important that the obtained variable consists of constant slopes from 0 to 1 and from 1 to 0. We do not want it to remain constant at values of 0 or 1 for long periods, as this could affect the second step of the workaround. This is why time shifts are used, indicating only the exact moment of start and end.
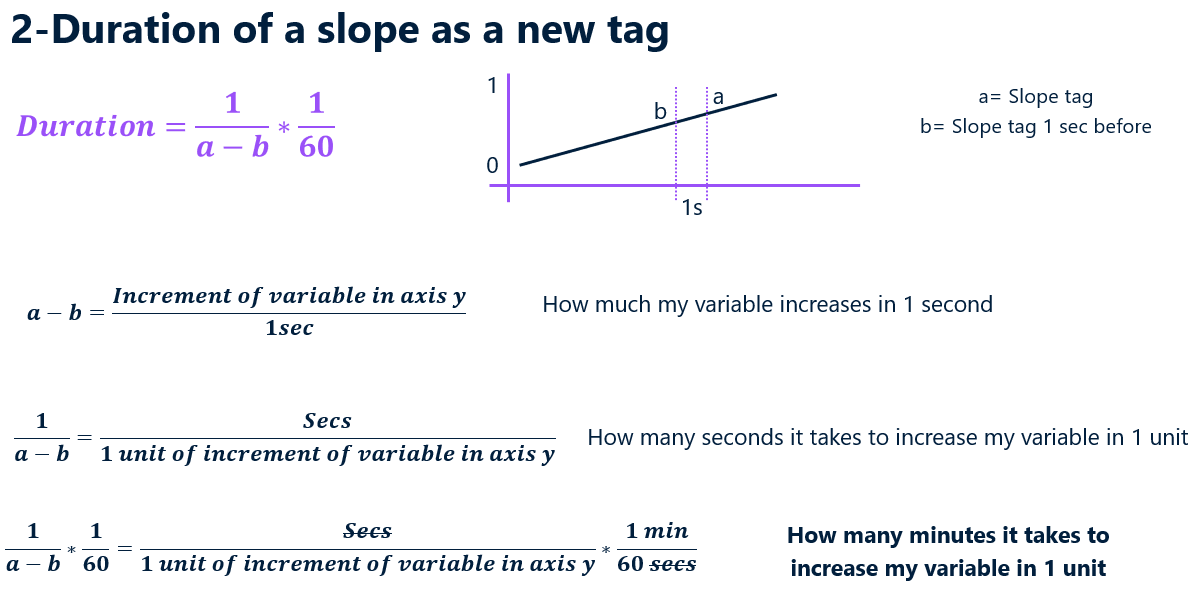
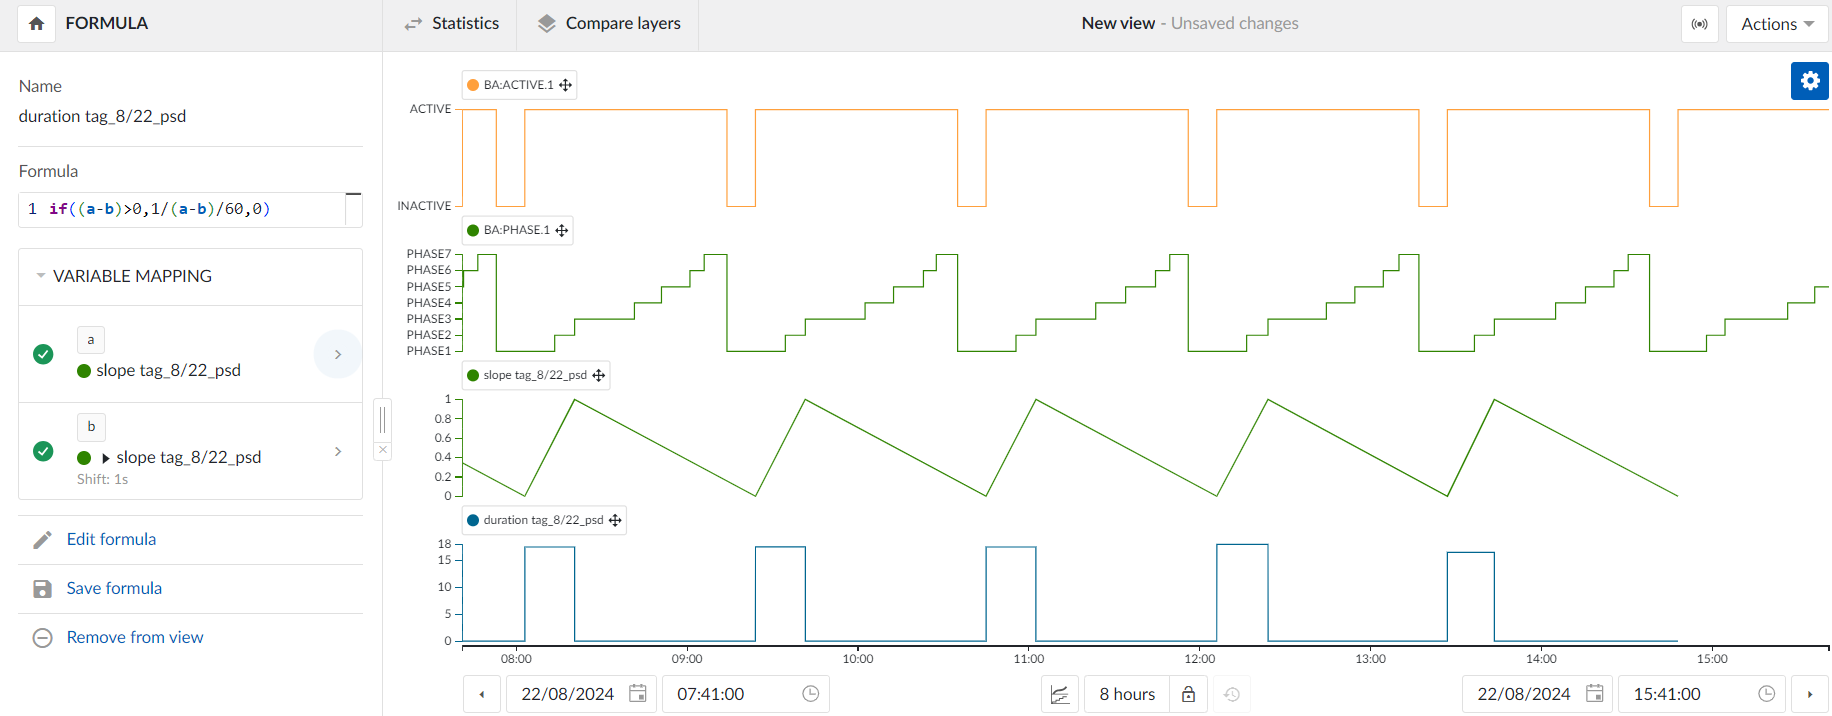
Secondly, we need to transform the slope tag into another variable that indicates the duration of each slope. This is done with the formula 'if((a-b)>0,1/(a-b)/60,,0)' following the explanation provided below (to display it in minutes)
The if statement “if(a-b)>0” is used to only show values of the duration during the events (when the slope is growing from 0 to 1), keeping the rest at 0 and, thus, creating a stepped appearance: