Design conditions often look great on paper but once a process is running in real life, the true optimal conditions can be very different. This gap makes it harder to understand the process and to make confident, data-driven decisions based on controlled variables.
To truly understand a process—and improve it—we need to analyse data under normal operating conditions.
Whether you’re working with:
- an active batch (batch process), or
- a running system (continuous process),
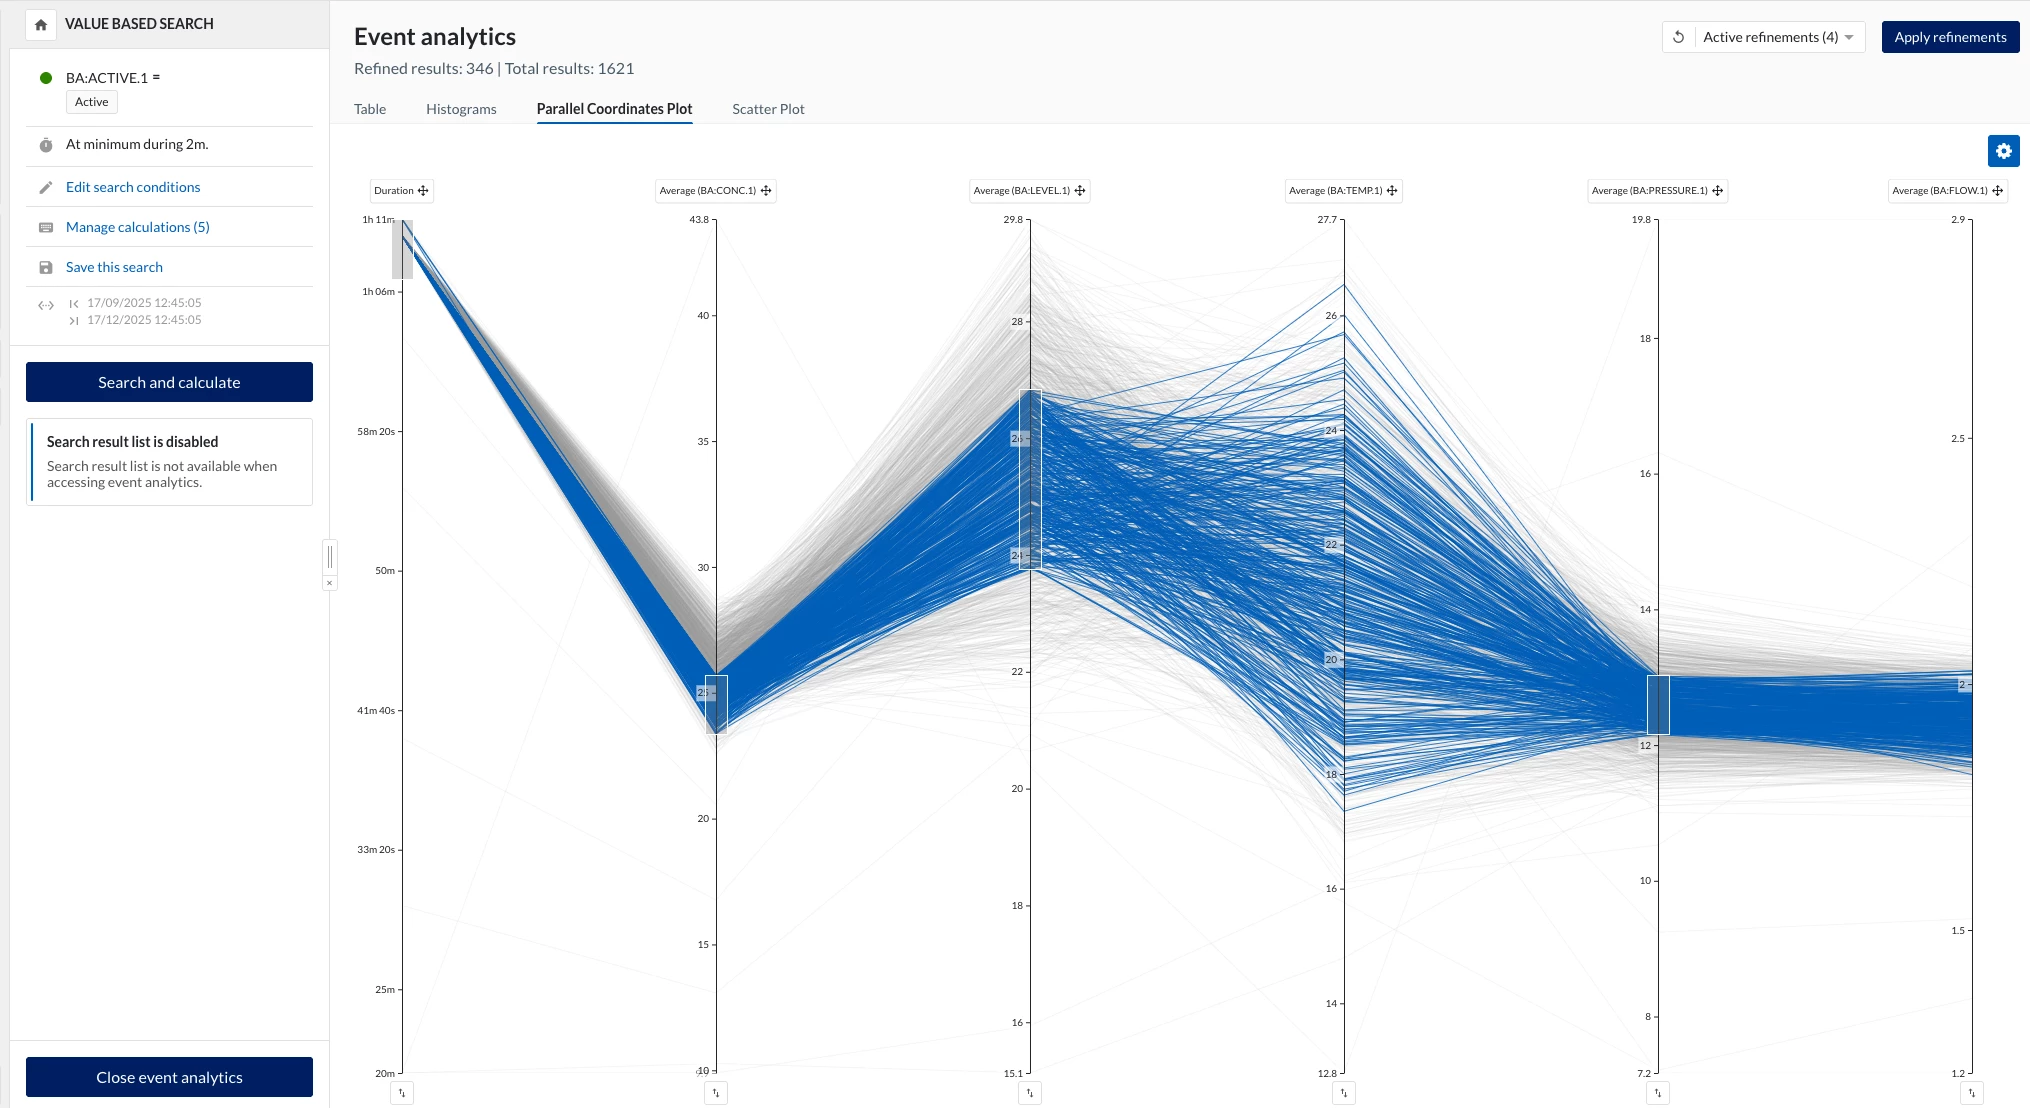
you can start by searching the relevant operating periods and then adding calculations on top of that search. By selecting the operator average for each tag, we establish a strong baseline: the most common, real-world values of our variables.
💡 This is where Event Analytics shines.
With event analytics, you can:
- Visualise distributions of operating conditions across variables in parallel (parallel coordinate plots)
- Quickly identify patterns and typical behaviour
- Apply refinements to remove outliers or exclude conditions that don’t meet your requirements
The result?
A refined set of most common operating conditions giving you clearer insights and allowing you to apply your domain expertise where it matters most.
🧠 Summary
- Search relevant operating periods
- Add calculations on top
- Use event analytics - parallel coordinates
- Apply refinements
🚀 Value
- Deeper process insights
- Faster data-to-action
- More confident, data-driven decisions