When creating context items via search results, it is often useful to map calculations on your search results to a context field for that context item. Once the calculation is mapped to the context item, the calculation can be displayed as a table column in your context view. This feature can come in handy when you want to display metrics or to report KPIs. We will explore a batch example where we leverage this feature.
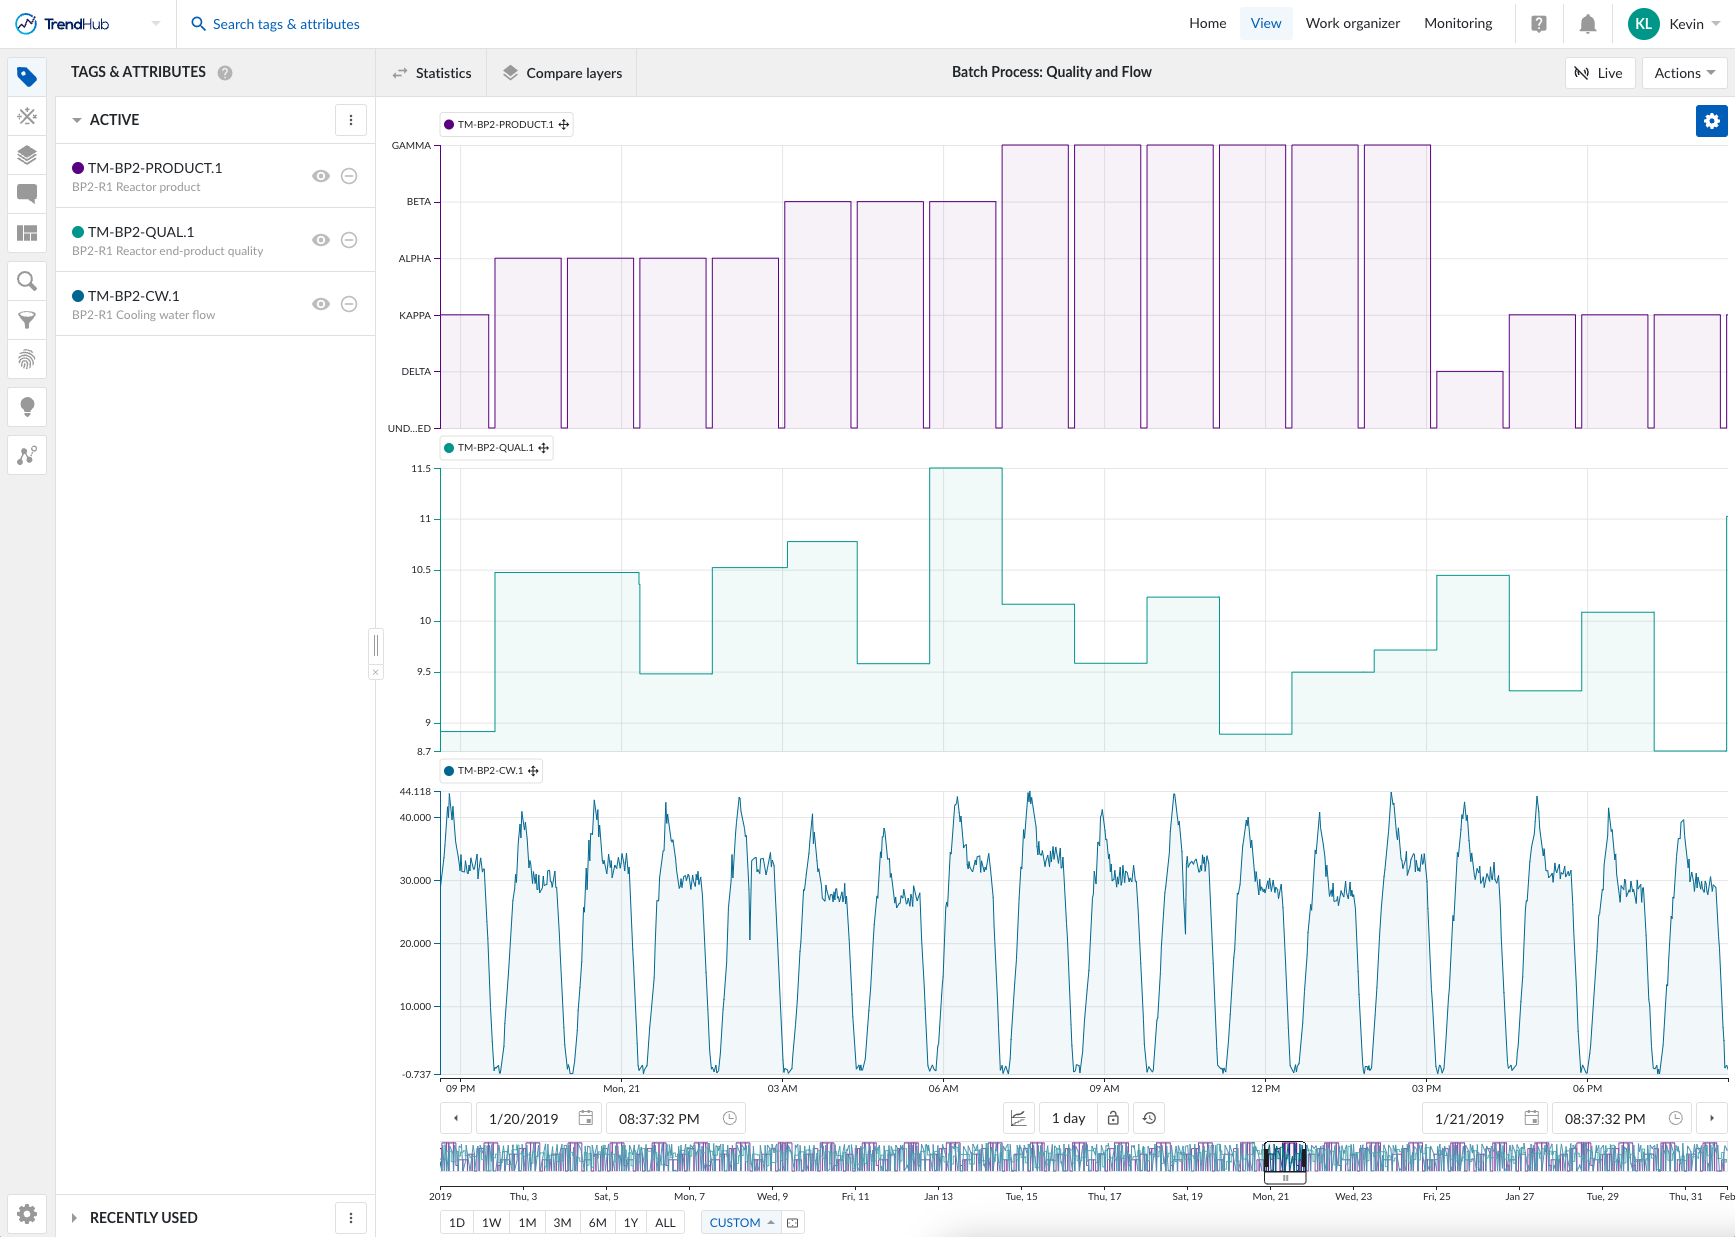
Consider a batch process where a variety of product grades are manufactured. For a specific product grade, for example product ALPHA, we would like to know the total feed throughput as well as the max quality during the batch.
For this demonstration, we will be using the TM-BP2-PRODUCT.1, TM-BP2-QUAL.1, and TM-BP2-CW.1 tags.
1. Create context items via value-based search
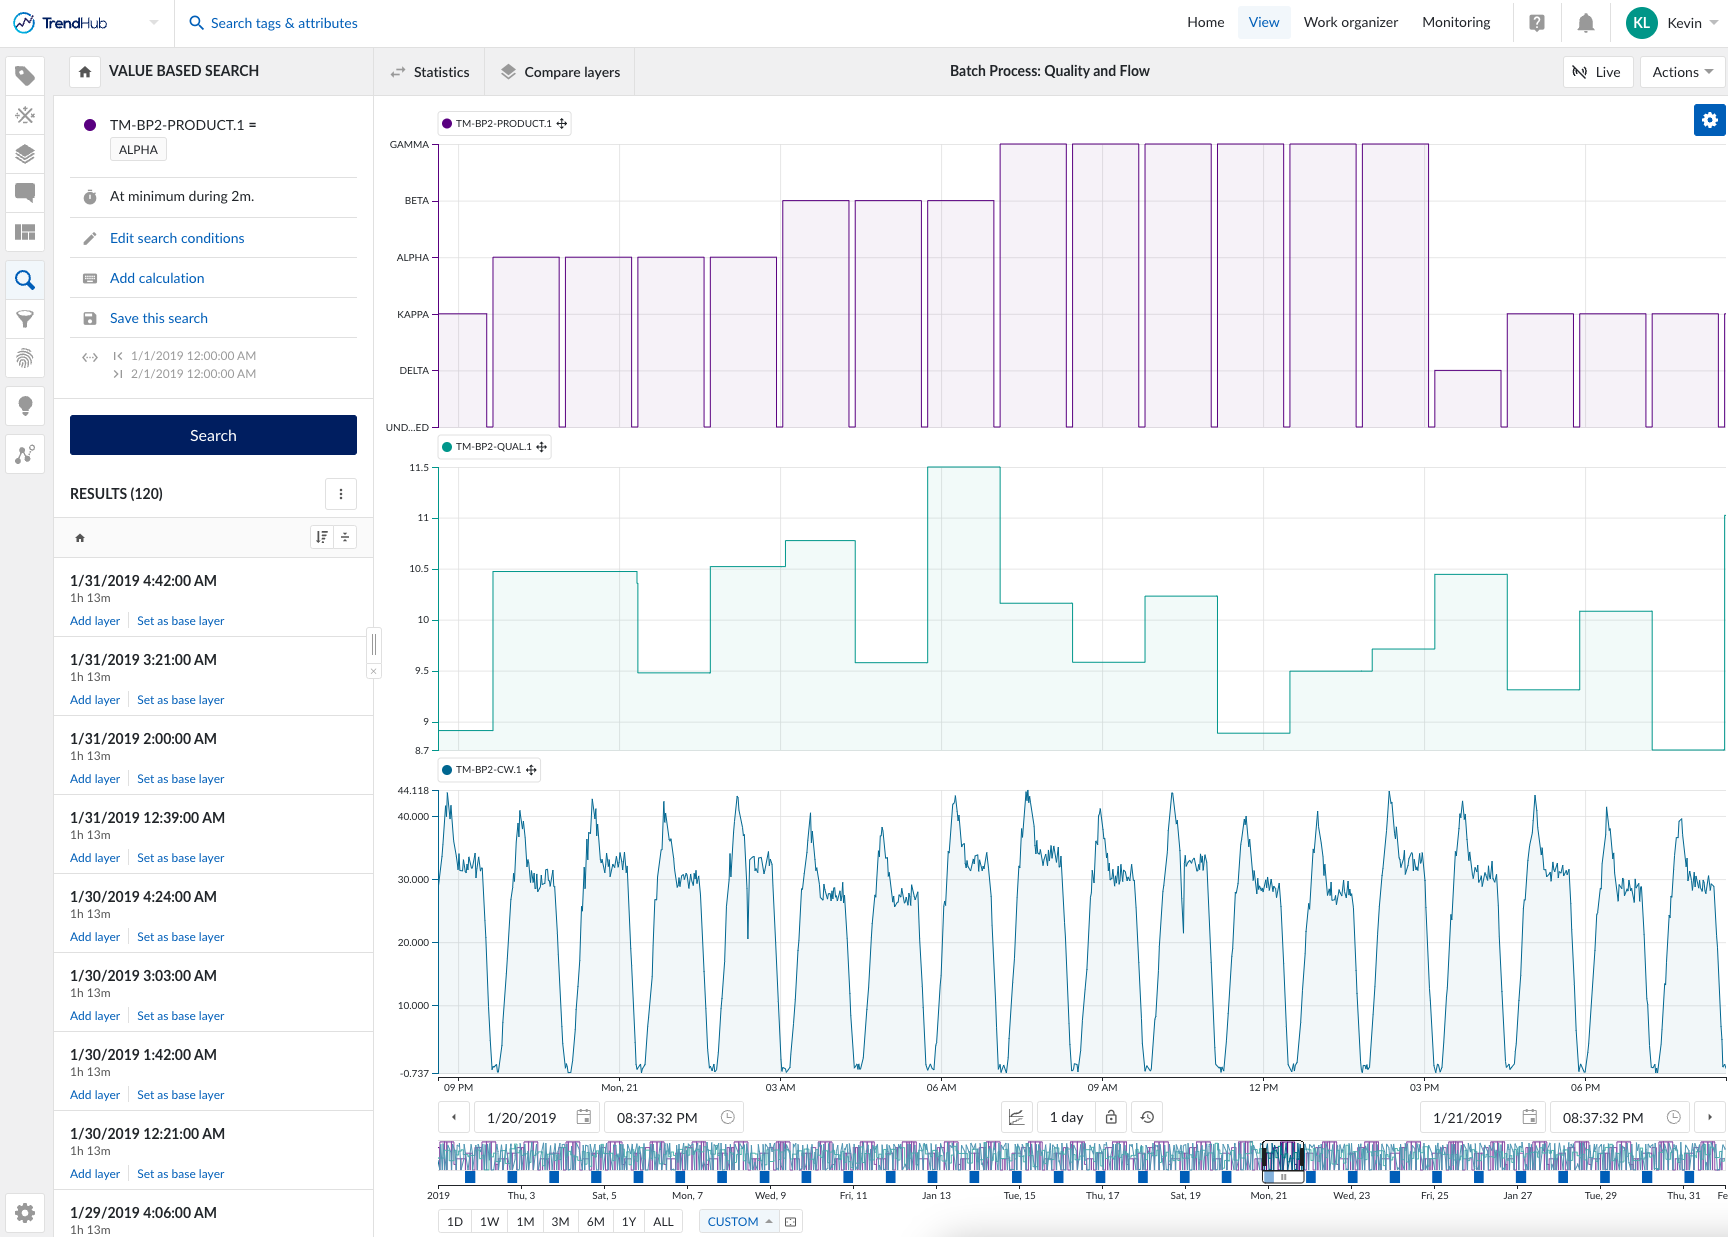
To begin, start a new value-based search to identify periods when product ALPHA is produced.
2. Add calculations on search results
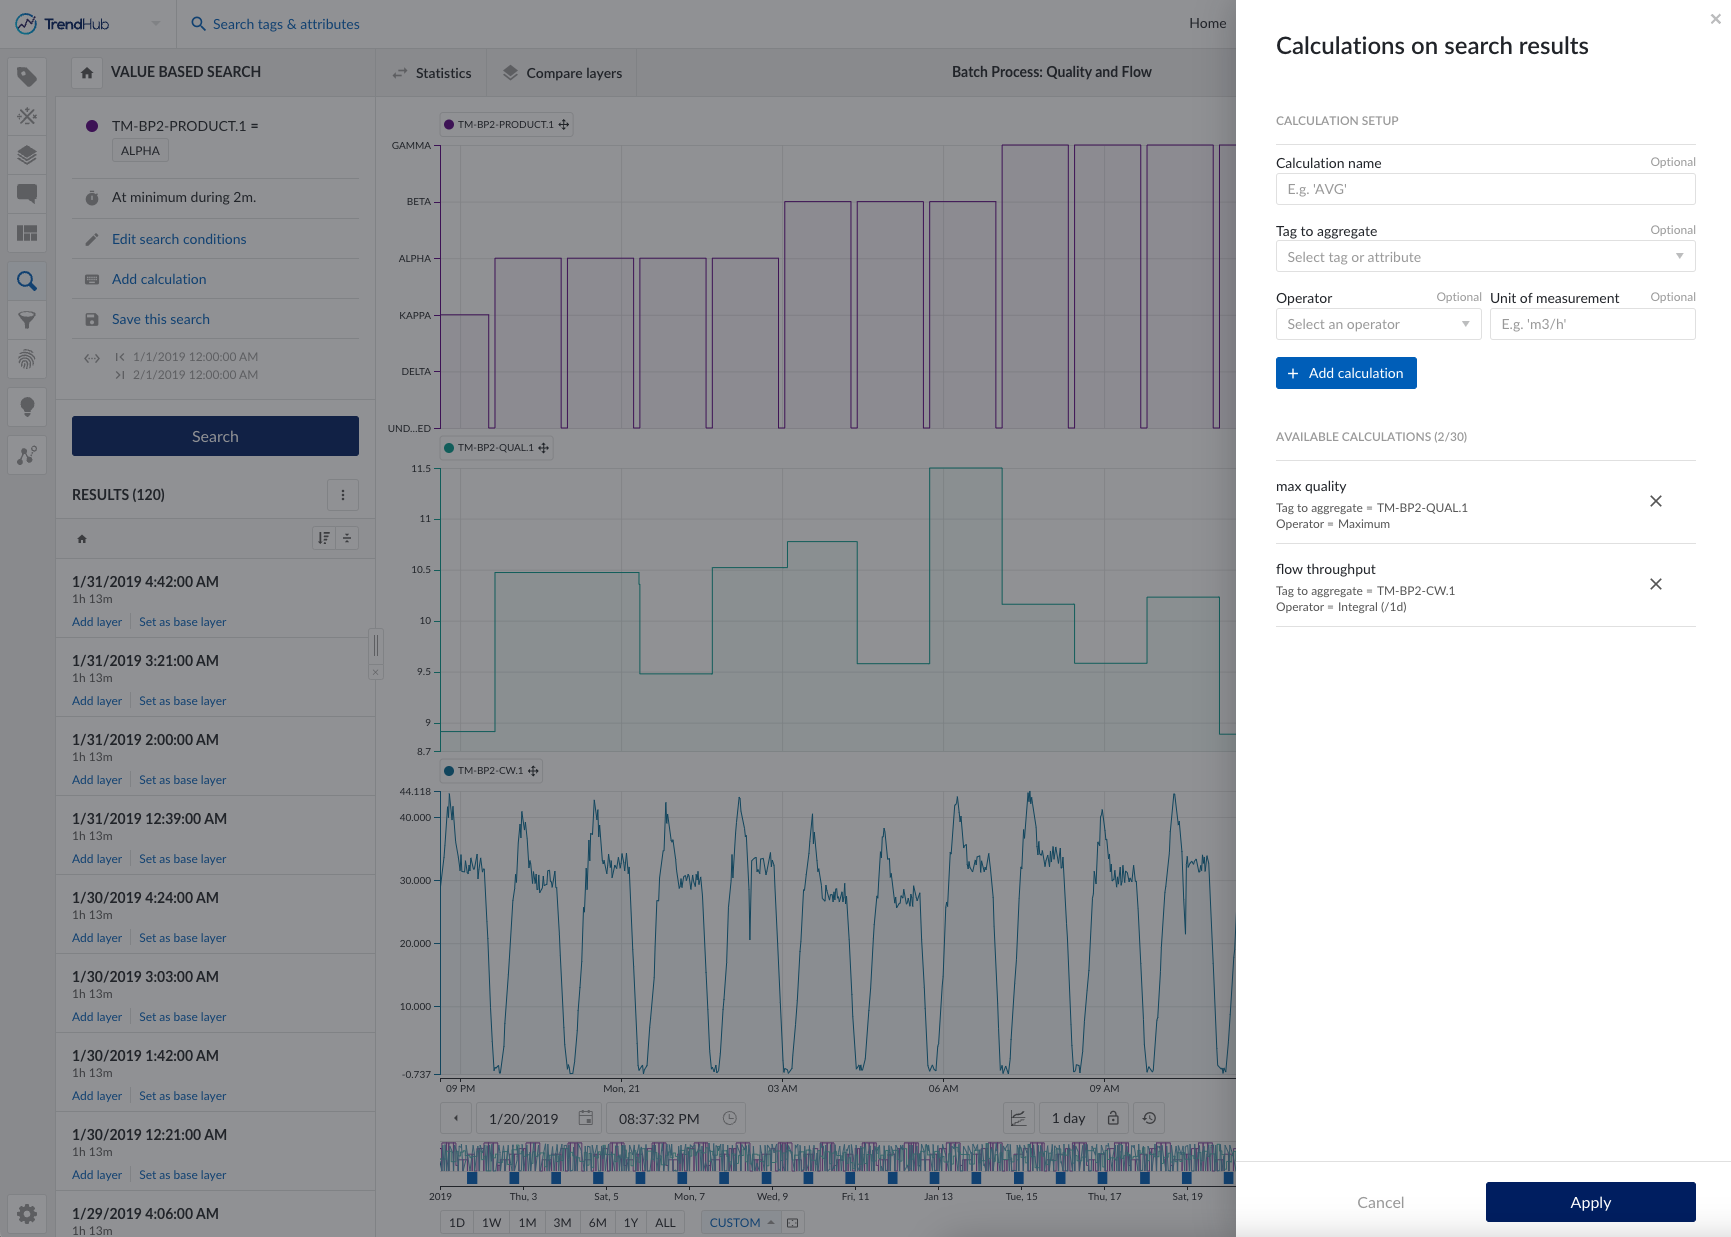
Add the two calculations - max quality and integral flow (integral of the flowrate will yield flow throughput).
3. Create the custom context fields and context item type
Head to ContextHub and select the settings icon located at the bottom left.
Note: If you do not see the settings icon, it is because you do not have the correct permissions. Please contact your TrendMiner admin to resolve this issue.
Create two fields - one for max quality and one for flow throughput.
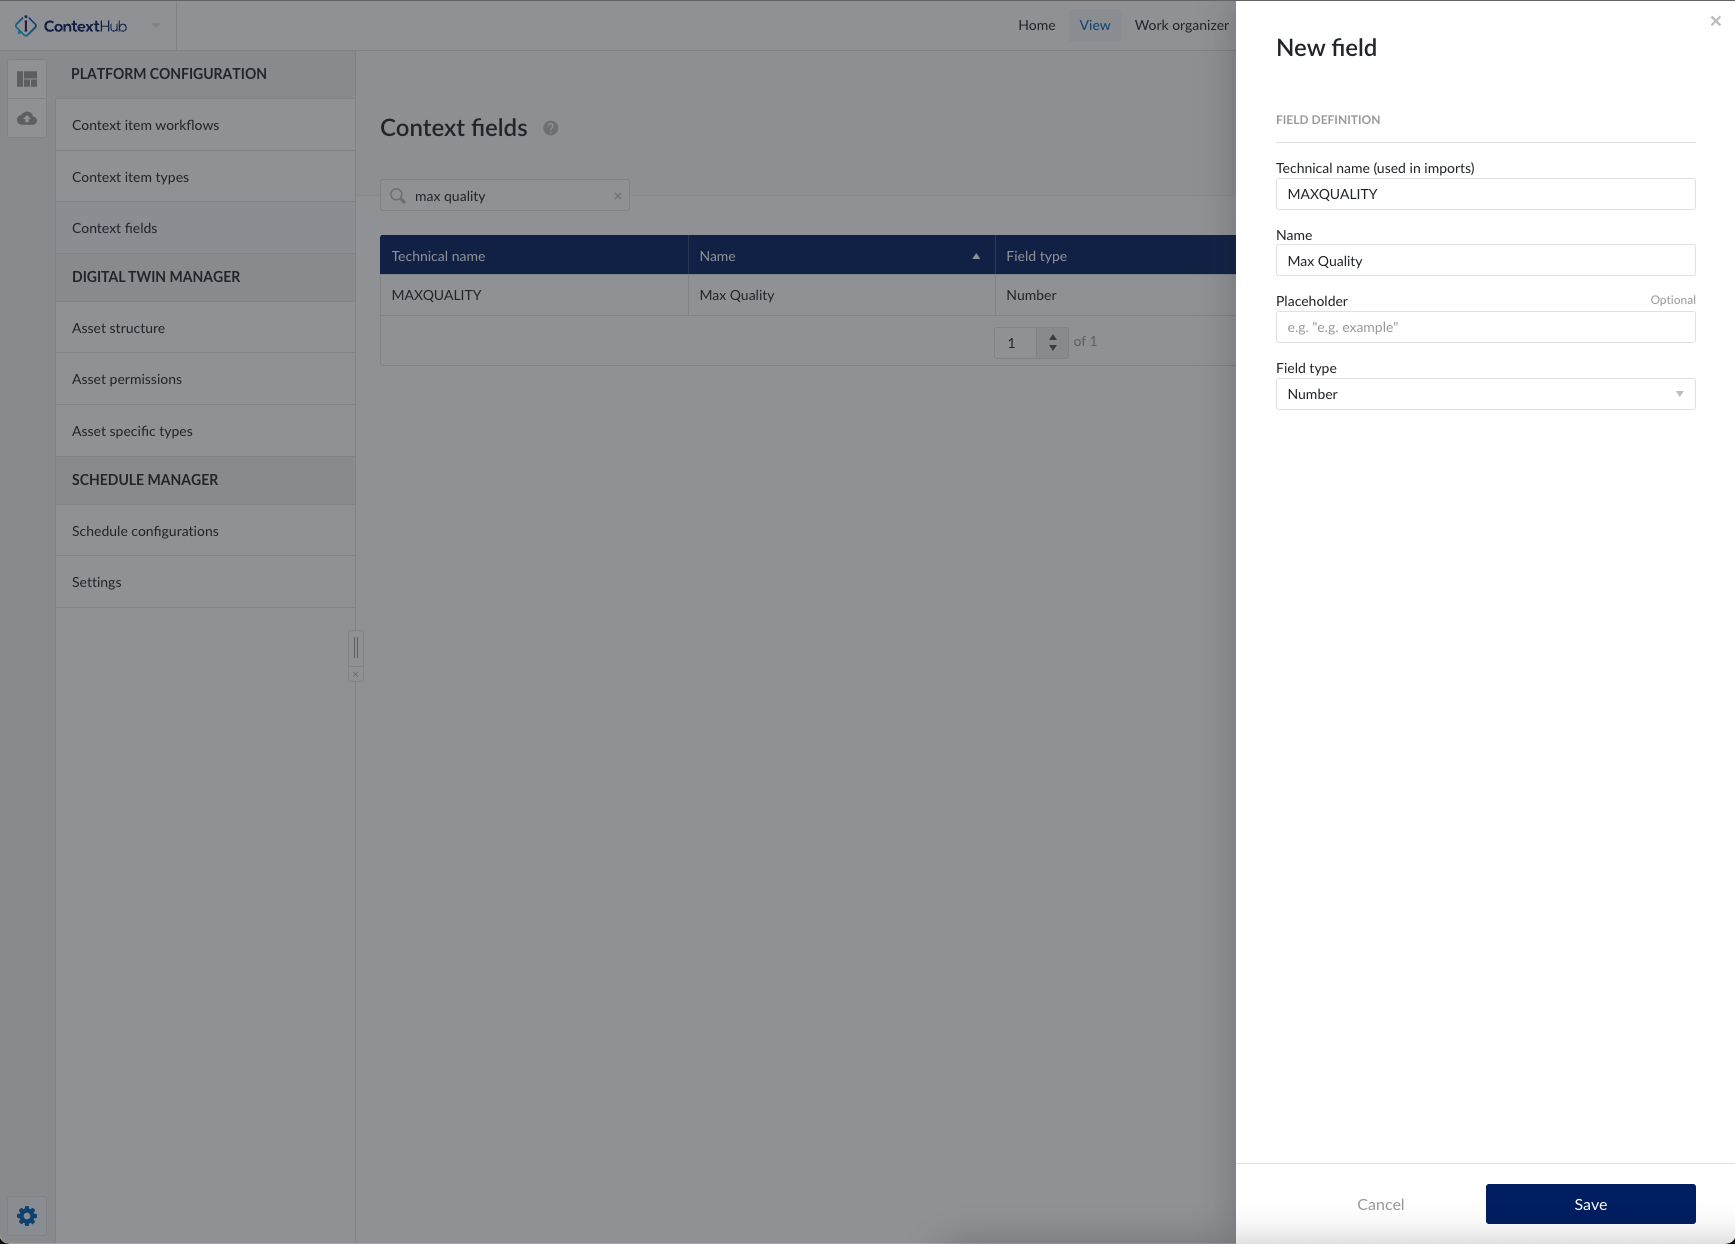
Once the two fields have been created, we can create the custom context item type. In the image below, we name this custom context item type “Alpha Batch” and select the two context fields we just created.
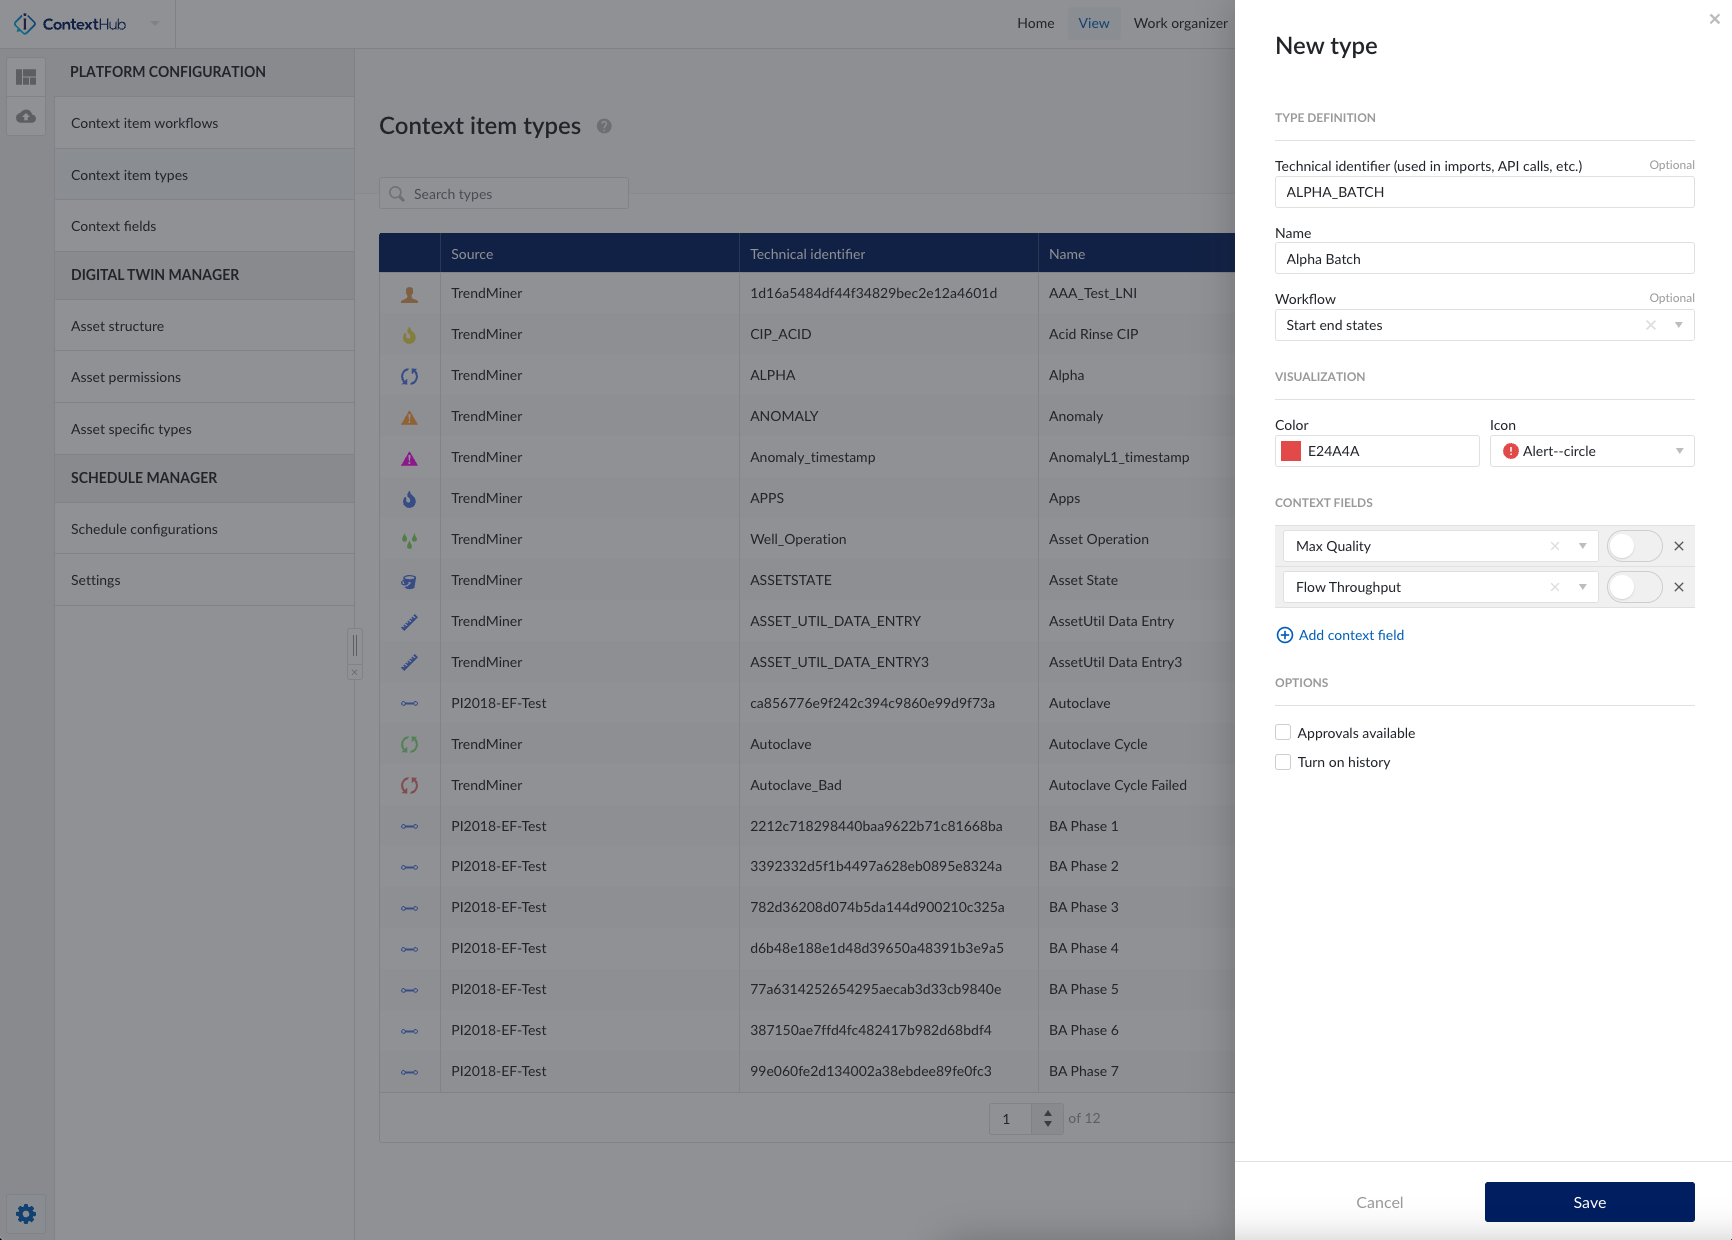
4. Create context items and map calculations
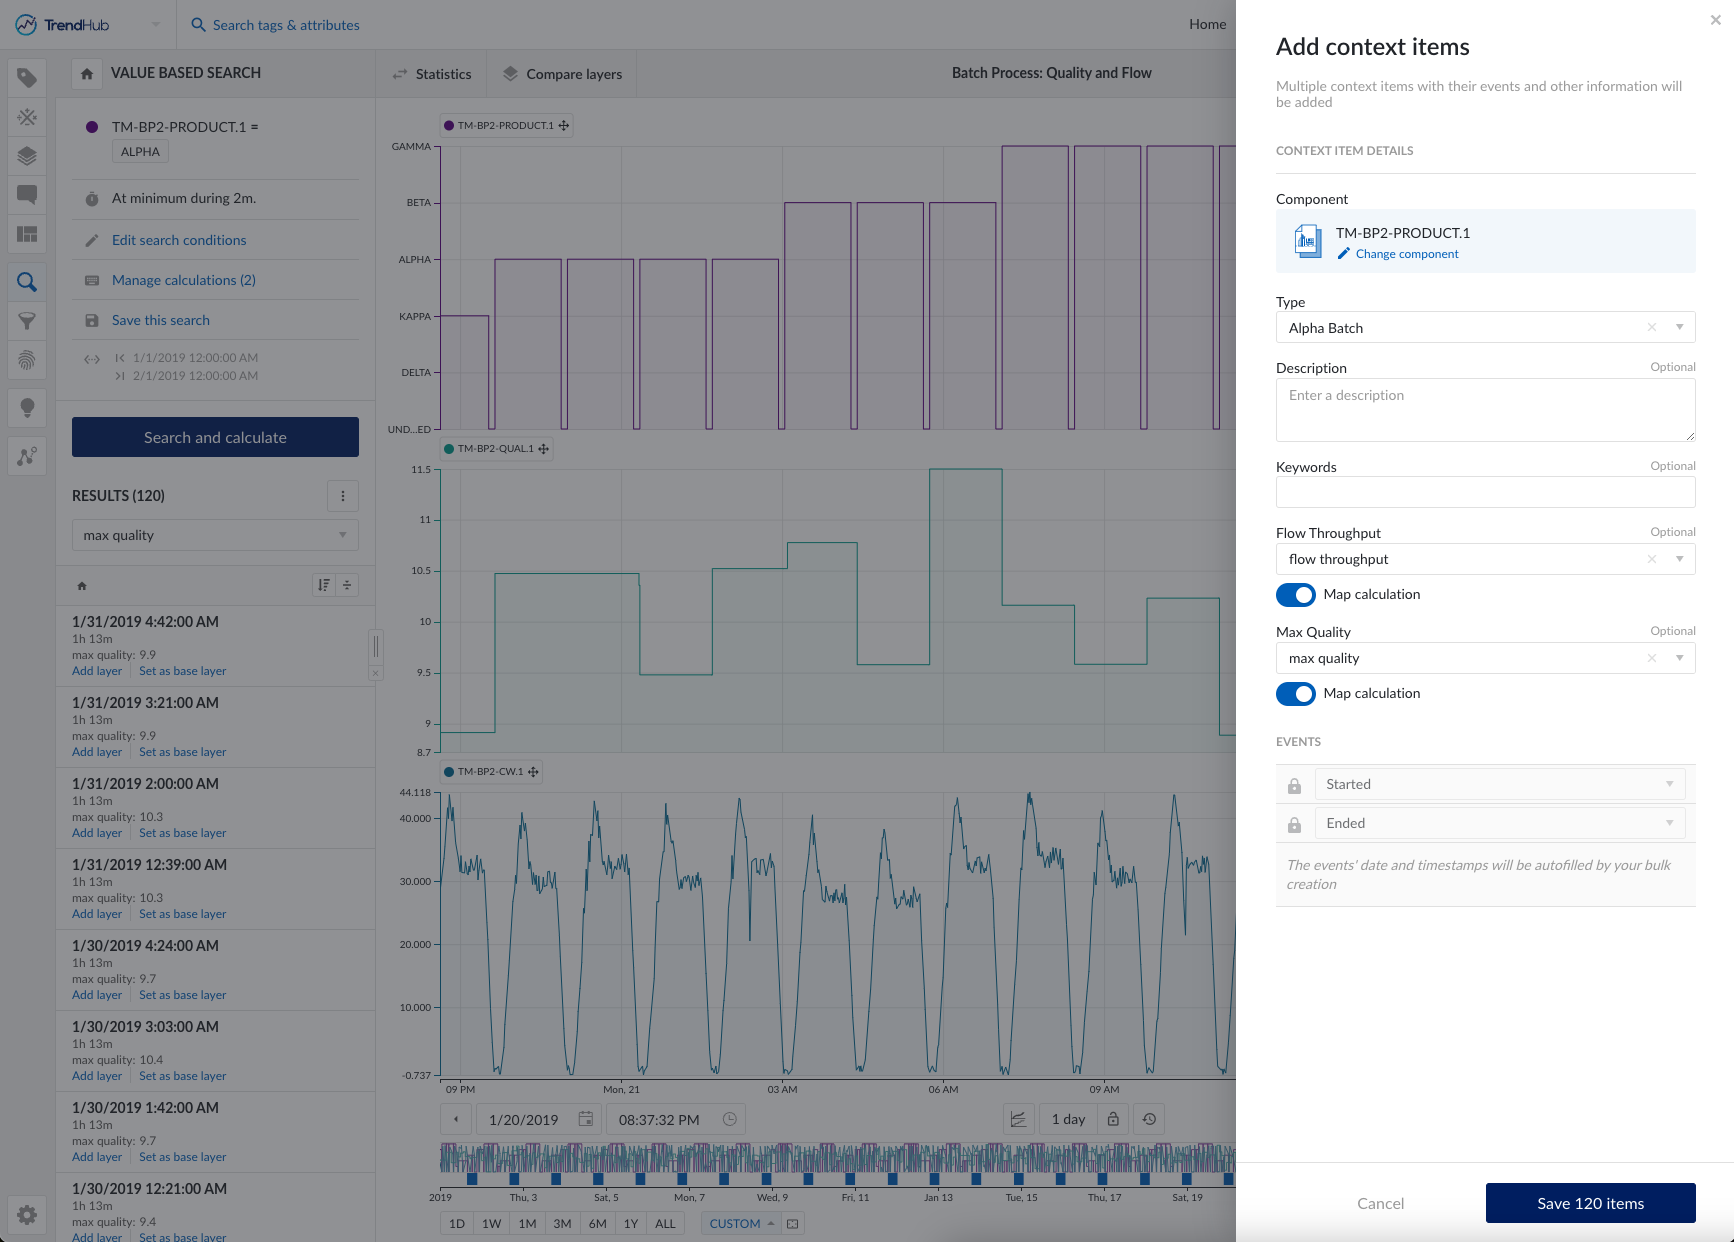
With the custom context item type created, we can now head back to our value-based search. We want to add our search results as context items. To do so, select the more options icon to the right of “Results”. Here we can find a command to add context item. Select the correct component/tag, the “Alpha Batch” type for Type, and toggle on the map calculation for both context fields. Once those have been toggled on, we can select our calculations to map to the respective fields.
5. View context items in ContextHub view
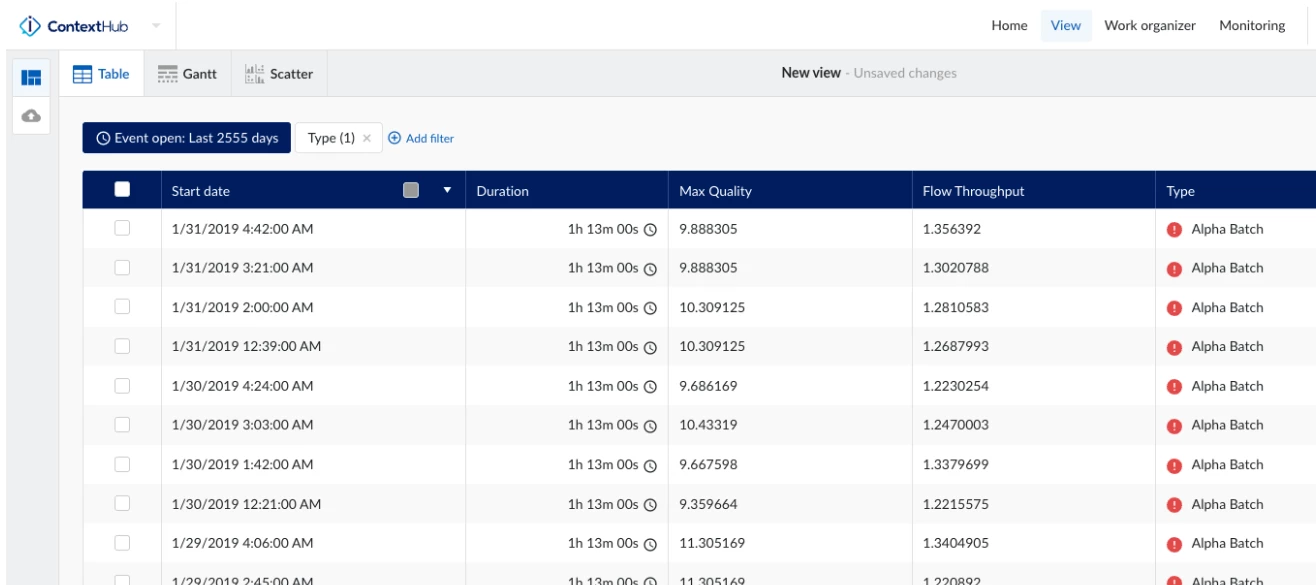
After the context items are created, we can view them just like any other context item in ContextHub. Head into ContextHub and select the correct time window to view as well as apply the correct filters. In the screenshot below, the type filter is used to filter by the “Alpha Batch” type. To display the custom context fields in the table, be sure to enable the columns by clicking on the blue settings icon located above the table on the right side.
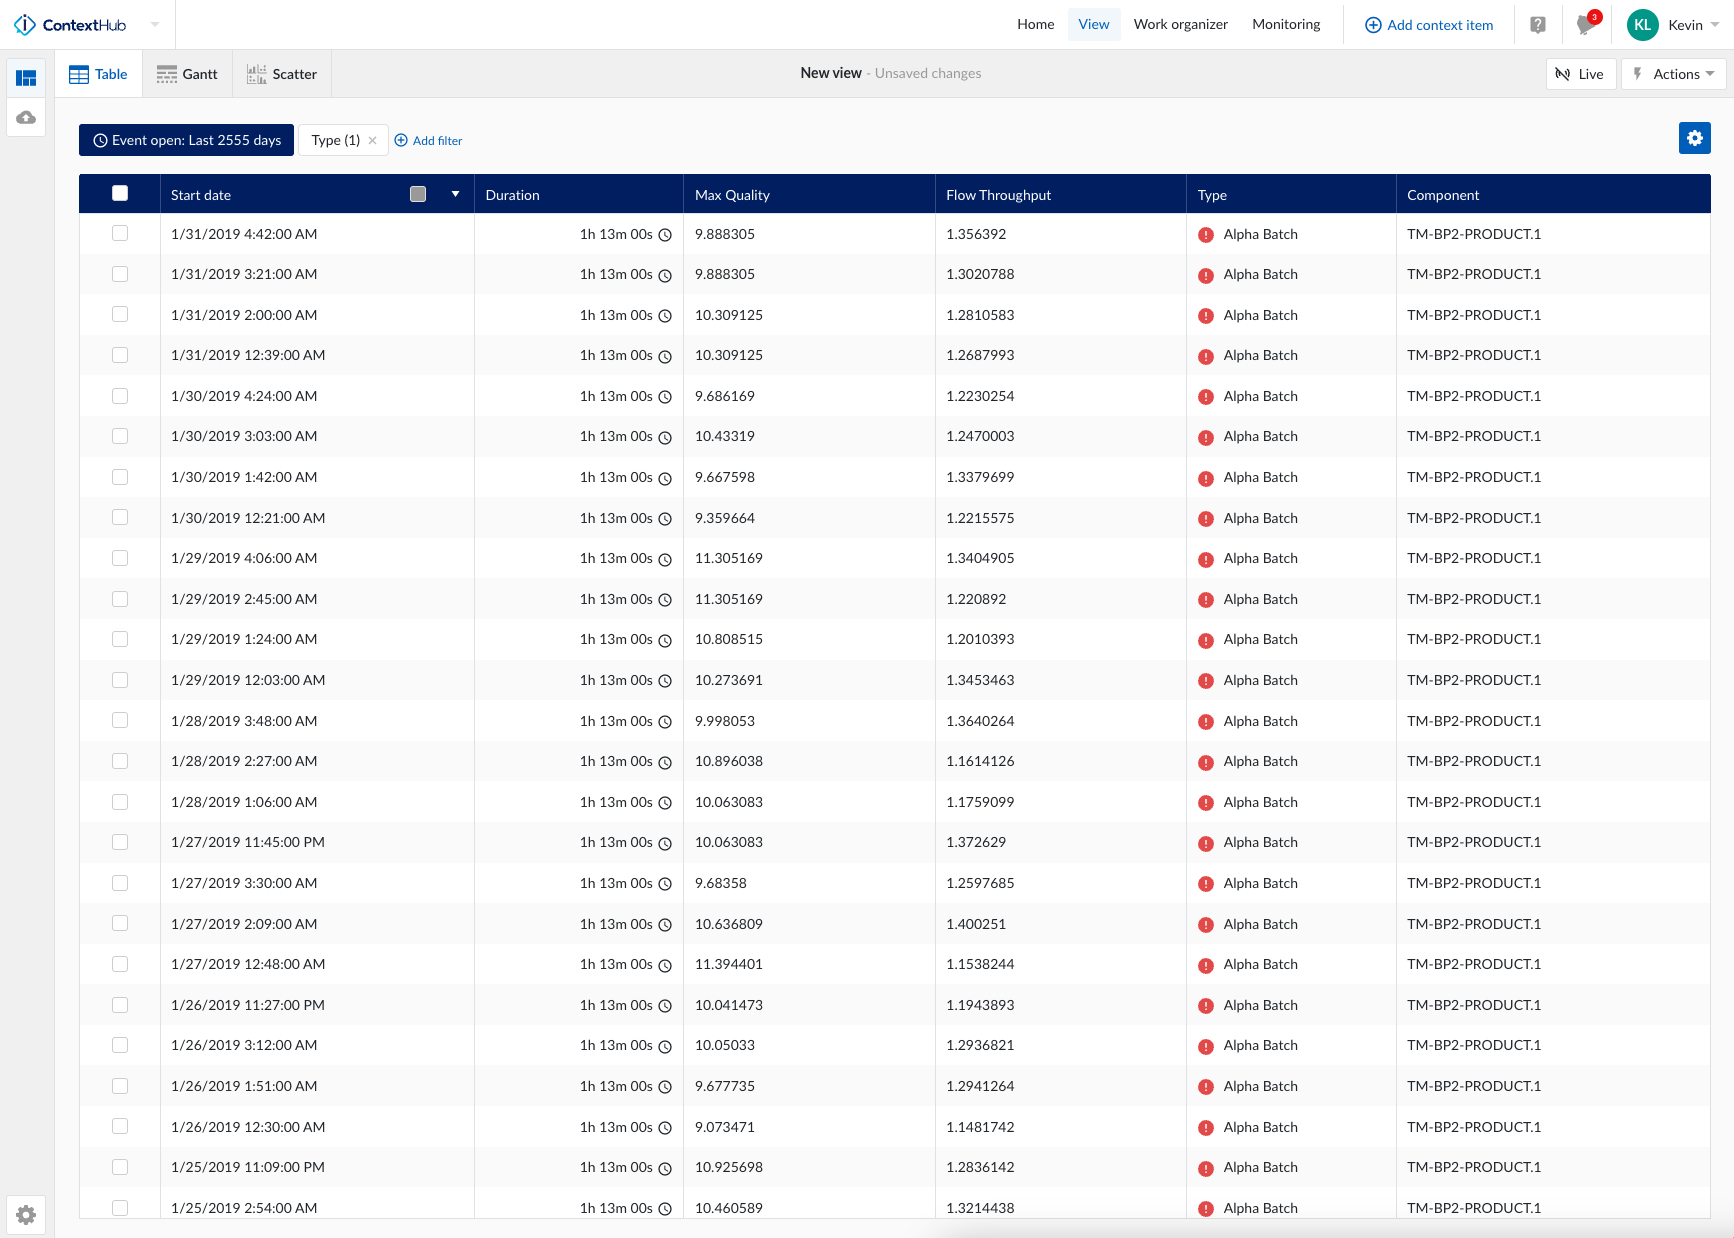
We now have a context view that displays every ALPHA batch. Each line item in the table also includes the max quality and flow throughput for each ALPHA batch. You can add additional context fields if there are additional metrics and/or KPIs that you would like to display on the table.

