

Background:
TrendMiner's "Event Analytics" is typically used for batch processes, but it can also optimize continuous processes. By breaking down the data into manageable hourly intervals, this approach provides detailed monitoring and identifies optimal conditions for enhanced efficiency and productivity.
Steps:
-
Preparation:
- Add the most important process parameters.
- Include the pre-installed
TM_day_tag.
-
Data Splitting:
- Use the value-based search feature to segment data.
- Set the condition to
TM_day_constant. - Ensure a minimum duration of 59 minutes.
-
Adding Calculations:
- Add calculations on the search result.
- Example calculations: Average Temperature, Integral Cooling Water, Minimum Pressure.
-
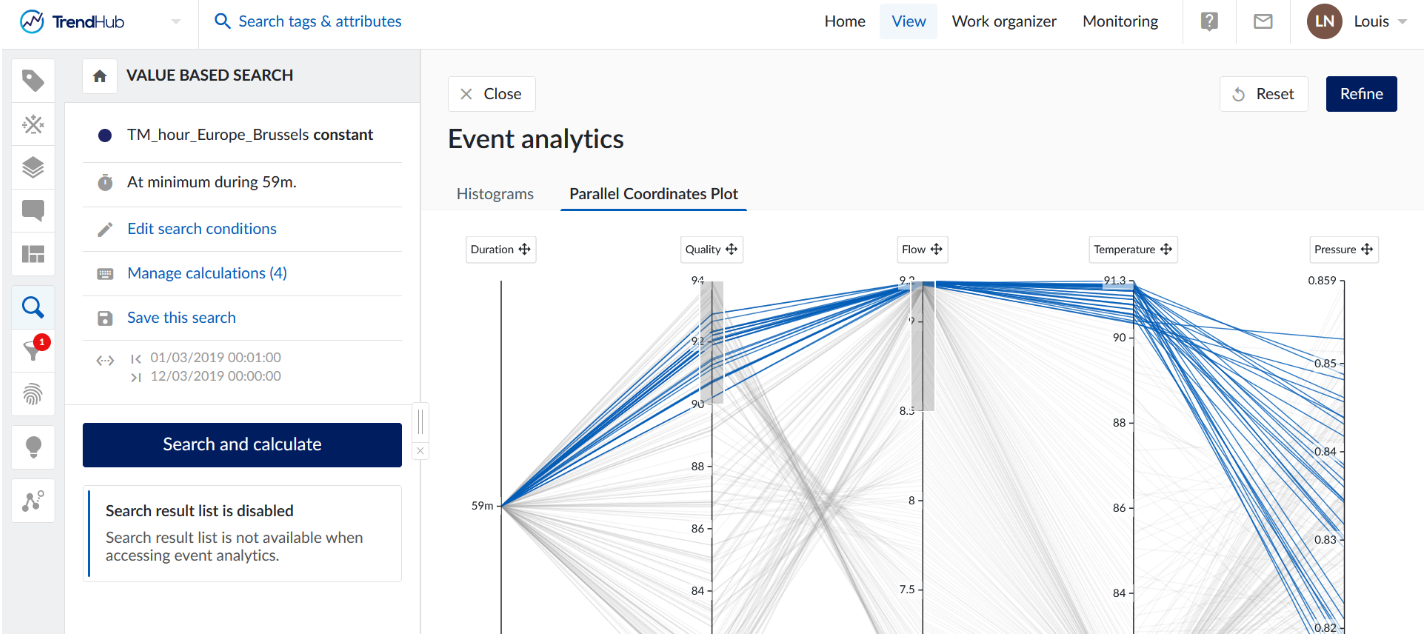
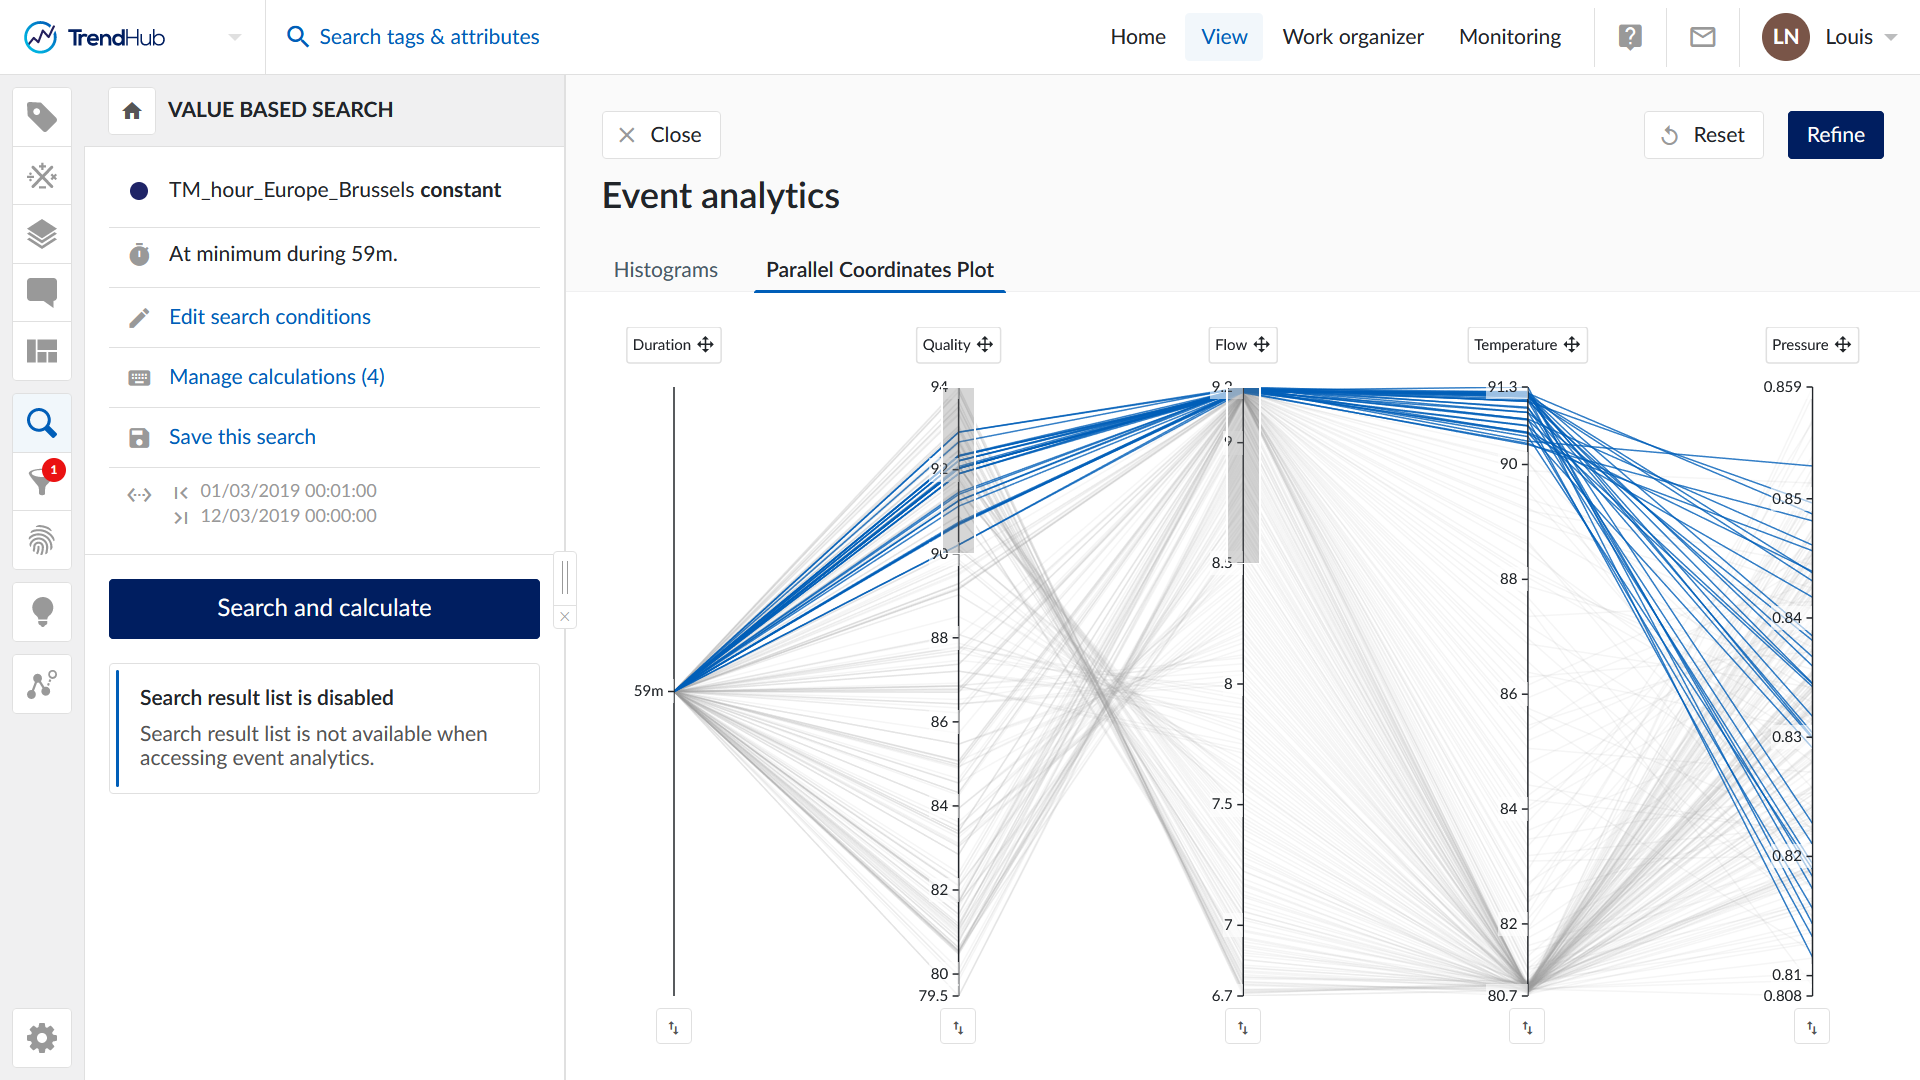
Event Analytics:
- Use the 1-hour aggregated data within Event Analytics.
- Analyze the data using histograms or parallel coordinate plots to visualize and identify optimal process conditions.
Benefits:
This method enables precise adjustments and improvements in continuous processes by offering clear insights into hourly performance. It facilitates data-driven decision-making and provides valuable insights, ensuring consistent maintenance of optimal conditions.