

Introduction
Daily production is a key performance indicator (KPI) in continuous processes, helping process experts track efficiency and performance. However, in many cases, daily production is not readily available as a default variable in data historians. A recent question in the TrendMiner Community addressed this challenge: How to calculate a daily average of a signal with a single result per day?. This article explains four different approaches to calculating daily production in TrendMiner, depending on the user’s needs.
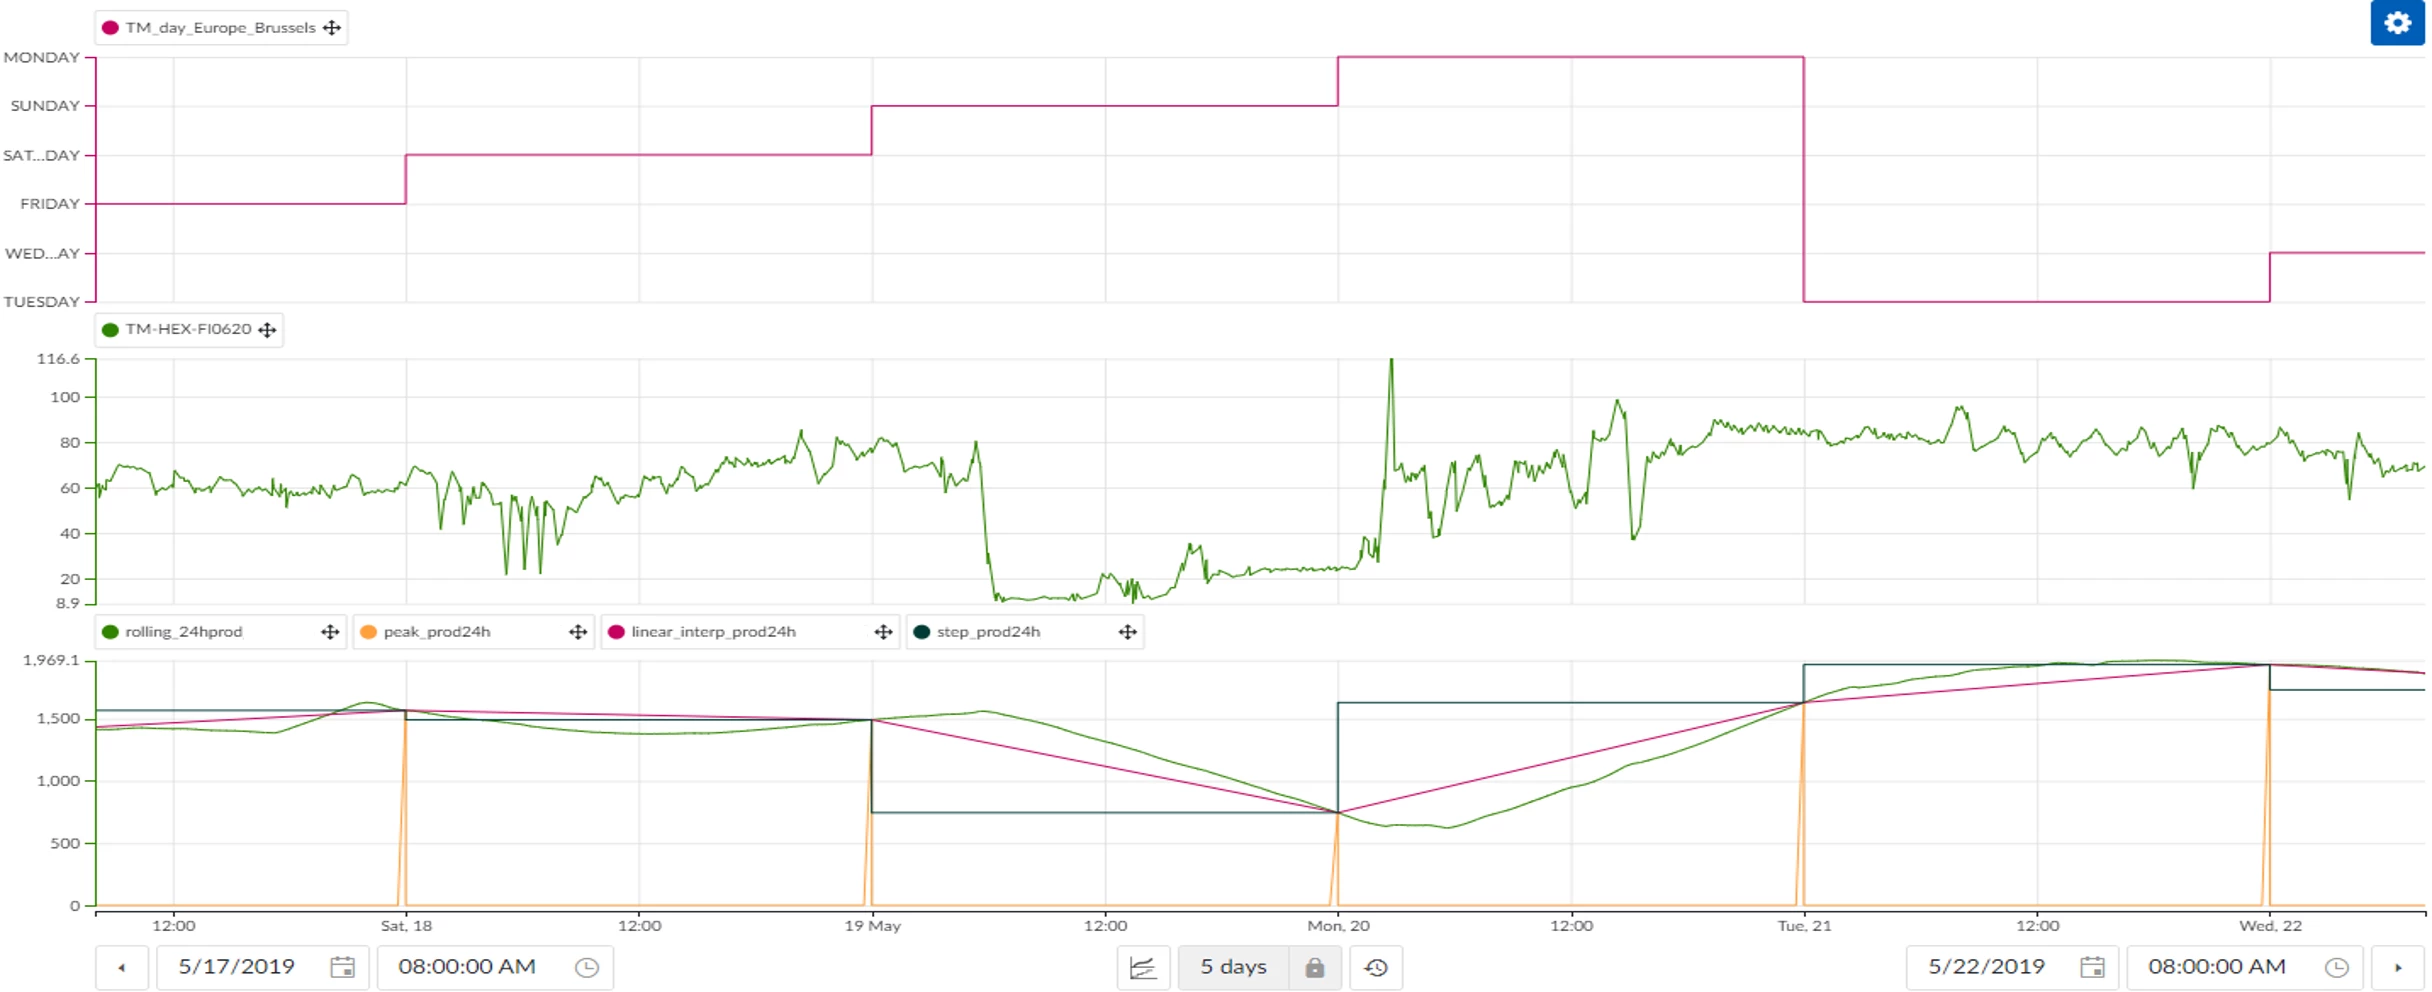
1️⃣ Continuous Rolling Last 24 Hours Production
📌 Background
This method ensures that at any given time, the production of the last 24 hours is always available as a continuously updating value. This is particularly useful for real-time monitoring and trend analysis.
🛠 Steps
-
Load the relevant tag related to production.
-
Set the context and focus chart to visualize the required time range.
-
Create a new aggregation:
-
Select the production signal.
-
Use a backward aggregation over 24 hours.
-
Apply the integral operator to calculate the total production.
-
Define the appropriate unit and save the new variable.
-
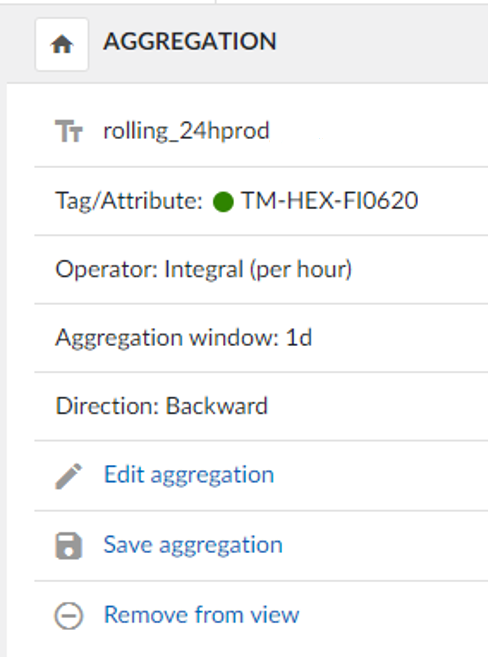
This approach provides a continuously updated rolling production metric, ideal for evaluating short-term performance.
2️⃣ Daily Production as Peaks
📌 Background
This method calculates daily production by capturing a single peak value at the beginning of each day. It allows for a simplified overview of production performance with distinct daily markers.
🛠 Steps
-
Start from the continuous rolling production calculation.
-
Create a new formula to display only the daily peak:
-
Identify when a new day begins.
-
Assign the daily production value at that moment.
-
Keep all other values at zero.
-
-
Save the new variable to enable easy tracking of production peaks.
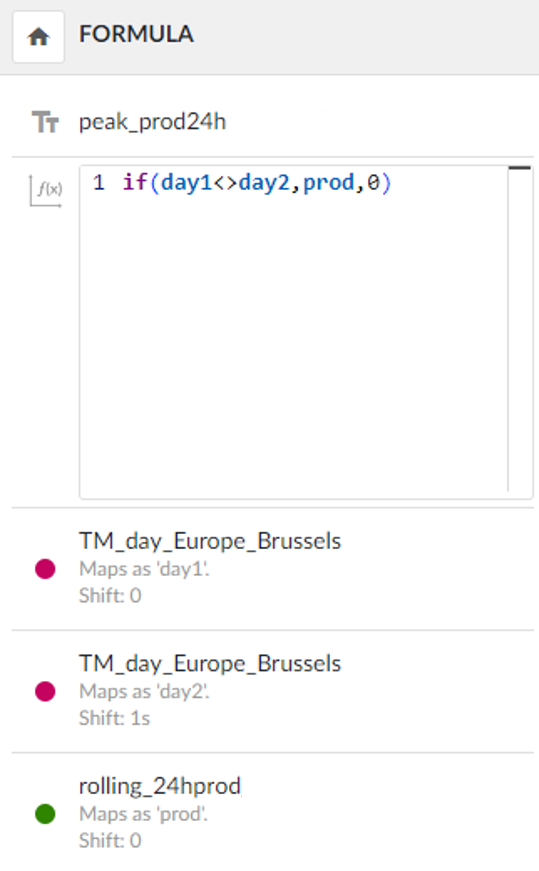
This method is particularly useful for reporting and detecting daily variations in production output.
3️⃣ Linear Interpolated Daily Production
📌 Background
This method calculates a single production value per day while interpolating between data points, offering a smooth daily trend for process analysis.
🛠 Steps
-
Start from the previous peak-based production calculation.
-
Modify the formula to interpolate between data points:
-
Use a condition to determine when a new day starts.
-
Retain the production value for that day.
-
Apply interpolation for a smooth trend between data points using sqrt(-1). This mathematical trick forces TrendMiner to interpolate between the recorded data points, ensuring a continuous trend.
-
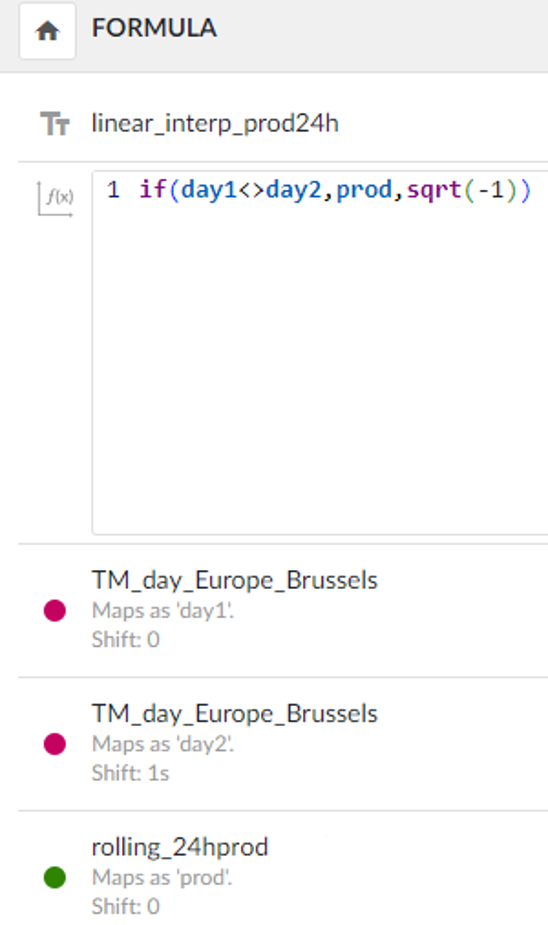
By interpolating between values, this method provides a clearer visualization of production trends over time.
4️⃣ Stepped Daily Production
📌 Background
This approach provides a constant daily production value for each day, ensuring a stepwise representation of daily production without interpolation.
🛠 Steps
-
Apply an aggregation:
-
Use an integral calculation over 24 hours.
-
Set the aggregation direction to forward.
-
Save the new variable to track daily production with stepwise consistency.
-
-
Define a formula that assigns a constant value for each day:
-
If the current day differs from the previous day, assign the aggregated daily production value.
-
If the current day is the same as the previous day, maintain the existing value.
-
If neither condition is met, apply sqrt(-1) as a trick to interpolate correctly between steps.
-
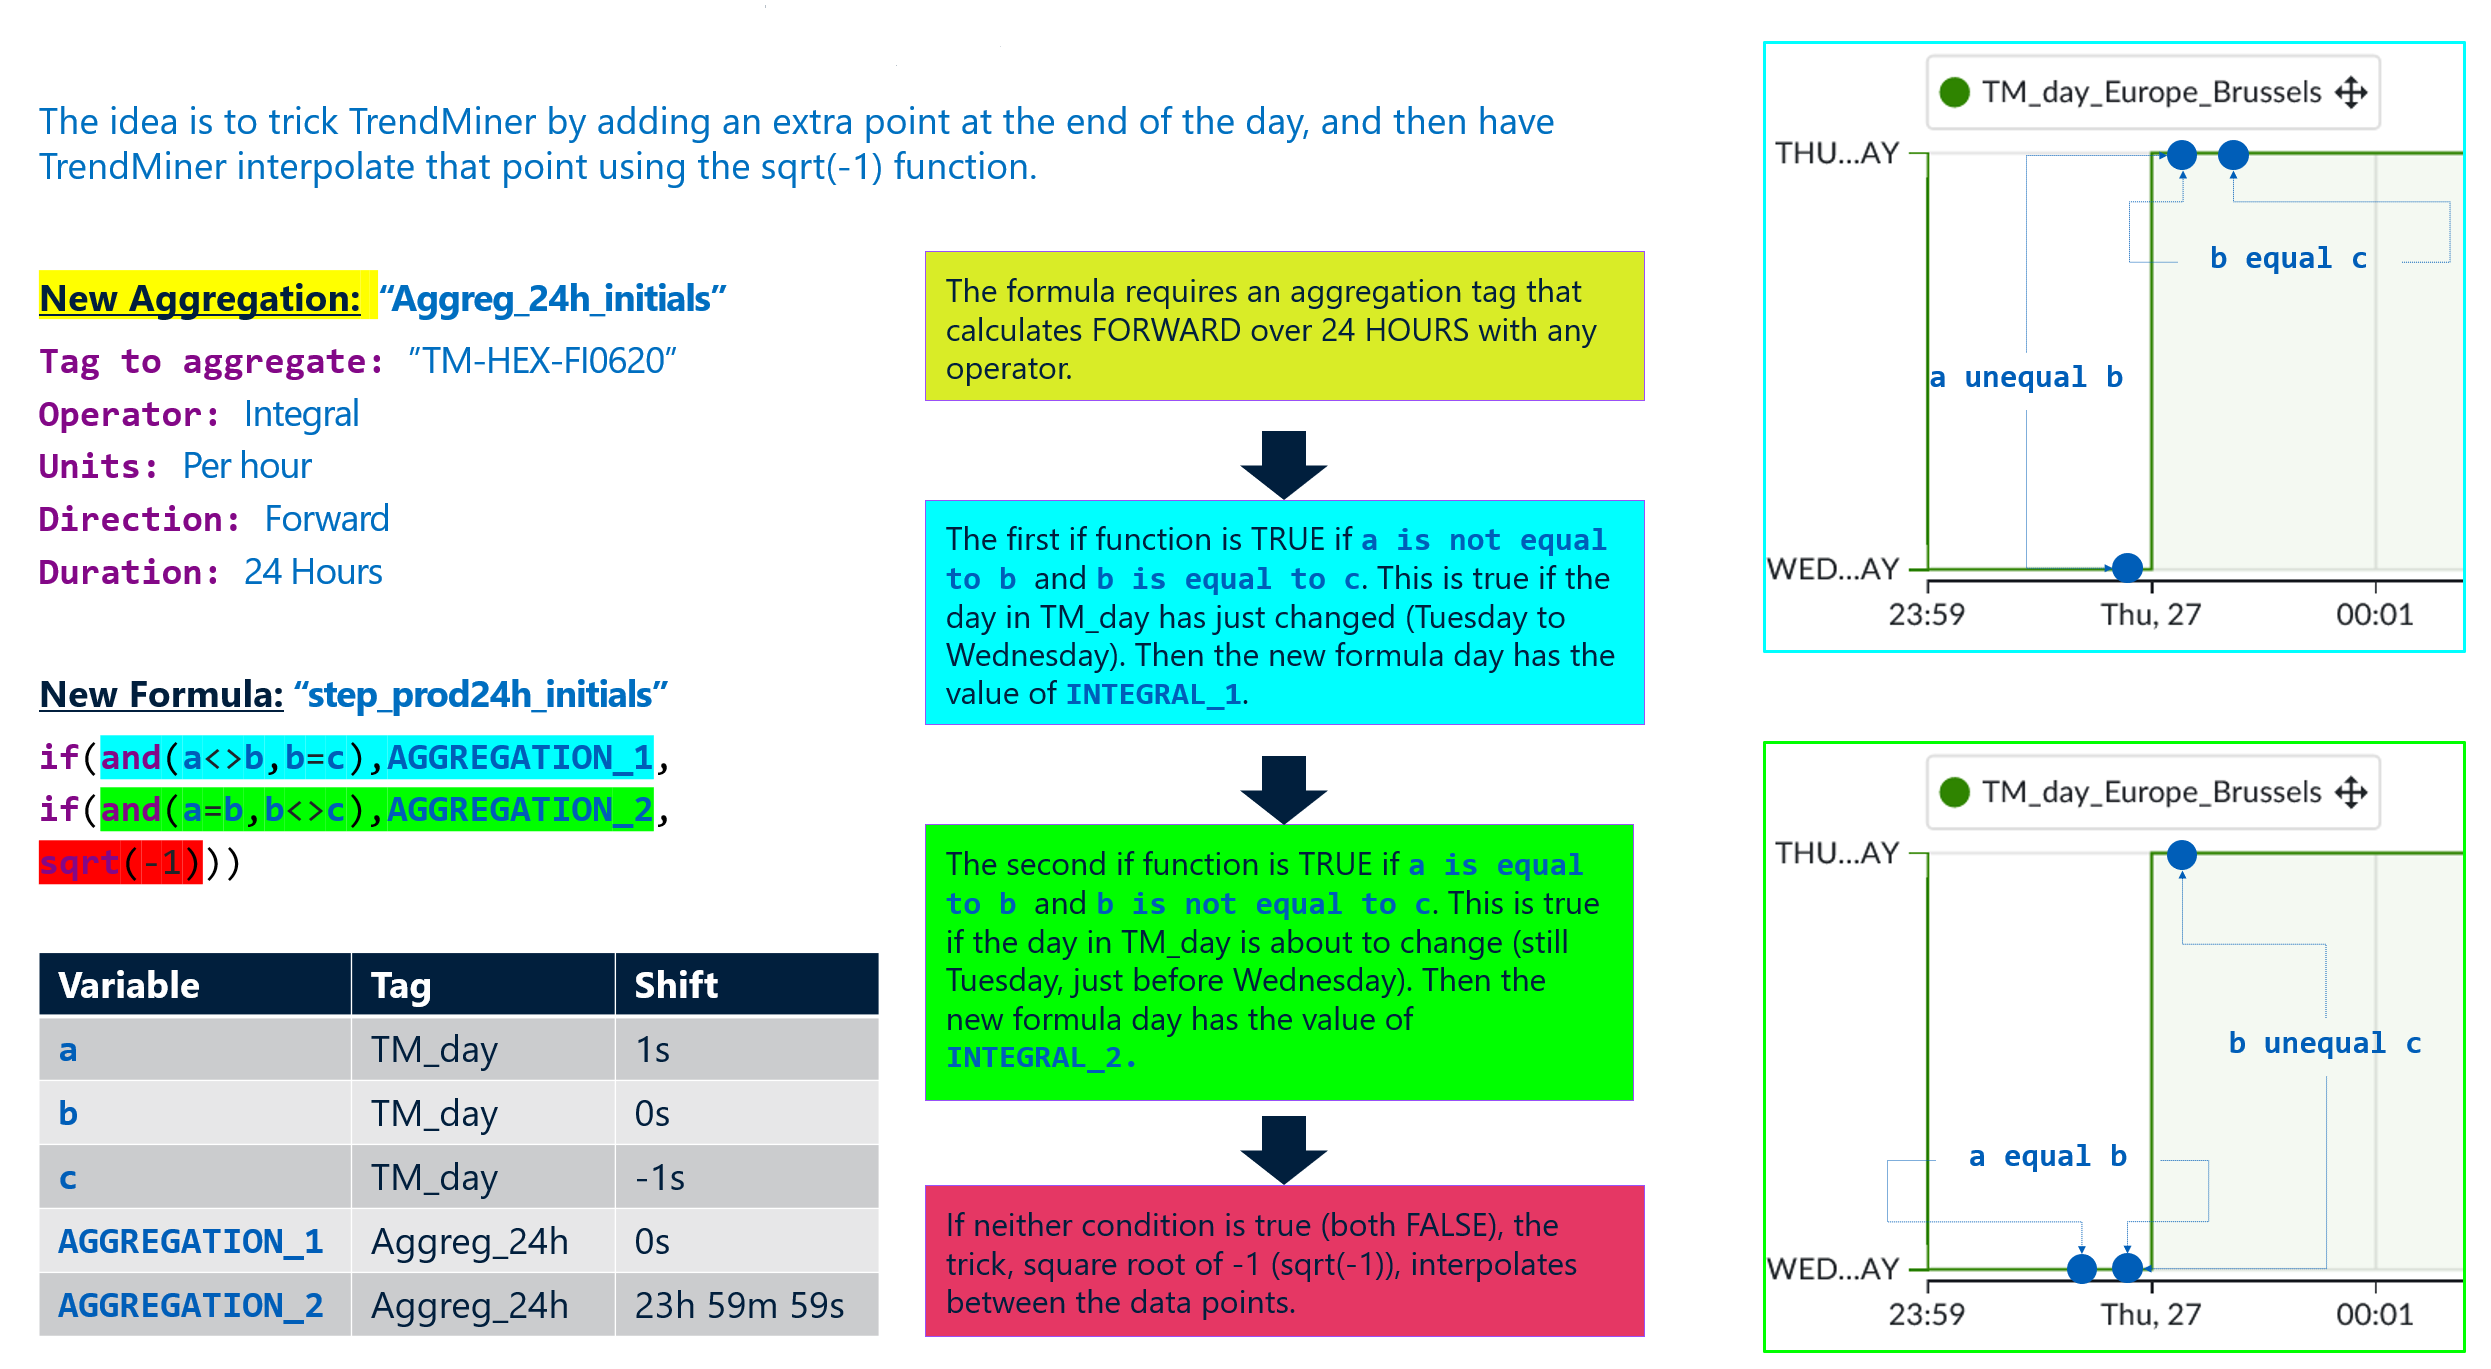
This method ensures that the daily production remains constant throughout the day before updating at the next daily boundary.
Conclusion
Each method serves different analytical needs:
-
Rolling 24h production → Ideal for real-time monitoring.
-
Daily production as peaks → Best for capturing distinct daily values.
-
Linear interpolated production → Useful for visual trend analysis.
-
Stepped daily production → Suitable for stepwise reporting.
By leveraging these approaches, TrendMiner users can efficiently monitor and analyze their daily production performance.
📌 Do you have experience with these methods? Share your insights and use cases in the comments! 🚀