Gantt charts give morning meetings a clear starting point. Every asset, its operational state, and any events from the last shift are laid out on one timeline, so teams can quickly see what happened overnight, agree on which anomalies are worth digging into, and move into investigation without spending the first 15 minutes piecing the story together from trends.
A few practical applications we've seen work well:
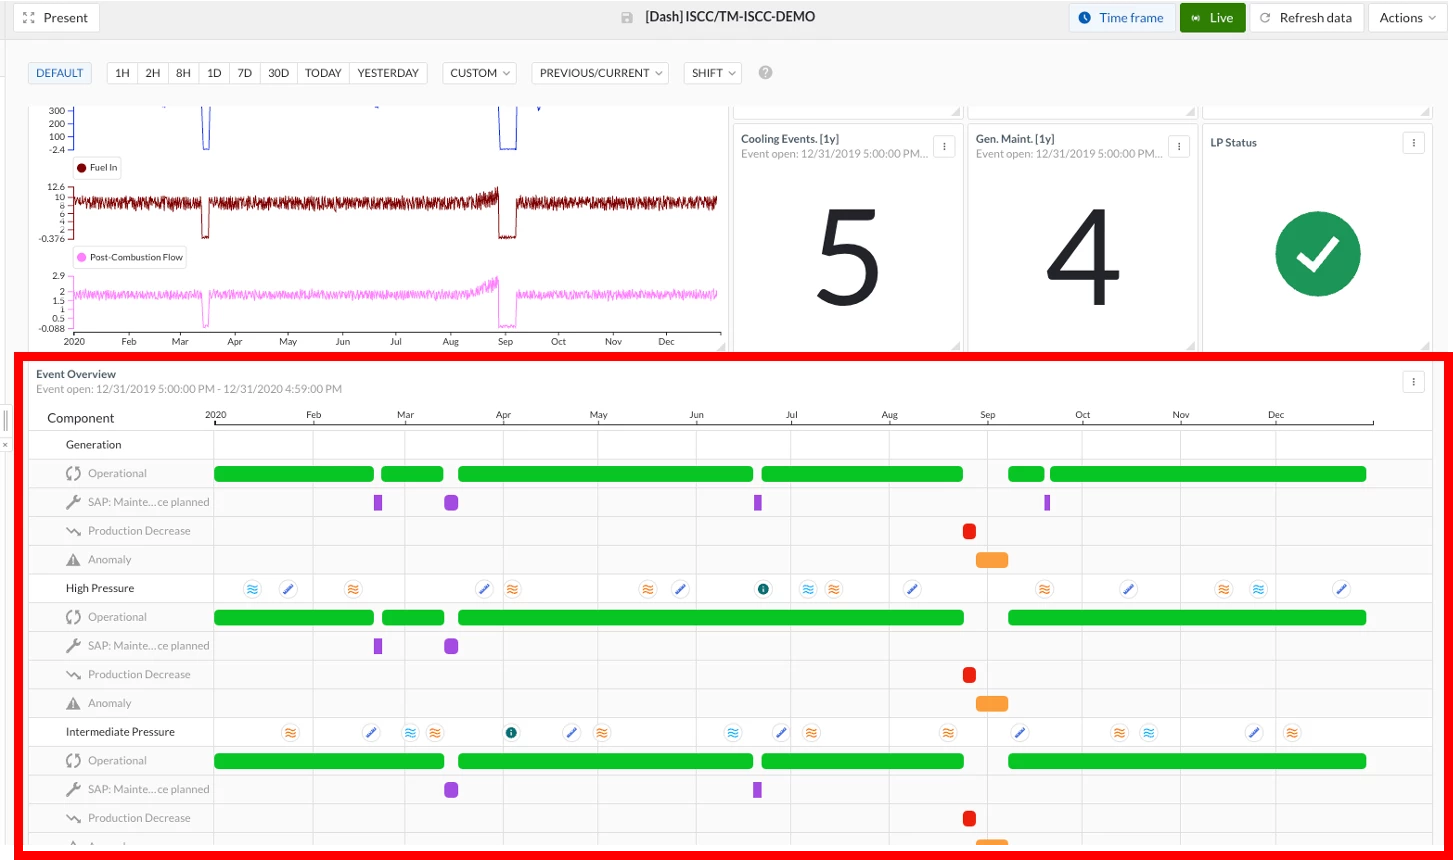
- Instant "did we run?" answer. Green operational bars show uptime coverage at a glance, and any gaps immediately draw the eye.
- Batch cycle flags. Conditional formatting turns any batch red when cycle time, temperature, or quality exceeds threshold, so the meeting starts with the exceptions rather than the routine.
- Planned vs. unplanned at a glance. SAP or CMMS maintenance events sit inline with process upsets, removing the "was this us or them?" debate.
- One-click drill-down. Click any bar to open the context item and jump into TrendHub with tags and timeframe pre-loaded, moving from what happened to root cause without leaving the flow.
- Live mode for 24/7 plants. New events appear on-screen during the meeting itself, so the picture stays current.