
In this article, we present 4 of our least used but valuable features which you can use to your advantage. We also show some concrete examples.
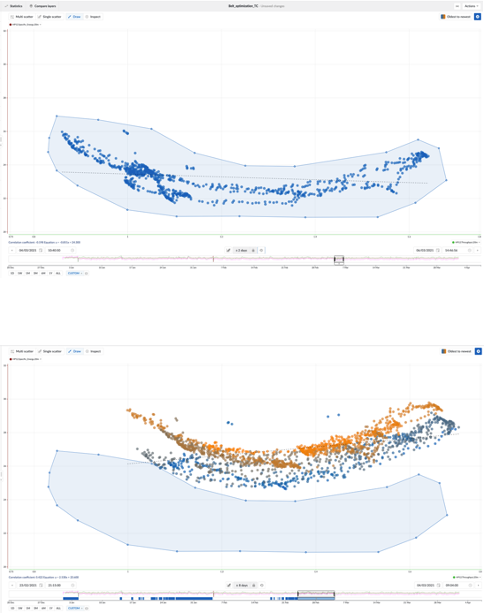
1 - Operating Area Search
-
Empowers users to intuitively identify optimal and suboptimal operating conditions through a visual interface.
-
Helps users detect process irregularities early by analyzing correlations between parameters.
-
Provides preventive maintenance warnings using the operating area search in a combination with monitors.
In the example shown below, the power a conveyor belt is consuming is plotted versus the specific power consumption, which takes into account the mass the conveyor belt is transporting. The scatter plot itself shows that there is an optimal point of operation looking only at energy consumption. Now, this area is selected as area of good operation and is used in the operating area search to look for periods when this correlation is changing, indicating a change in the operating conditions of the belt which means maintenance is necessary.
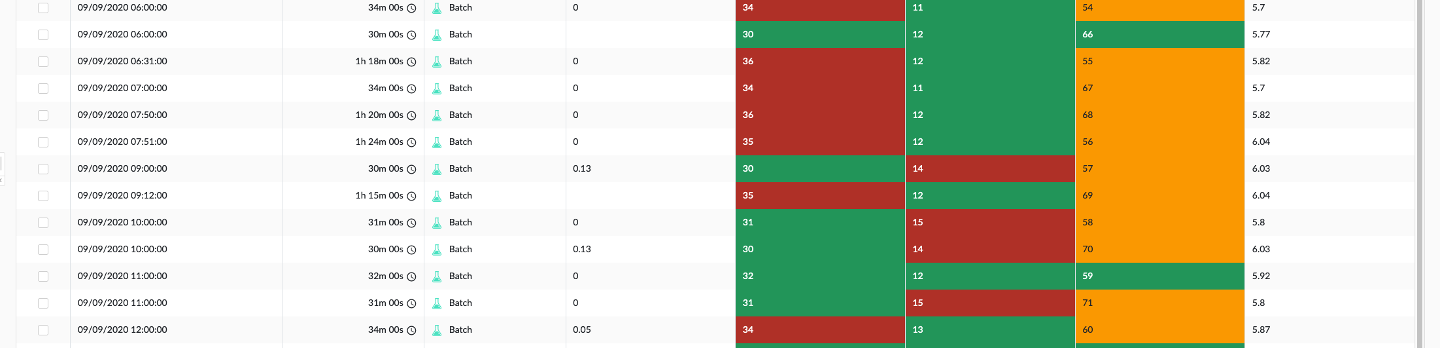
2 - Formatting of ContextHub Views
-
Allows users to visually structure ContextHub tables.
-
Emphasizes specific field entries and values for clarity.
-
Persists formatting on dashboards, enabling clear overviews.
In the example below, we color the table according to the value of the context item field to highlight context items with specific values.
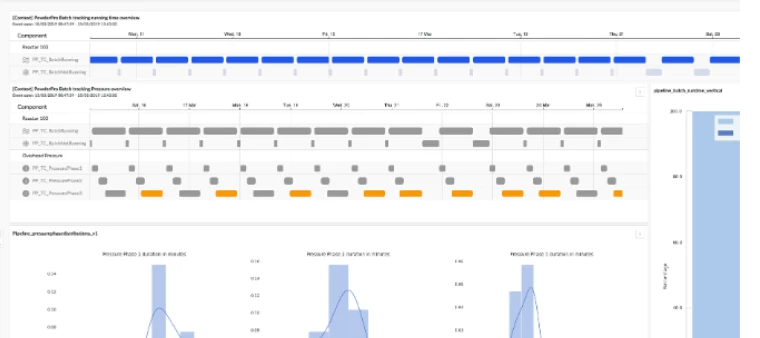
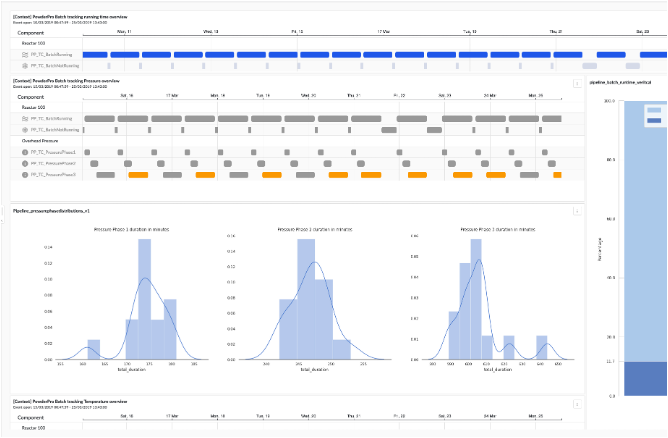
3 - Highlighting Specific Events on Dashboards
-
Transforms unformatted dashboards into visually organized displays.
-
Helps users focus on critical events and trends.
In the example shown below, we want to identify batch phases which are taking longer than 10 hours. We want to highlight them to get a grasp on the frequency of this event. Conditional formatting on the Gantt chart does the trick.
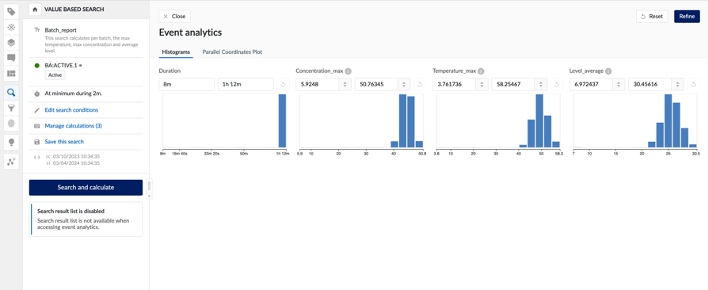
4 - Multiple Calculations on Search Results
-
Simplifies automated KPI calculations for different timeframes (e.g., monthly, daily, hourly, or per batch).
-
Enables proper refinement of search results and condition-based selection.
-
Enables the analysis on events to better understand why specific behavior occurs
In the example below, we used multiple calculations on top of search results to create batch reports. A value-based search was used to identify a batch. On top of these batches we calculated the maximum temperature, maximum measured concentration and the average batch level. As a next step, this data can be analyzed and refined, subsequently the search is saved together with the calculations to always have it within reach.