

Using TrendMiner’s Cross-Correlations Tool for Root Cause Analysis
One of the most powerful features within TrendMiner is the cross-correlations tool. It is especially useful when conducting root cause analysis because it helps identify correlated tags that could serve as early indicators for your tag of interest.
Identifying the Root Cause of a Process Disturbance
Let’s look at an example of how to identify the root cause of a process disturbance.
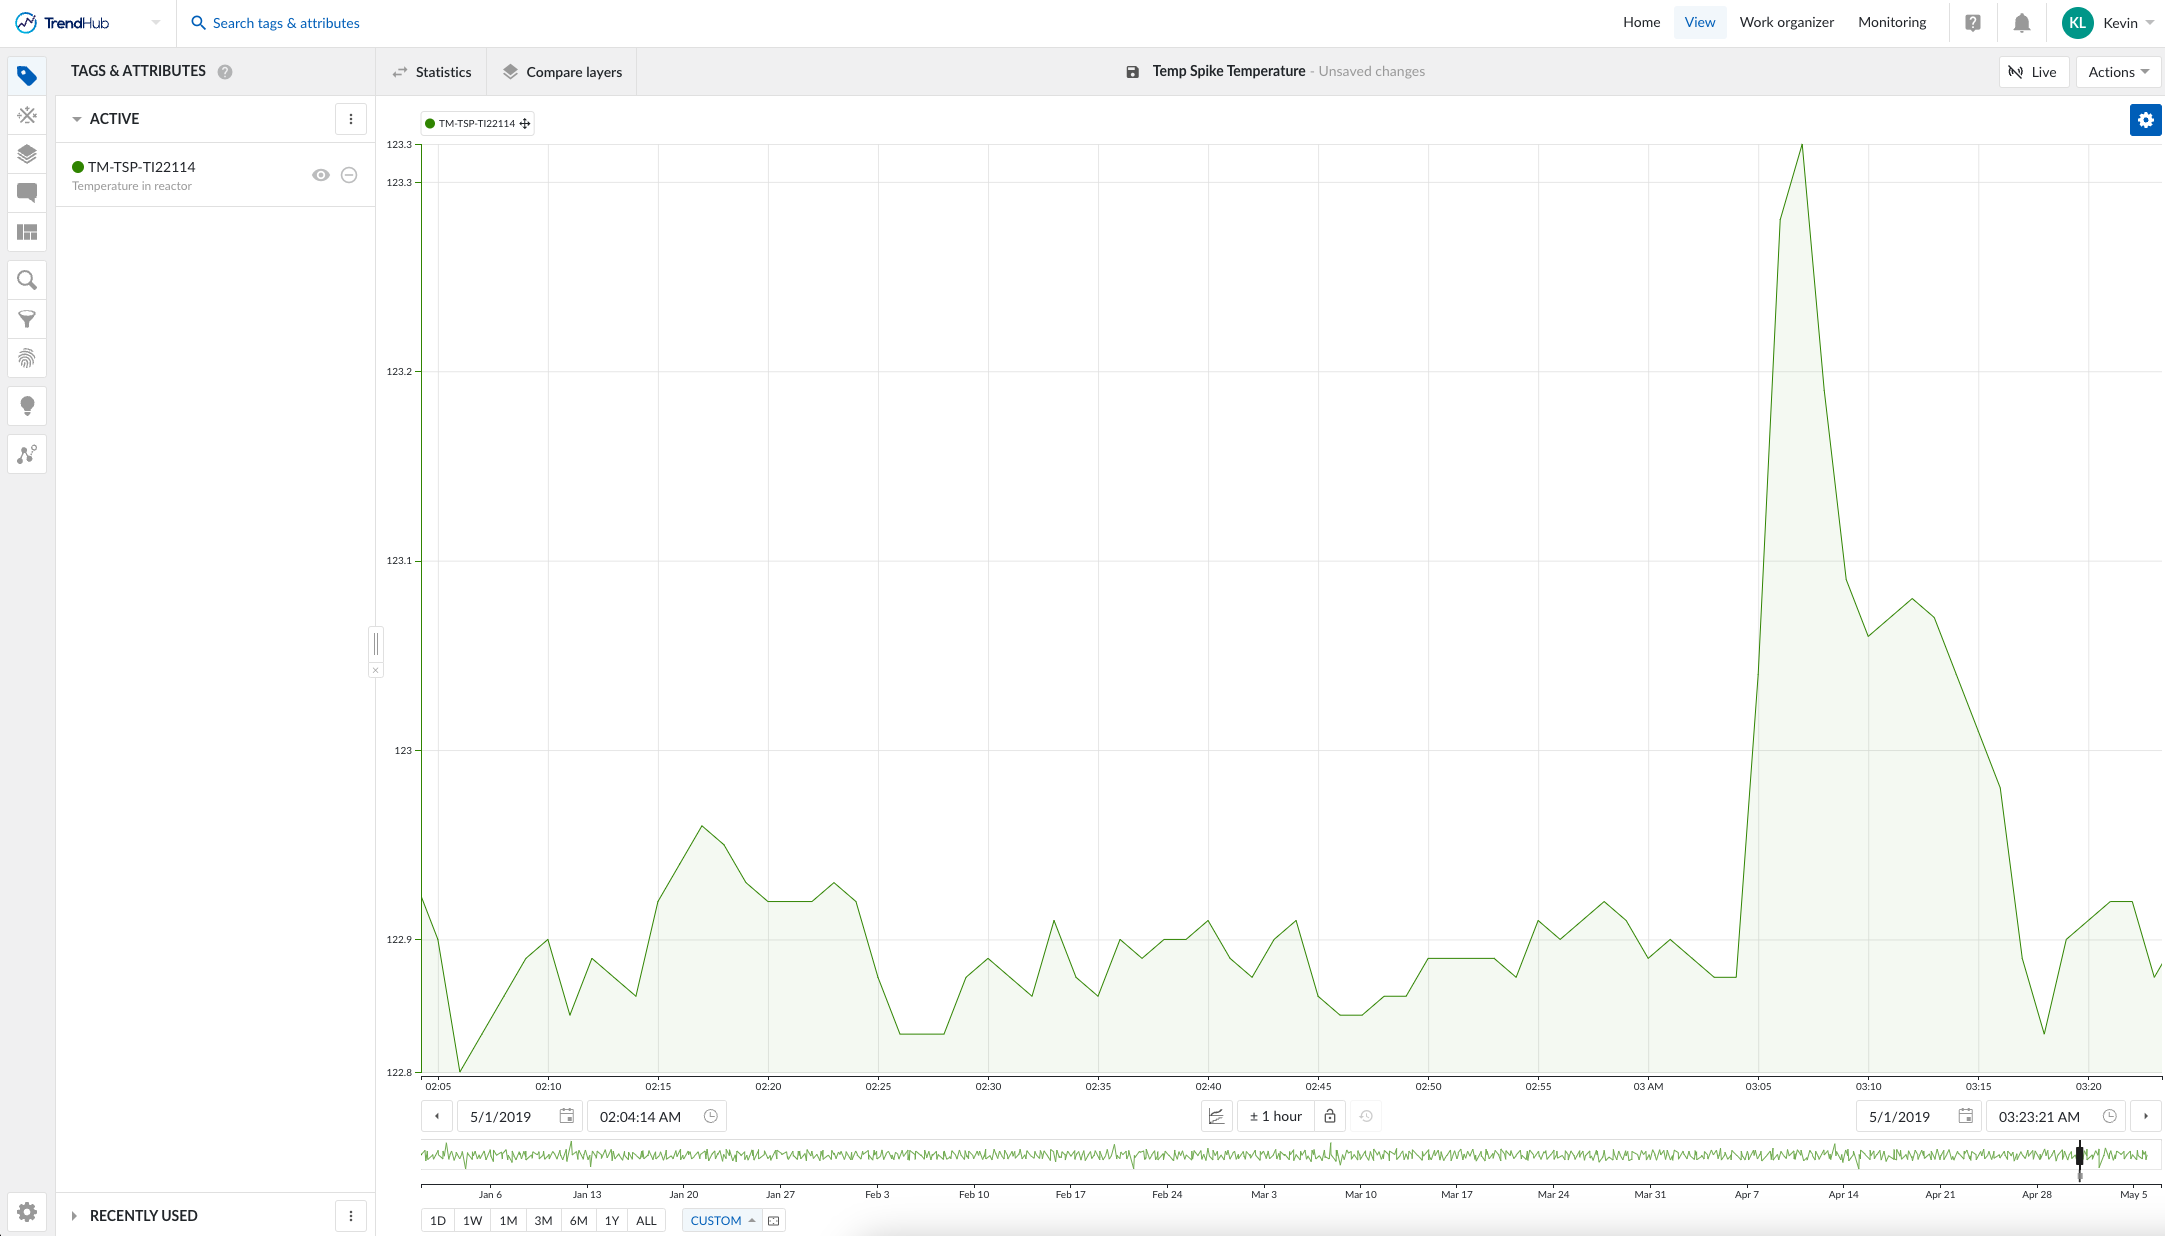
A process engineer monitoring a reactor unit notices an abnormal temperature spike in the reactor. The unit supervisor asks the engineer to determine what may have caused this increase. However, without immediate input from board operators and field operators, it can be difficult to know where to start. Reactor temperature fluctuations can result from many different factors, making troubleshooting a complex task.
This is where TrendMiner can help.
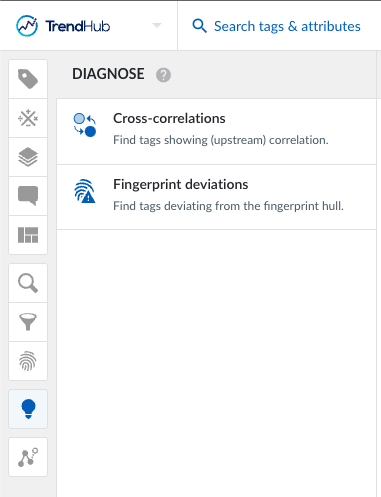
By using the cross-correlations tool, TrendMiner can quickly compute correlations between the reactor temperature tag and all other tags within the unit. The tool then returns a ranked list of tags with the highest correlation to the temperature tag. This list serves as a valuable starting point for the root cause analysis.
The process engineer can then analyze the returned tags, using process knowledge and engineering intuition to determine which ones are likely contributors to the temperature spike. Of course, correlation does not imply causation, so the engineer must assess whether each tag logically aligns with the process anomaly.
A Real-World Example: Reactor Cooling Water
In this example, the process engineer starts a cross-correlation analysis. To refine the results, they apply a tag filter expression so that the tool only searches for tags within the reactor unit, narrowing the scope of the analysis.
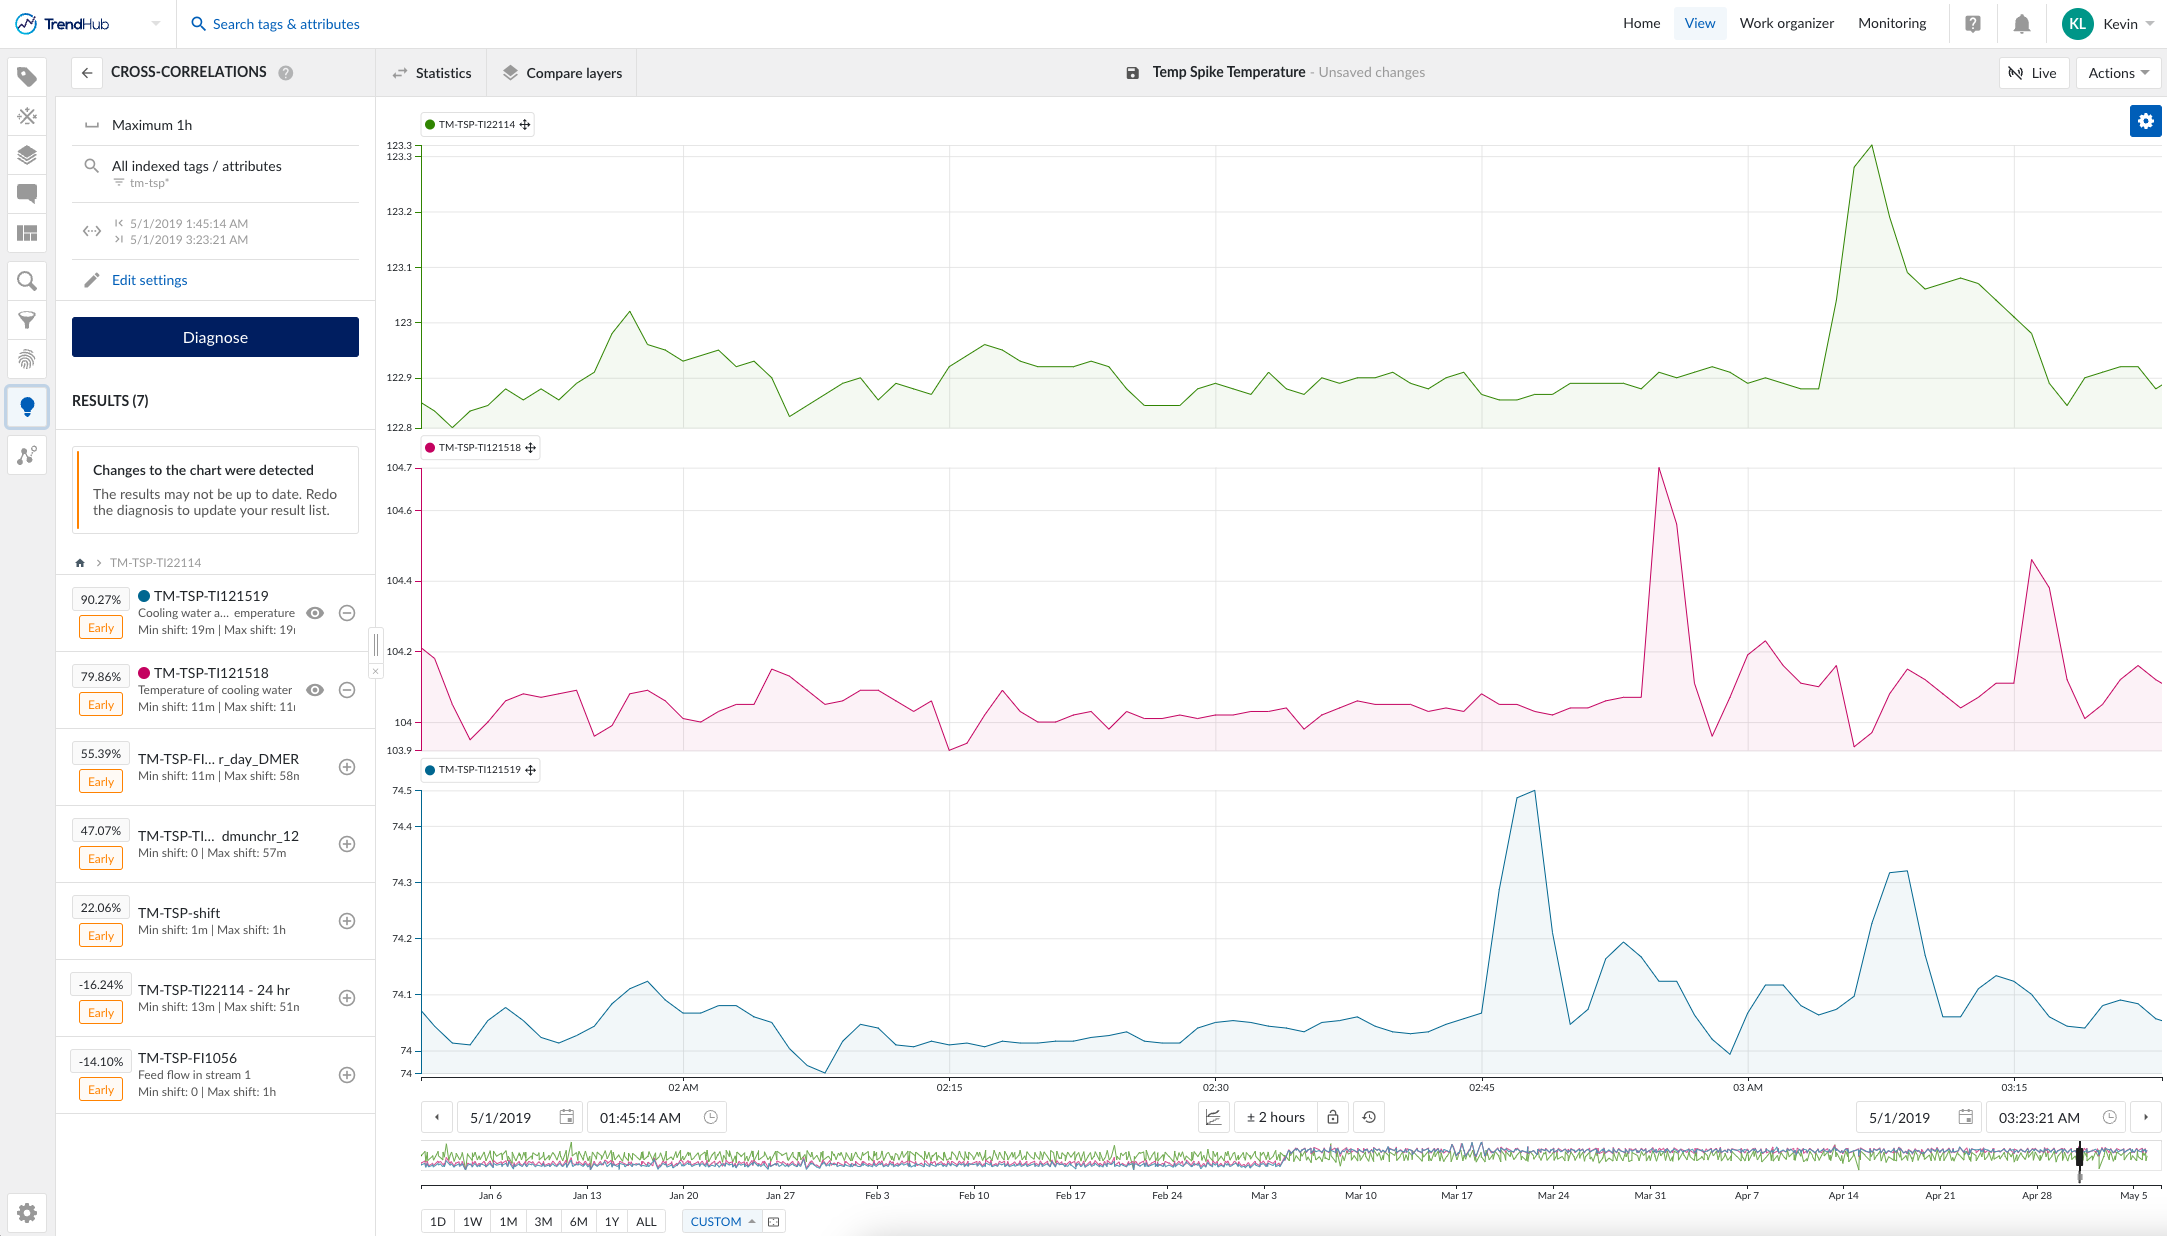
The tool returns a list of seven highly correlated tags. Among them, two tags stand out:
- Reactor cooling water temperature
- Ambient cooling water temperature
The engineer plots these tags against the reactor temperature and notices that spikes in both cooling water temperature tags occur before the reactor temperature spike. Based on this data, they hypothesize that a sudden increase in ambient cooling water temperature led to a rise in cooling water temperature entering the reactor, ultimately causing the reactor vessel temperature to spike.
Applying Cross-Correlations to Multiple Data Layers
As demonstrated, the cross-correlations tool provides a quick and effective starting point for root cause analysis. Additionally, it can be used to analyze multiple instances of similar process anomalies. If a recurring issue exists, users can layer historical periods of similar anomalies before conducting a cross-correlation analysis to identify consistent patterns.
Another Real-World Use Case: Steam Header Pressure
Recently, I worked with a TrendMiner user investigating a drop in steam header pressure in one of their process lines. We used cross-correlations as a starting point for the analysis. The tool returned a list of correlated tags, including one surprising result: a rain gauge tag.
This tag measured rainfall at the facility, and we discovered a significant correlation between rainfall and steam header pressure fluctuations. The engineer hypothesized that rainwater exposure to the steam line was affecting pressure stability. Based on this insight, they considered conducting a cost-benefit analysis to justify installing a roof or cover over the steam line to mitigate pressure swings during rainy weather.
Share Your Experience!
I hope this example helps illustrate the power of the cross-correlations tool for root cause analysis. Have you used cross-correlations in your own work? Share your experiences in the comments below!