I have a tank which is emptied regularily ~1 per day. I want to calculate the amount of total material in the tank over a year. No flow meter is available directly.
How can I set this up as an output directly in trendMiner?

I have a tank which is emptied regularily ~1 per day. I want to calculate the amount of total material in the tank over a year. No flow meter is available directly.
How can I set this up as an output directly in trendMiner?
Best answer by Wouter Daniels
Hi Jens,
One option would be to first convert the tank level into a flow by taking the (numeric) derivative in a formula, in which you would say the flow is equal to to the level n minutes ago minus the current level, multiplied by some constant. The higher your value for n, the slower the resulting tag will change but the less noisy the signal will be. In any case, you can always taking the moving average of the resulting flow tag for a smoother signal.
With such an approach, filling the tank will show up as a negative flow, which is typically not what we want. An easy approach would be to cap the formula at 0, which in theory would only count the outgoing flow.
The problem is more difficult if the tank is the tank is being filled and emptied at the same time, as there is no way of distinguishing in- and outgoing flows only from the level. One approach we have taken before for short filling periods is to assume the flow during these periods was equal to the flow of a few minutes ago.
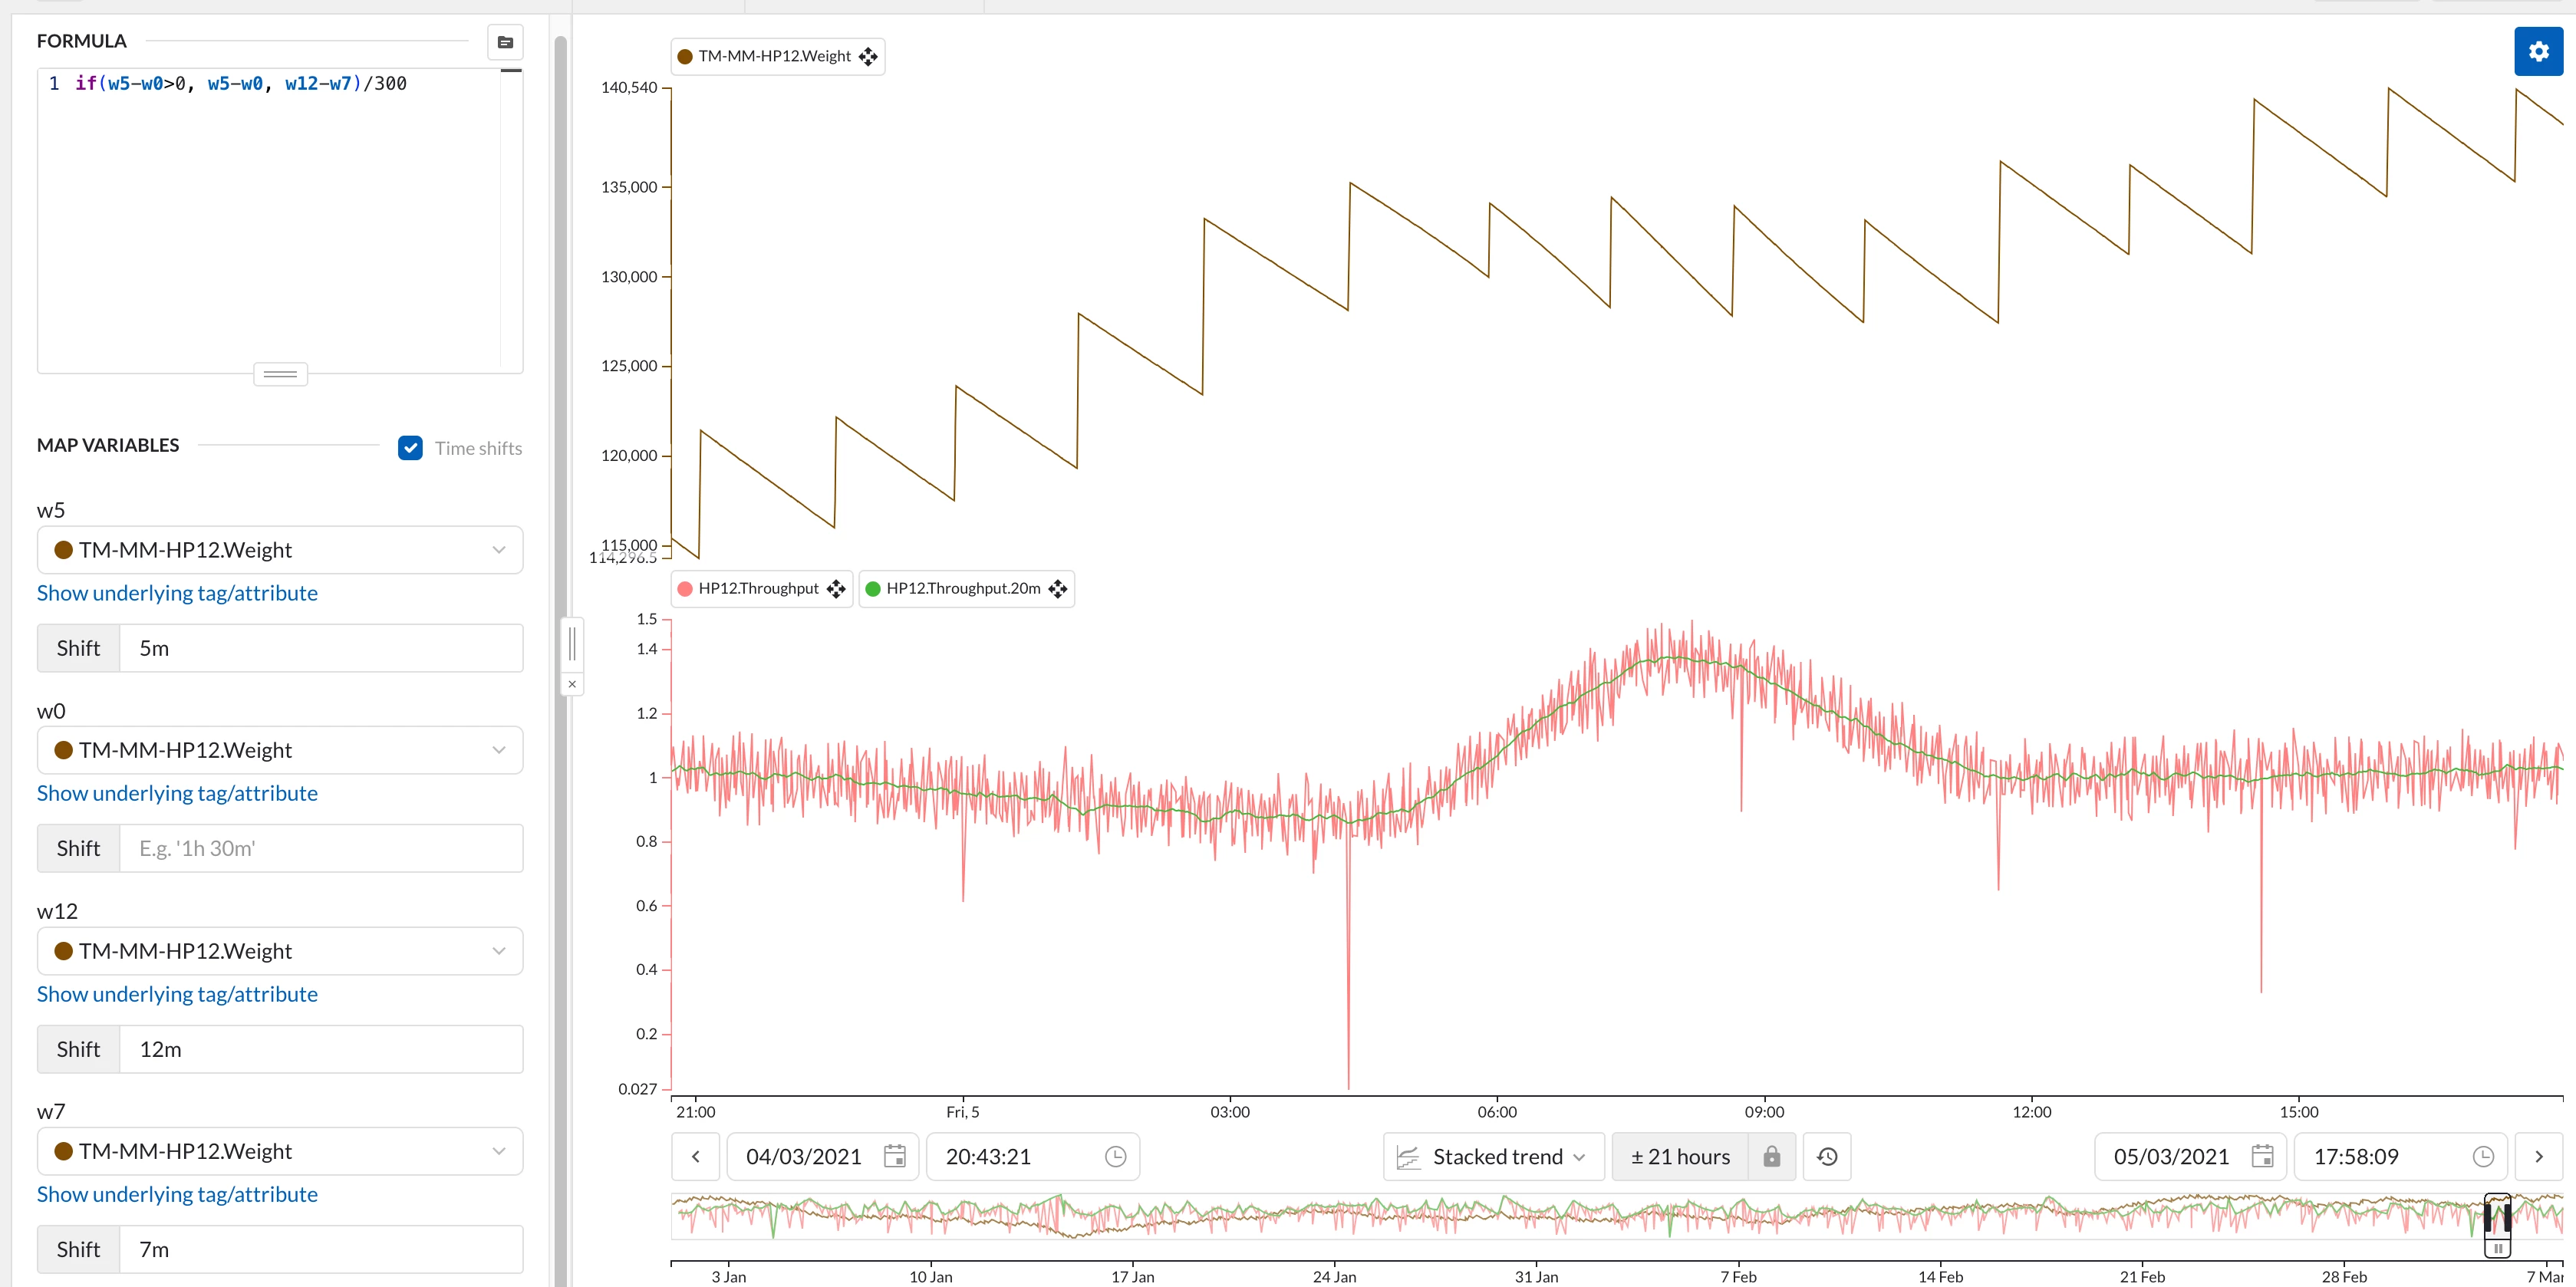
In the example below with, we take the change in weight over 5 minutes, and we fill in the periods of 'negative' flow with the flow of 7 minutes ago (which is longer than a refill should ever take in this case). Note we divide by 300 to get the flow on a 'per second' basis (300 seconds in 5 minutes).
In your case it sounds like we have the opposite situation: continuous filling of the tank and short emptying events, but the main idea would still stand. Likely you can get away with simply setting the flow value to 0 whenever there is no outgoing flow (i.e., when there is no level drop), just slightly underestimating the real flow.
Calculating the yearly total would then be a simple matter of setting your focus chart to a 1 year period and opening the statistics table to read the integral of the calculated flow tag. Another option would be to do a value-based search for where a built-in year tag (e.g., TM_year_UTC) has a constant value, and adding an integral calculation to get an overview of multiple years at once.
Another way to apply a correction factor for the incoming material during tank emptying would be to check what % of the year we are not emptying the tank (sum the duration of all value based search results within the year where flow = 0, and divide it by the total year length), and divide the yearly totals by this factor (e.g. divide the integral result by 0.975 if we were not emptying the tank 97.5% of the year). This basically sets the average incoming flow during emptying events to the yearly incoming flow average.
No account yet? Create an account
Enter your E-mail address. We'll send you an e-mail with instructions to reset your password.
