Answer

Controllcharts in TrendMiner

  • November 20, 2025
  • 1 reply
  • 26 views

Shams92
Pioneer
Forum|alt.badge.img+3

Hey,


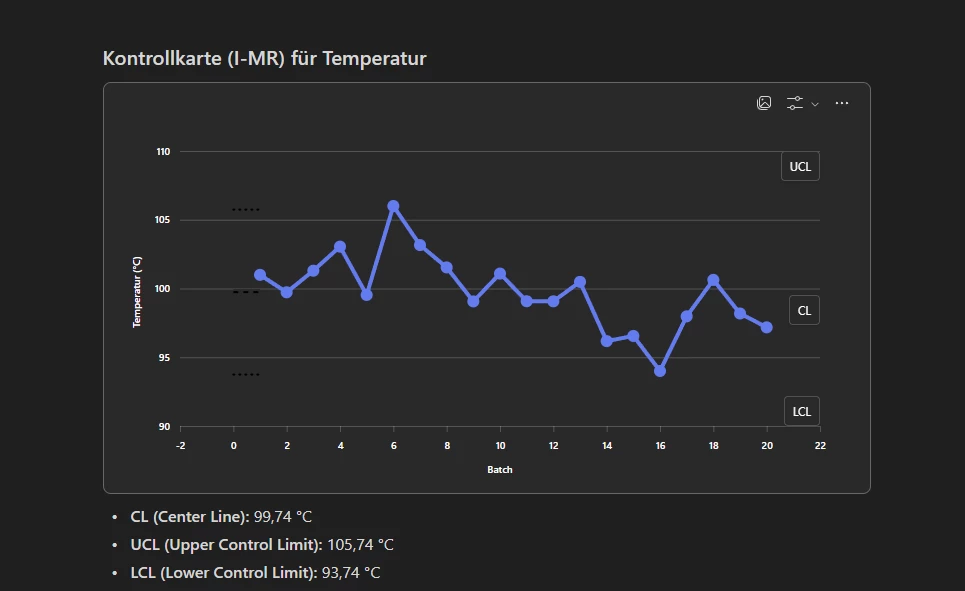
do you have experience with control charts in TrendMiner? We are thinking to set up some control charts for our batch process. As example we would look at avg temeratures at a certain step of a batch:


Would this be doable with MLHub? If yes, do you have example code you can share?

This would be very helpful for us to test it shortly in TrendMiner. 

Best
​​​​​​​Sören

Best answer by Wouter Daniels

Hi Sören,


Unless you have the average temperature already available in context items, I think the first step would be to get those out using a value-based search with calculations. Currently, there is no direct function available for this within MLHub, but you can build you own function using the API endpoints directly like this:
https://github.com/TrendMinerCS/mlhub-notebooks/blob/main/Calculations%20examples/value_based_search_and_calculation_example.ipynb

After getting the values out, you can create whatever plot you like. You can find example code for a control plot here:
https://github.com/TrendMinerCS/mlhub-notebooks/blob/main/Plotting%20examples/plotting_example.ipynb


You could also consider creating a tag with average temperatures directly with custom calculations, and specifying control limits as constant value formula tags, or even calculate them dynamically from the average and standard deviation of the last n batches (again using custom calculation tags).


Hope this helps!


Wouter

1 reply

Wouter Daniels
Employee
Forum|alt.badge.img
  • Employee
  • Answer
  • November 24, 2025

Hi Sören,


Unless you have the average temperature already available in context items, I think the first step would be to get those out using a value-based search with calculations. Currently, there is no direct function available for this within MLHub, but you can build you own function using the API endpoints directly like this:
https://github.com/TrendMinerCS/mlhub-notebooks/blob/main/Calculations%20examples/value_based_search_and_calculation_example.ipynb

After getting the values out, you can create whatever plot you like. You can find example code for a control plot here:
https://github.com/TrendMinerCS/mlhub-notebooks/blob/main/Plotting%20examples/plotting_example.ipynb


You could also consider creating a tag with average temperatures directly with custom calculations, and specifying control limits as constant value formula tags, or even calculate them dynamically from the average and standard deviation of the last n batches (again using custom calculation tags).


Hope this helps!


Wouter