We have tags available where we monitor fa oilusage on a shift or Daily basis. After the shift the tags goes back to zero. I like to create a graph or table to monitor the oilusage per shift for the last 5 7 days

Solved
Create a table on usage tag
Best answer by Wouter Daniels
If the oil usage is a totalizing tag, what I would do in such a case is:
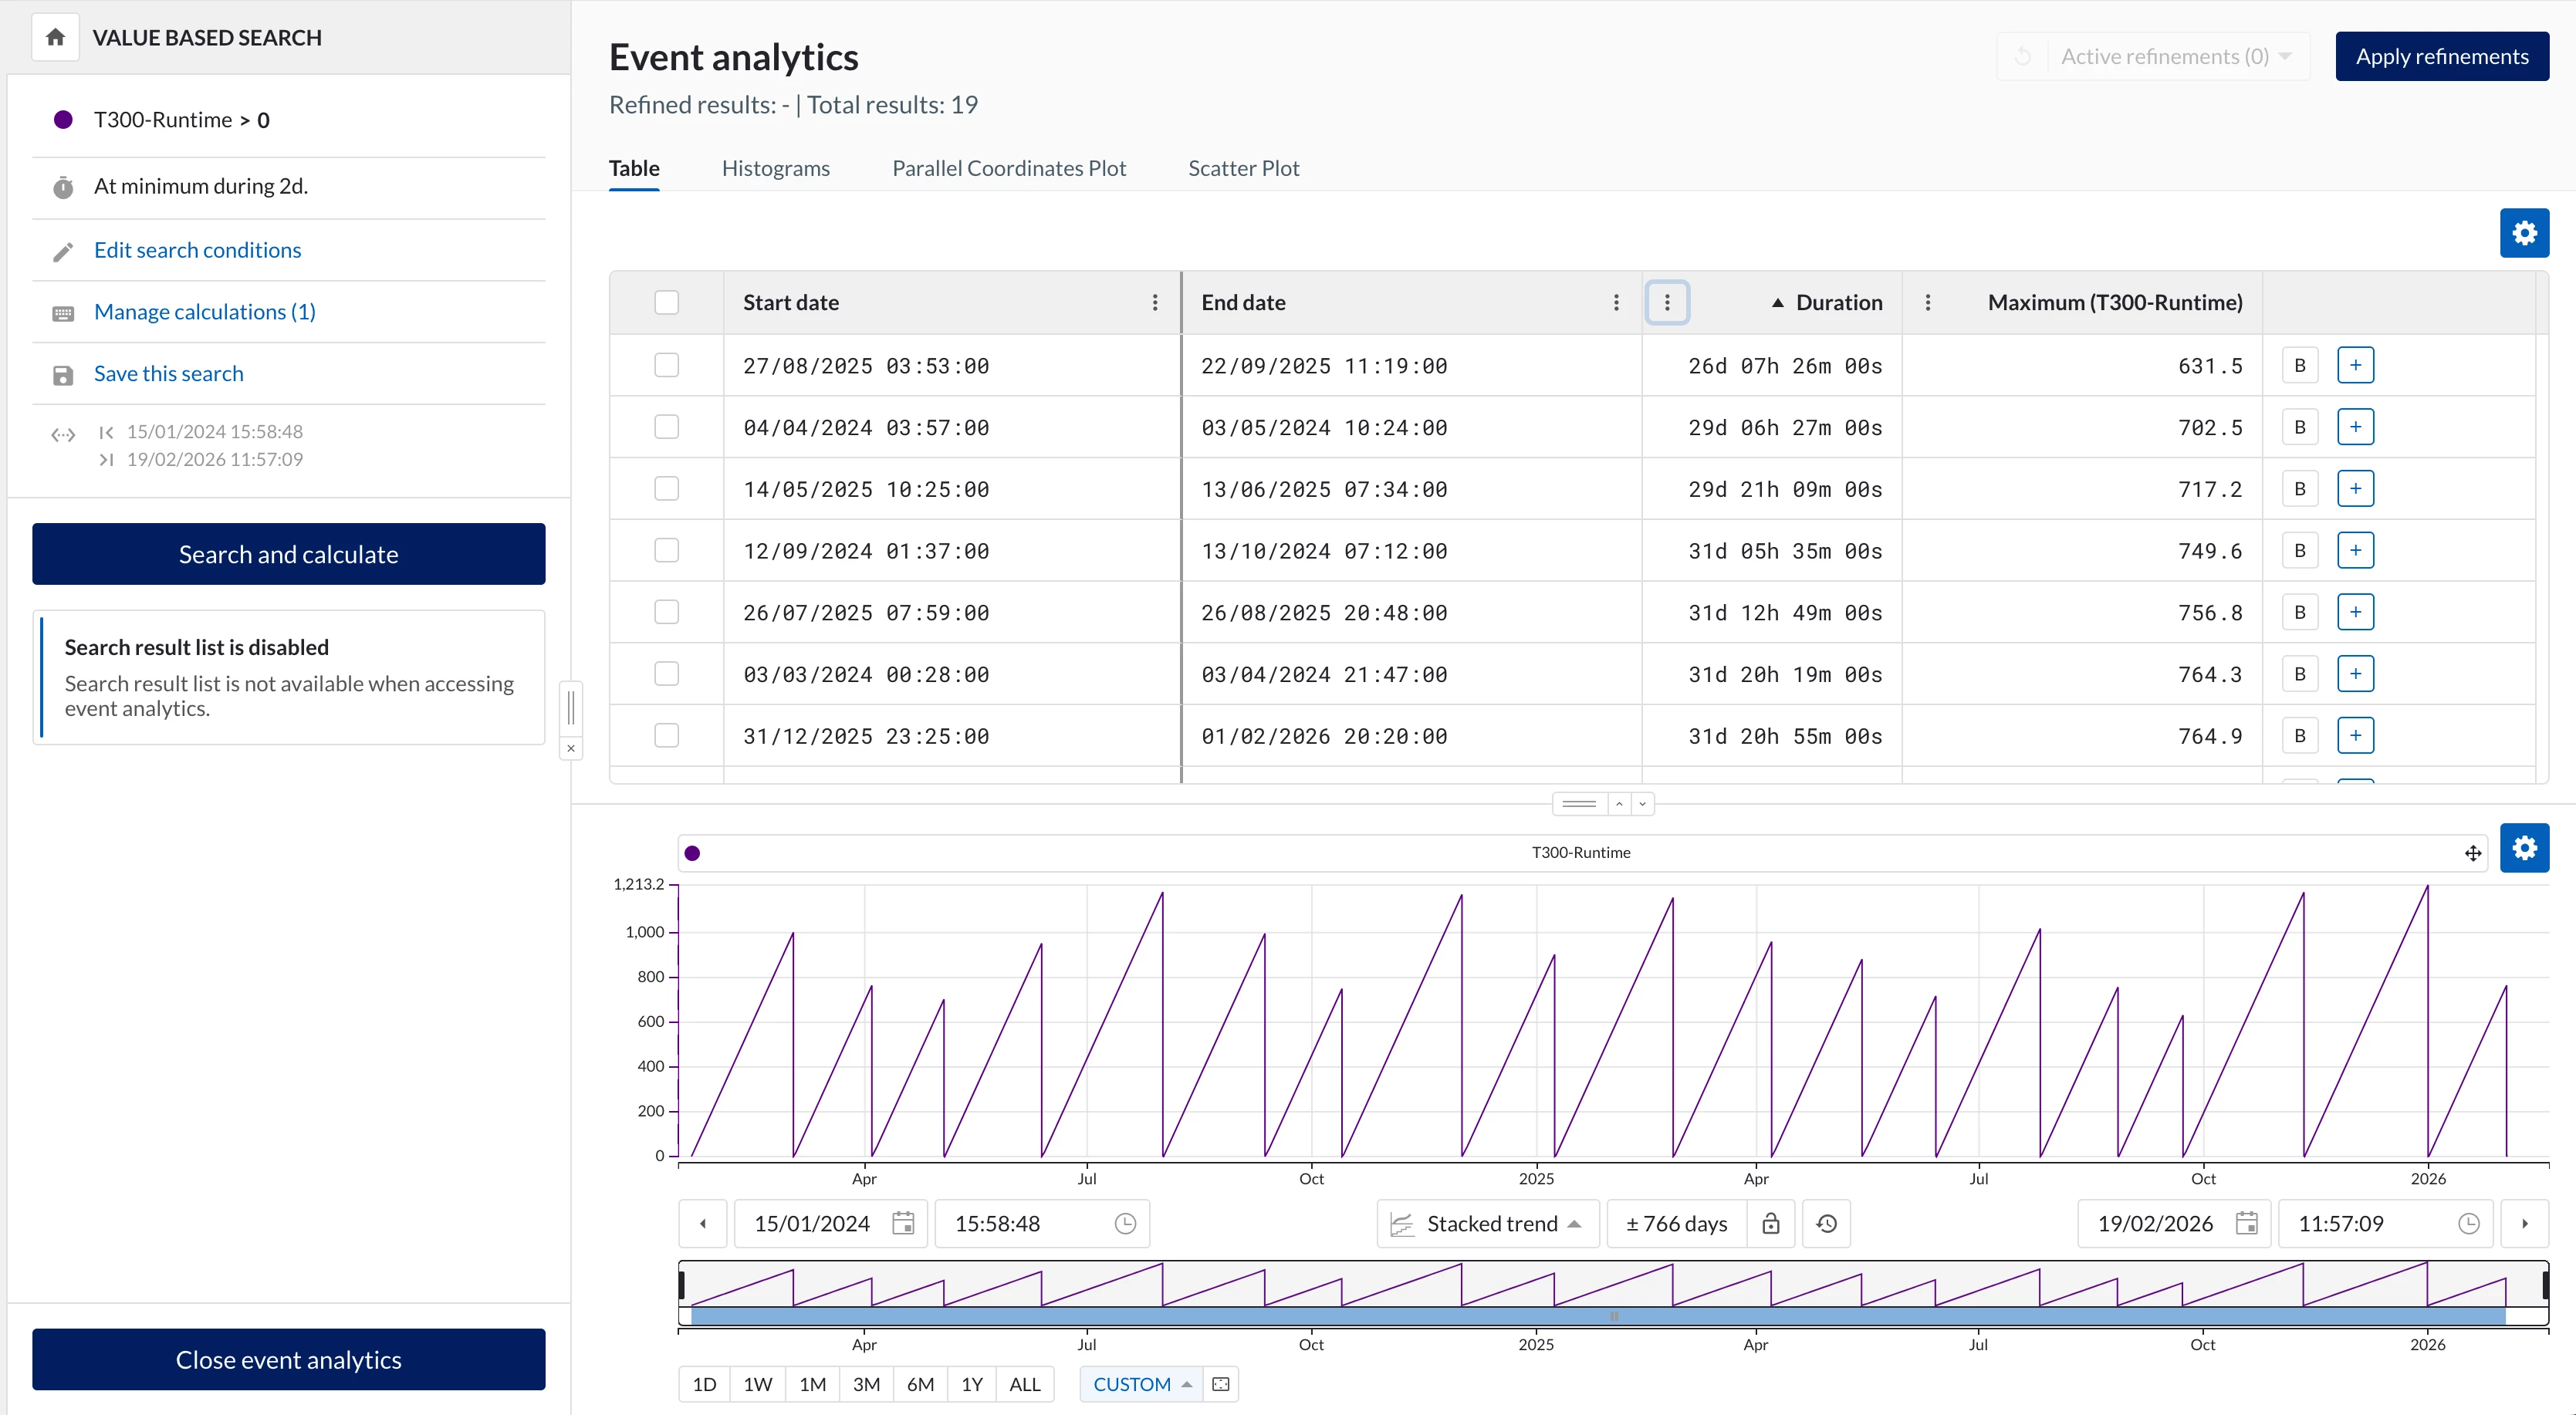
- Perform a value-based search on the oil usage being higher than 0, which should give you one search result per shift (you could also use a shift tag to find these periods, if you have it.). You will get all shifts within your search window. You might want to set a minimal duration to your search to exclude partial shifts.
- Add a calculation on top of the search to get the maximum value of the oil usage. This should give the total oil usage of the shift.
- Open Event Analytics in TrendMiner on the search results, to see a table of oil usage per shift. You could also export your search results to an Excel file.
Would this work for your use case?
Wouter

Login to the community
No account yet? Create an account
Enter your E-mail address. We'll send you an e-mail with instructions to reset your password.