Question

Dashboard conditions based on tag

  • April 9, 2026
  • 4 replies
  • 69 views

I am making a dashboard where I want to show the most critical values of the plant. For every tile I want to make conditions to make it green if good and red if bad. I want to use flexible borders based on a tag. For example the maximum temperature of a vessel depends on the product we make. So I want to make the conditions for making the temperature of the vessel green or red dependent on a separate tag that changes when the product changes. The conditions in the dashboard should therefore be dependent on another tag, not a fixed value. Is this possible?

4 replies

Pelinsu
Community Manager
Forum|alt.badge.img
  • Community Manager
  • April 9, 2026

Hello,

In TrendMiner, DashHub tile thresholds are currently static (numeric only). However, the standard best practice for your requirement is to move the logic from the dashboard to the tag level.

Here is how you can set it up:

1. Create a Formula Tag: Open Tag Builder and create a formula that compares your vessel temperature with your dynamic product limit tag.

Formula: IF(temperature > limit_tag, 1, 0)

Reference: TrendMiner Tag Builder: Formula Guide (Check "Example 1" in the documentation for similar logic).

2. Configure the DashHub Tile:
•  Add a Current Value Tile using this new calculated "Status Tag".
•  In the tile settings, use Conditional Formatting:
If value is 1, set background to Red.
If value is 0, set background to Green.

This way, whenever the product changes (and the $limit_tag updates), your dashboard tile will automatically reflect the correct status without any manual intervention.

I hope it helps for your question, let me know if you need more information.

Kind Regards,


  • Author
  • Explorer
  • April 9, 2026

Hi Pelinsu,


Thank you for your response! This helps in getting a green or red screen, but unfortunatly I cannot view the actual temperature this way. Do you know if ‘flexible’ thresholds on the DashHub tiles will be an option in the future?


Kind regards


Toon


yracette
Pioneer
Forum|alt.badge.img+2
  • April 10, 2026

I have raised the question of having color thresholds tied to other tags/components on Current Value tiles during our onboarding. And I just formalized it as a Product Idea.

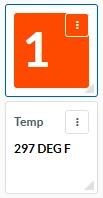
There is no easy or elegant workaround that I can think of but if I really had to do this and draw the attention to my temperature Current Value tile on a dashboard, I believe I would use another Current Value tile tied to the formula tag with a green/red threshold and place it right on top or underneath my temperature tile and using the minimum fields allowed by the tools/tiles. Ideally, the formula tag value would not even appear and there would be a much smaller grid/size to pick from for the highlighting tile.


Pelinsu
Community Manager
Forum|alt.badge.img
  • Community Manager
  • April 10, 2026

Great suggestion, ​@yracette  Thank you so much for sharing your workaround with the Community.

Actually, to address your last point about making the formula tag value disappear, there is good news! In our latest 2026.R1.0 version, we introduced labels for current value tiles.

@BESIMOTO You can find Yves’s product idea link here and give your vote : 


Additionally, we will have hands-on training sessions at TrendLab 2026 where we’ll explore these new dashboard capabilities in detail. I highly recommend joining us at the event to learn, discuss your ideas with peers, and connect with our team in person. It would be great to see you there! More info: https://community.trendminer.com/p/trendlab