Solved

DashHub Create a downtime count

  • February 9, 2026
  • 3 replies
  • 149 views

Dear all, 

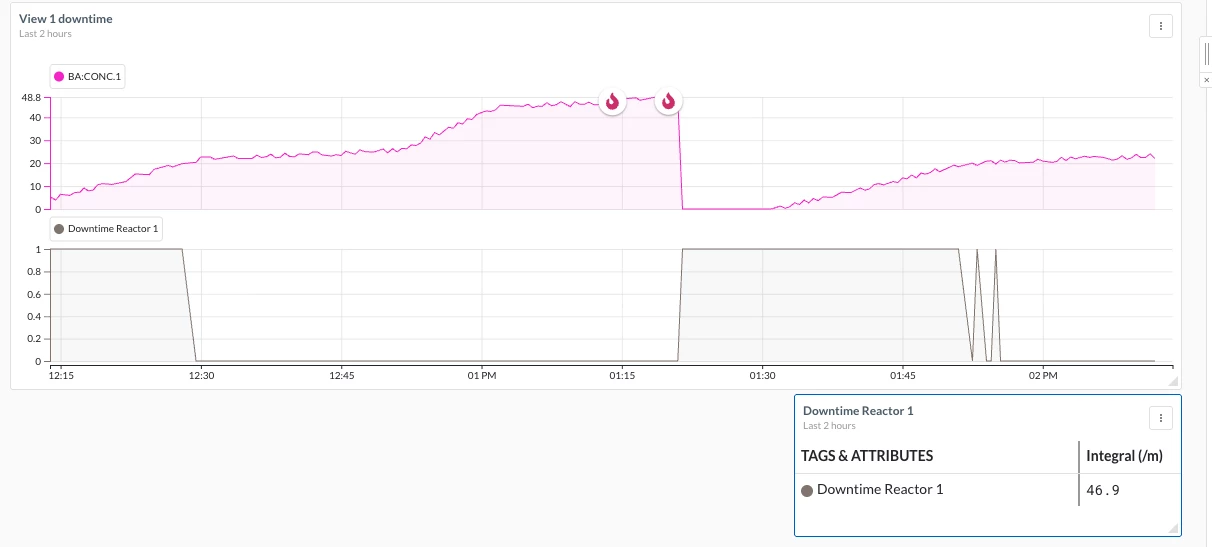
I would like to display the downtime (in minutes) of one machine in a DashHub view.


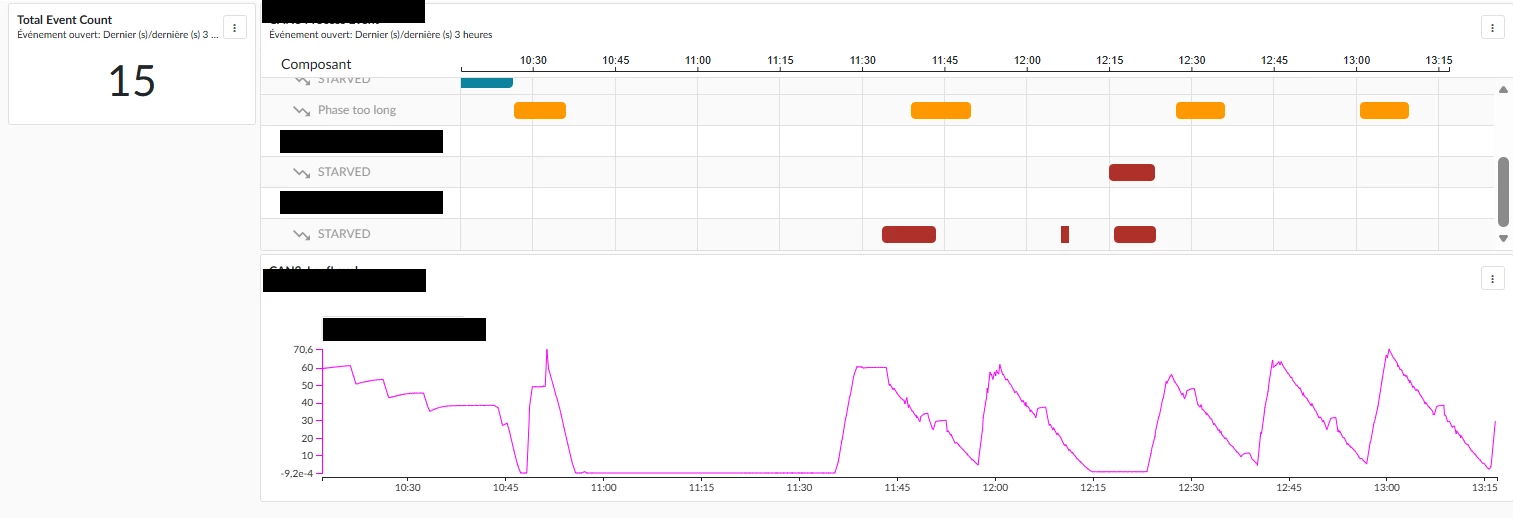
I created a Gantt chart that helps me quickly identify downtime on the line and the related root causes. The goal for the operator is to keep the number of events as low as possible.


Similarly to the Event Count, I would like to have a count of total downtime (in minutes). Since the counter only seems to count ContextItems, I considered creating one ContextItem per minute whenever the machine is stopped. However, I’m not sure how to create a tag that tracks minutes, and I’m also wondering if there is a better approach.

Best answer by eddieh

Hi, in that same dashboard you could add a TrendHub view tile like the one shown below to get the total number of minutes. For example, I’ve created the gray tag using an IF statement with a formula which is equal to 1 when there is downtime and 0 when there isn’t. For such a tag the integral calculation (per minute), will give you the total number of minutes of downtime over the selected timeframe from your dashboard global time.

Let us know if this helps or if you need assistance setting this up.


3 replies

eddieh
Employee
Forum|alt.badge.img
  • Employee
  • Answer
  • February 9, 2026

Hi, in that same dashboard you could add a TrendHub view tile like the one shown below to get the total number of minutes. For example, I’ve created the gray tag using an IF statement with a formula which is equal to 1 when there is downtime and 0 when there isn’t. For such a tag the integral calculation (per minute), will give you the total number of minutes of downtime over the selected timeframe from your dashboard global time.

Let us know if this helps or if you need assistance setting this up.


  • Author
  • Explorer
  • March 4, 2026

Hi Eddieh,

First of all, thank you for your answer and sorry for the delay. I had to request an update of the TrendMiner version, because displaying the statistics table was not available in version 2024. Now that we’ve upgraded to 2025R3, I can finally try it.

As you recommended, I created a tag that goes to 1 when the machine is starved.
Unfortunately, I still can’t find how you managed to show only the “Integral” in the statistics view, and how to change the calculation to /m.

Could you please guide me on this?


eddieh
Employee
Forum|alt.badge.img
  • Employee
  • March 9, 2026

@PUDucorr I can’t tell exactly which version of TrendMiner you are running but you can try the following. Hope this helps!

  1. Opening that same view in TrendHub
  2. Adjusting which statistics you want to show in your “Statistics Table”
  3. Then Save the view again.


This is only available in 2025.R4. If you are still on 2025.R3, you don’t have the option to select which statistics you want display.