
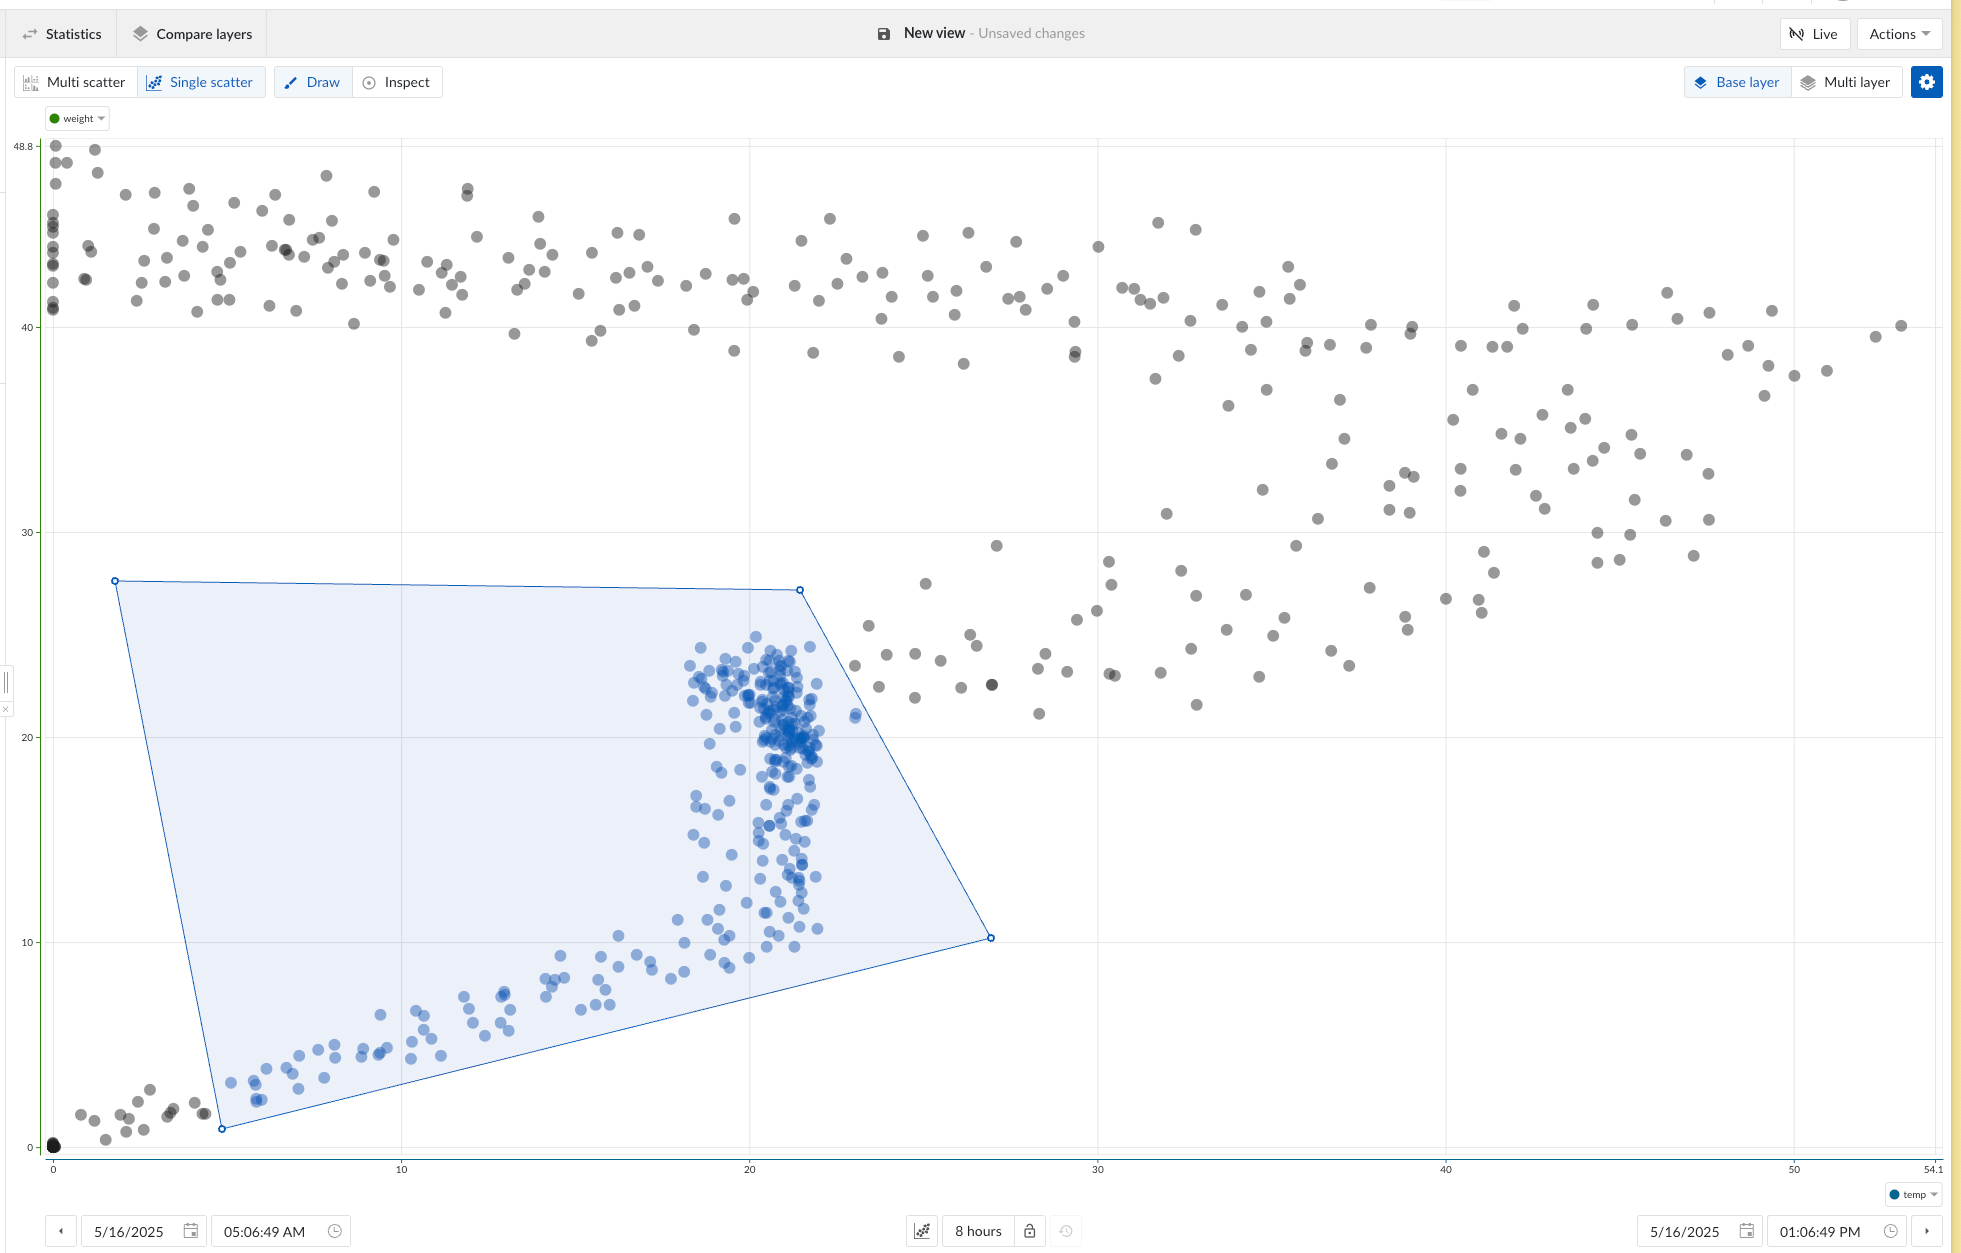
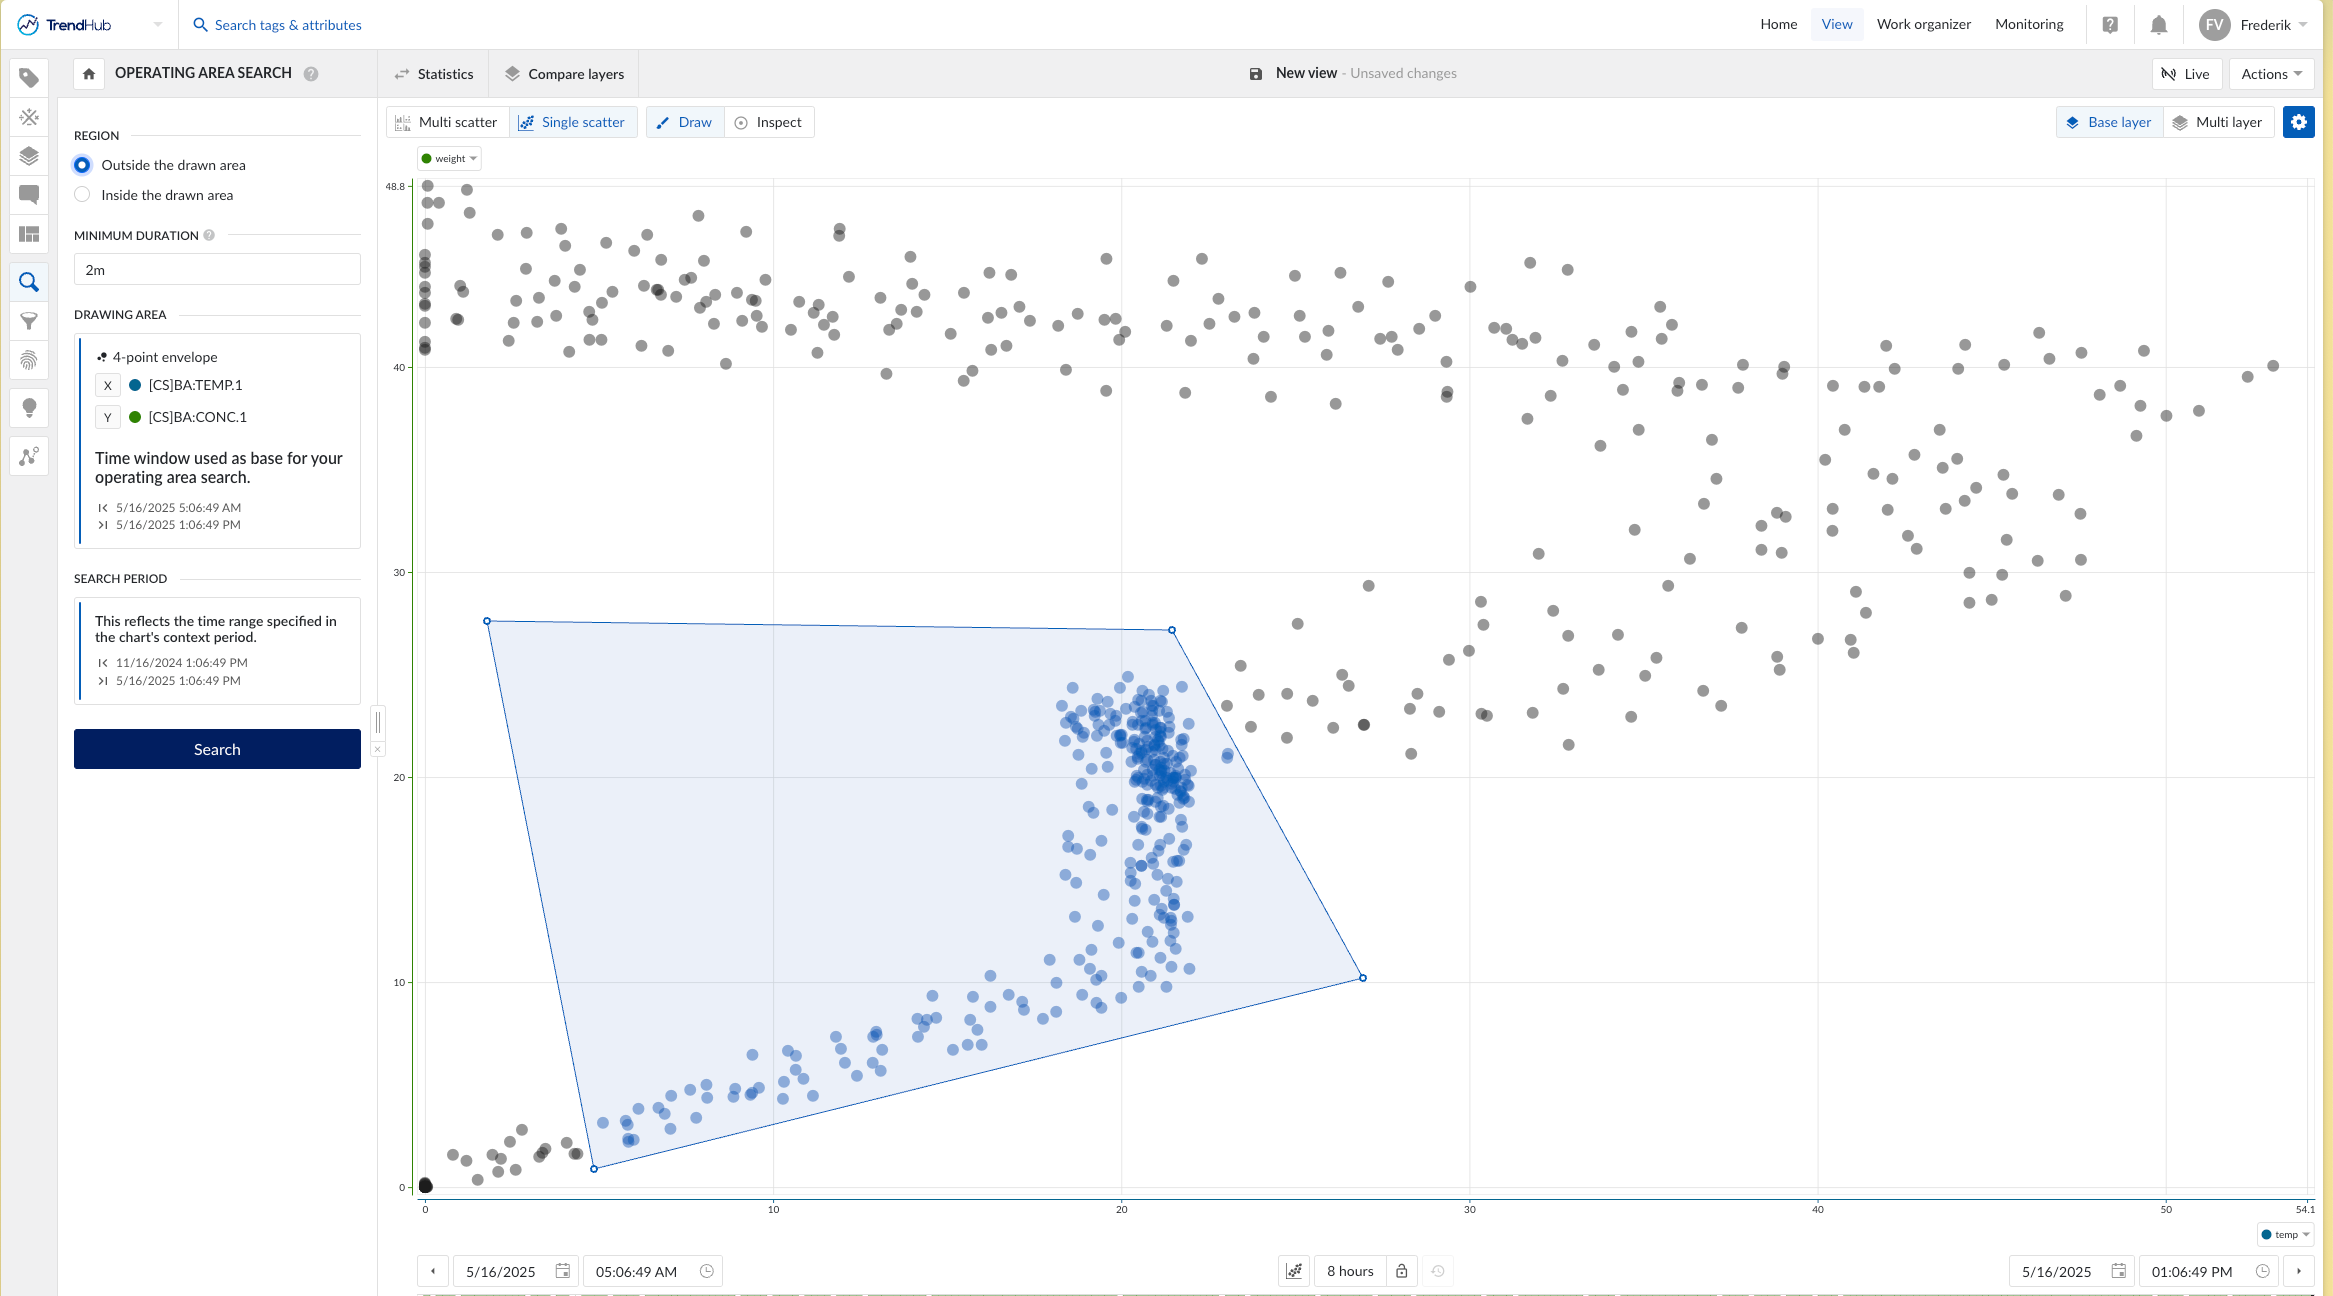
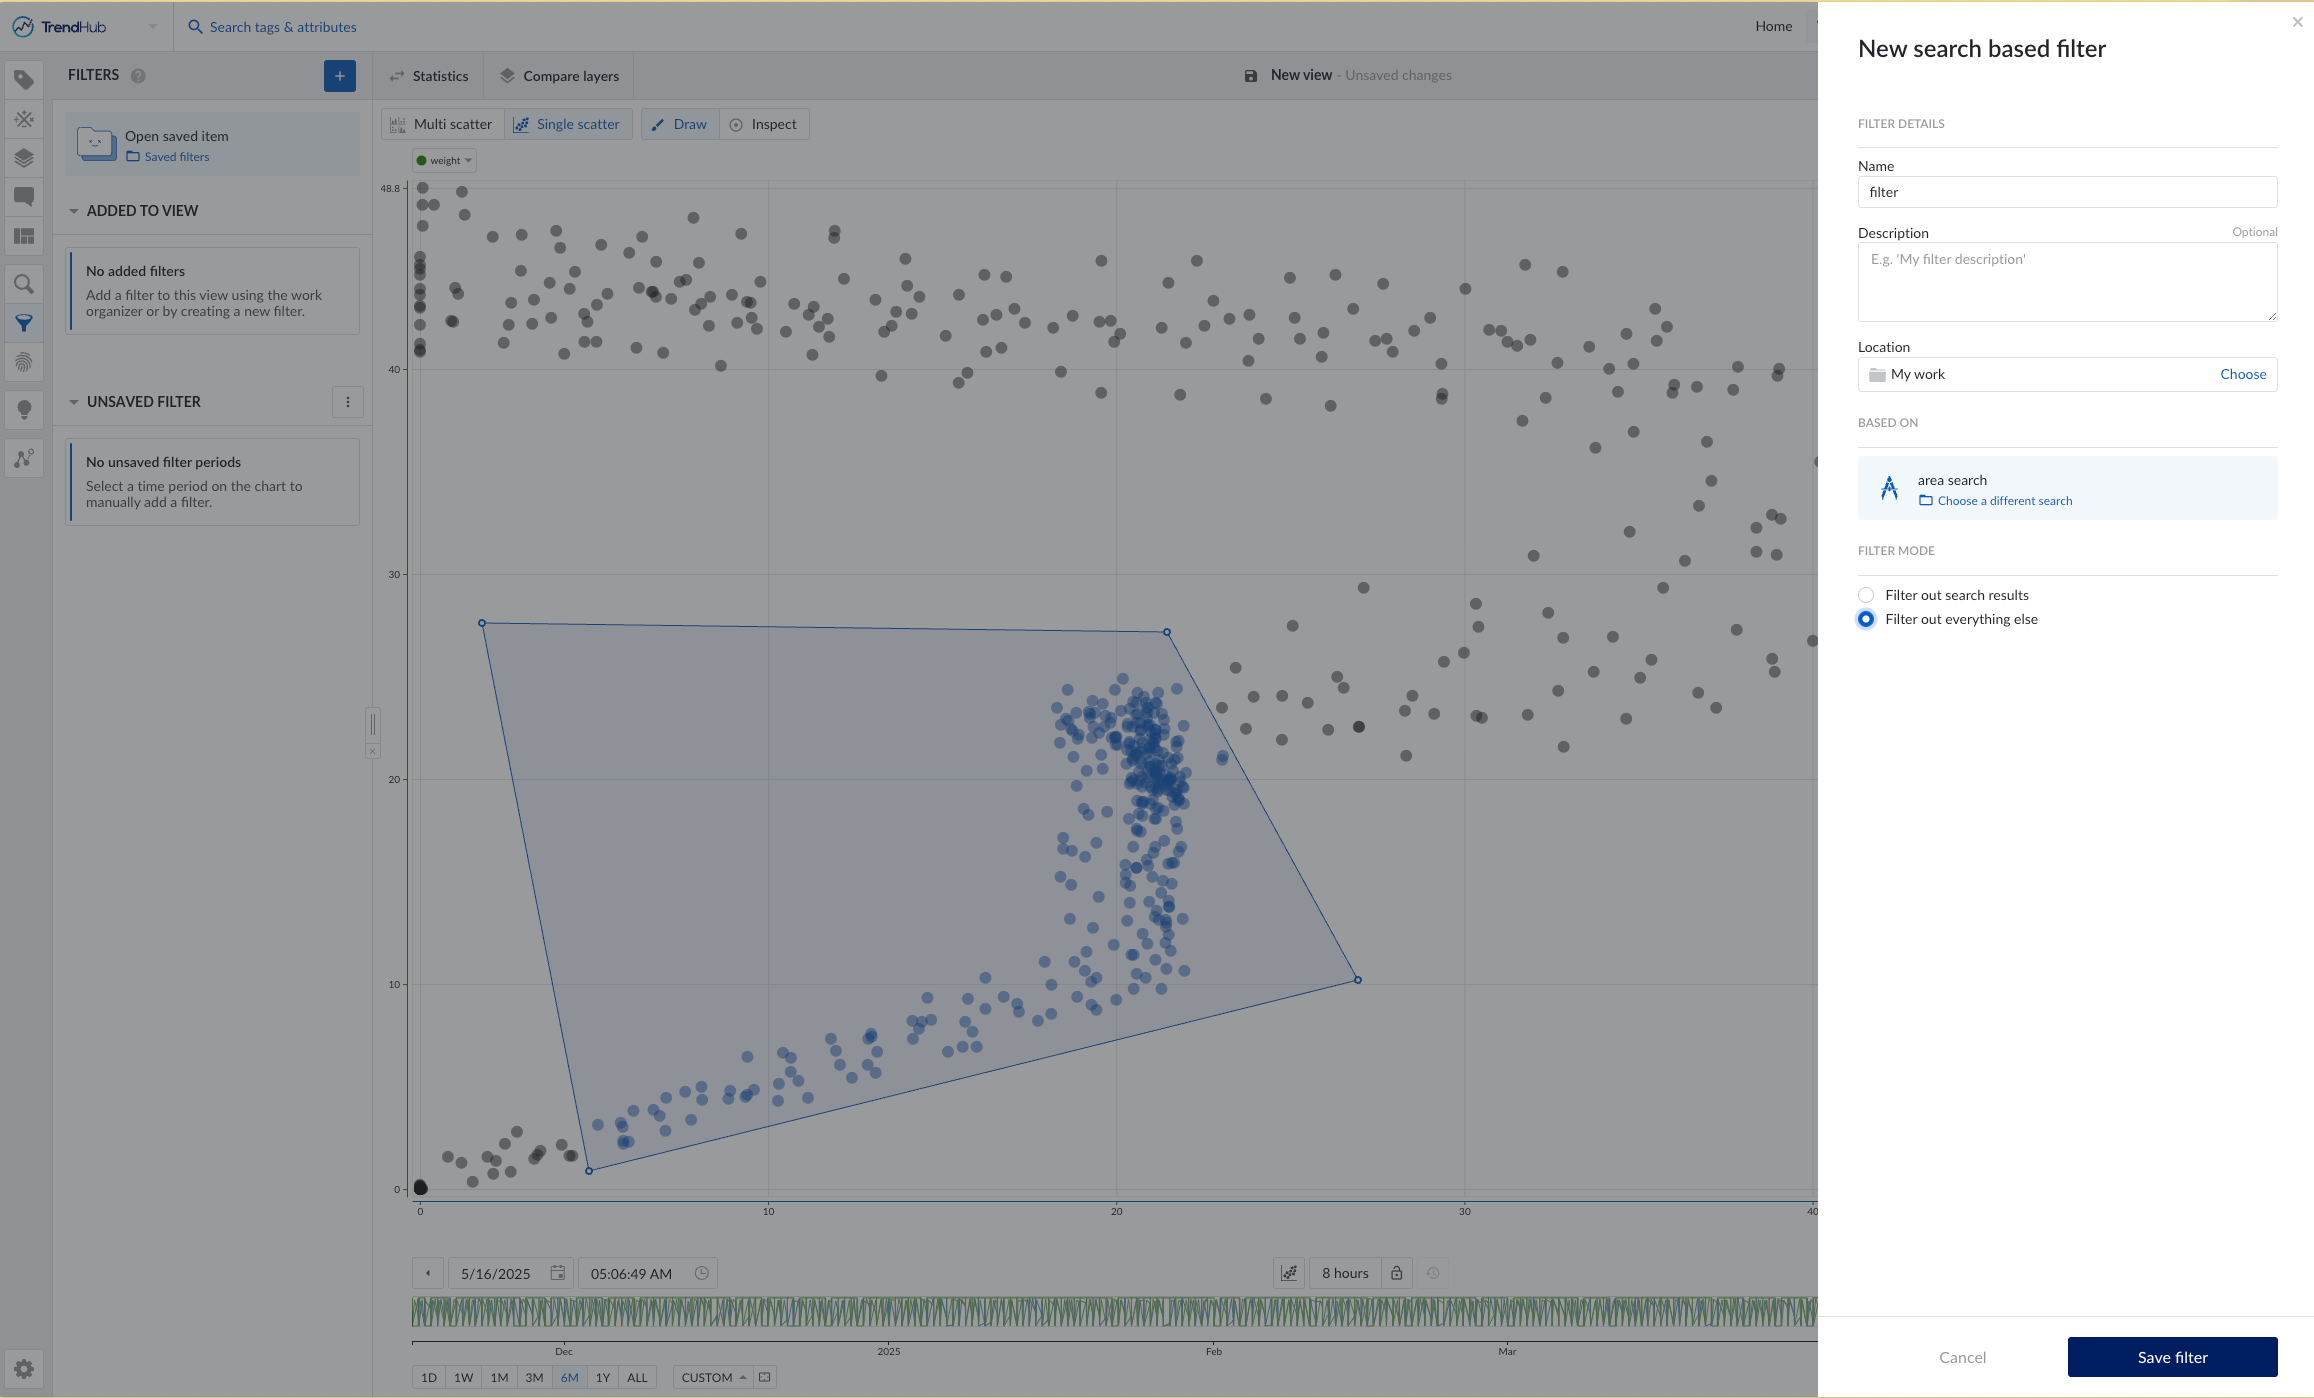
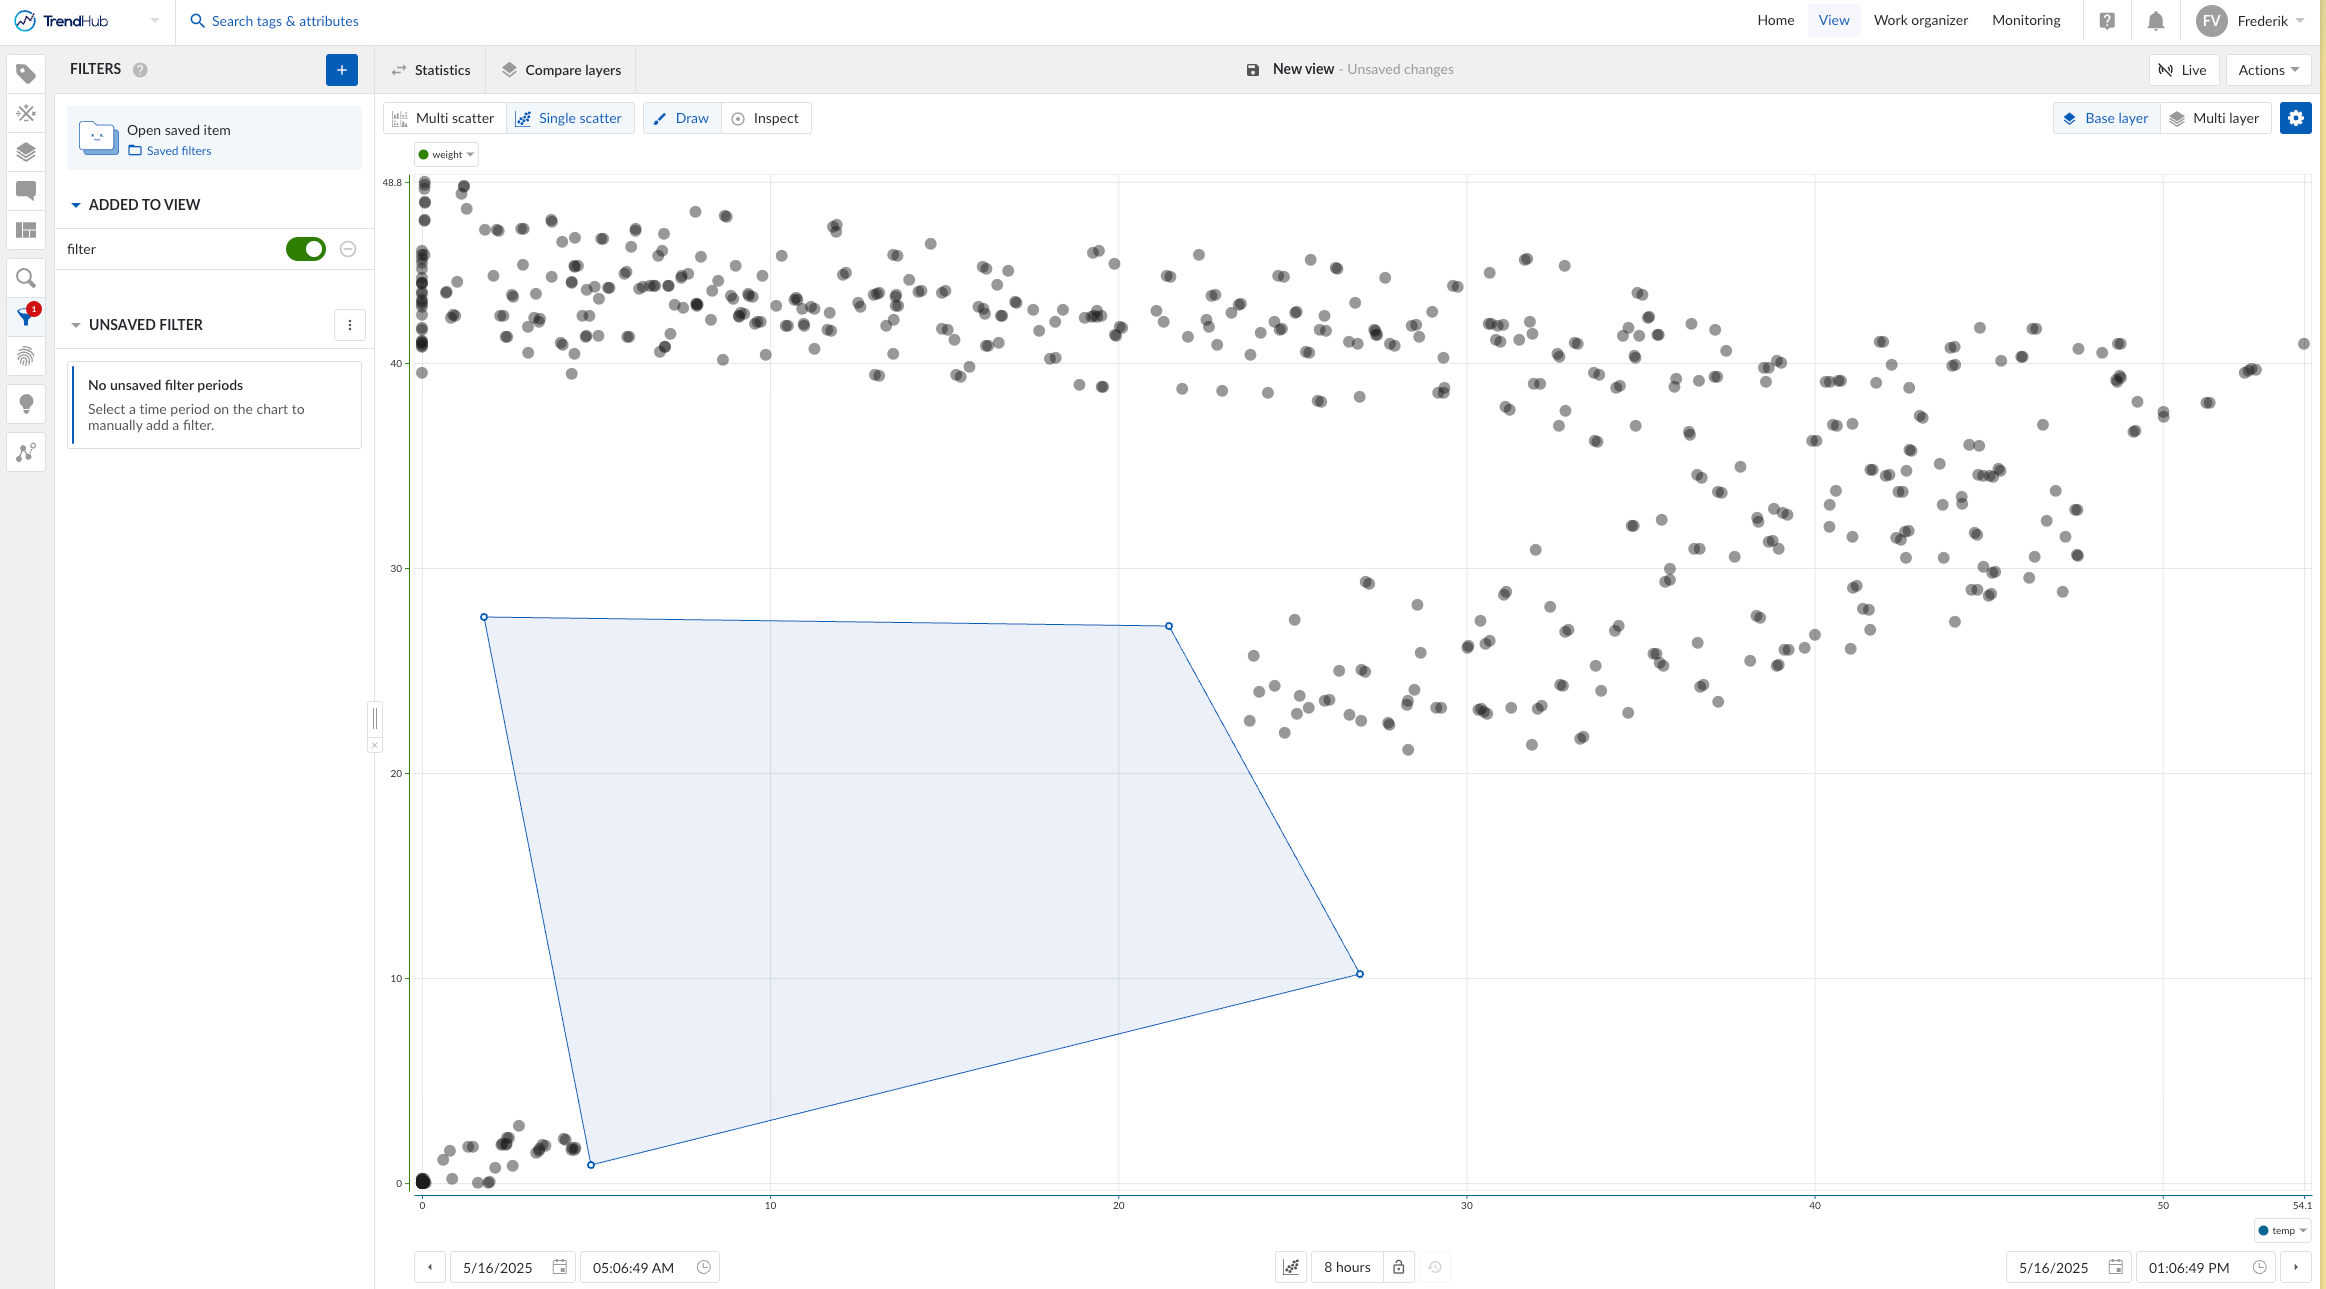
Is it possible to filter by data points and not display the interpolated data in a scatter plot?

Hi Jörg,

It is possible to filter by data points in the scatter plot.
When you are in the scatter plot you click on the draw button and draw and area around the points you want to filter out.
 

Next you go to the search menu and you click on create new Operating Area Search, in the area search you select the Region outside the drawn area. You then execute the search and save it.

Next you open the filter menu (located just bellow the search menu button) and you click on the blue plus button to create a new filter. You give the filter a name, you select your search that you just created in the Based On section and select the Filter out everything else option.

By saving the filter you will be able to filter out all the datapoints that are in your selected area as you can see in the image bellow.

I hope this solved your question!

Frederik


Not quite what I meant. Nevertheless, thank you very much for the response. I have an analytical measurement that is uploaded as a data point approximately every 10 hours. In between, it seems to be linearly interpolated. My measurement, with which I want to compare the analytical data, is uploaded every minute. So I have way too many data points that do not correlate with my interpolated data. I would then like to have only 3 value pairs for 30 hours.


Hi Jörg,

Unfortunately this is not yet possible in TrendMiner at the moment, however we are constantly improving, so it would be very valuable to us if you would log this as a product idea.
Our product team will take this feedback into account. 

Kind regards
Frederik


Reply