We have a continuous process with around 50 product types.
For all of those product types I have different KPI’s e.g. for steam consumption / steam flow.
Which trendminer feature is able to compare current consumption at product type xy vs. standard consumption at the same product type? I would like to have a Dashboard showing standard consumption vs. current consumption and a green, yellow, red flag (depending on %-value of lower / higher consumption vs. standard).
I have a list of product types and corresponding standard consumptions, but I do not know how to use as a comparison reference.
Thanks for your help
Best answer by fvandael
Hi @RingeFan,
This is a very interesting use case! It can be solved by creating two formula tags and a dashboard.
I’ve recreated your scenario using the TM4-BP2 demo tags, so you can easily replicate the entire workflow in your own environment.
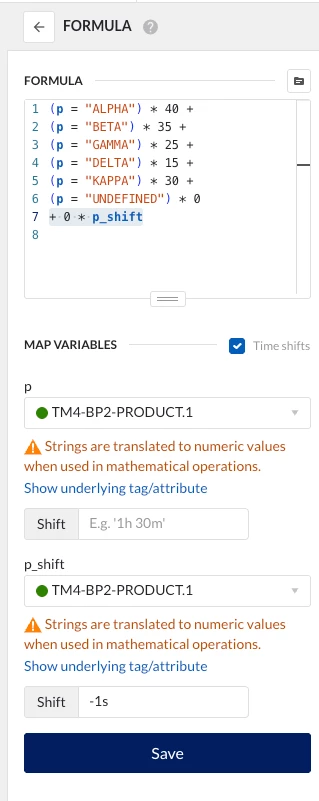
Step 1: Create the standard consumption formula tag
First, we’ll create a formula tag that calculates the standard consumption based on the current product type.
To do this, we check whether your product tag p equals a specific product type.
This check returns either 0 or 1, which we then multiply by the standard consumption value for that product type.
The result is a single standard consumption value corresponding to the current product type.
Example formula (with made up standard consumptions):
Since you have 50 product types, this can be quite time-consuming.
However, if you’re allowed to use Copilot, you can provide a few examples and ask it to automatically complete the formula based on your list of product types and standard consumptions.
At the end of your formula tag, add the following line — where p_shift is your product tag shifted by -1 second:
+ 0 * p_shift
This ensures your standard consumption tag is displayed as stepped rather than continuous.
You can find more details about this technique in the article:
The completed tag setup looks like this:
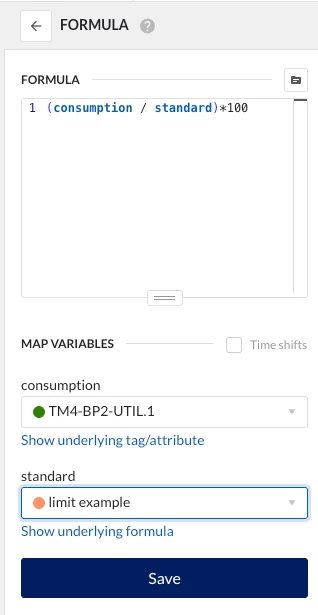
Step 2: Create the percentage comparison formula tag
Now that we have our standard consumption tag, we can create a second formula tag to display the percentage difference between the actual and standard consumption values.
Formula:
(consumption / standard) * 100
Variables:
consumption → your actual consumption tag
standard → the standard consumption tag created in Step 1
This will give you a dynamic percentage value showing whether your current consumption is above or below the standard.
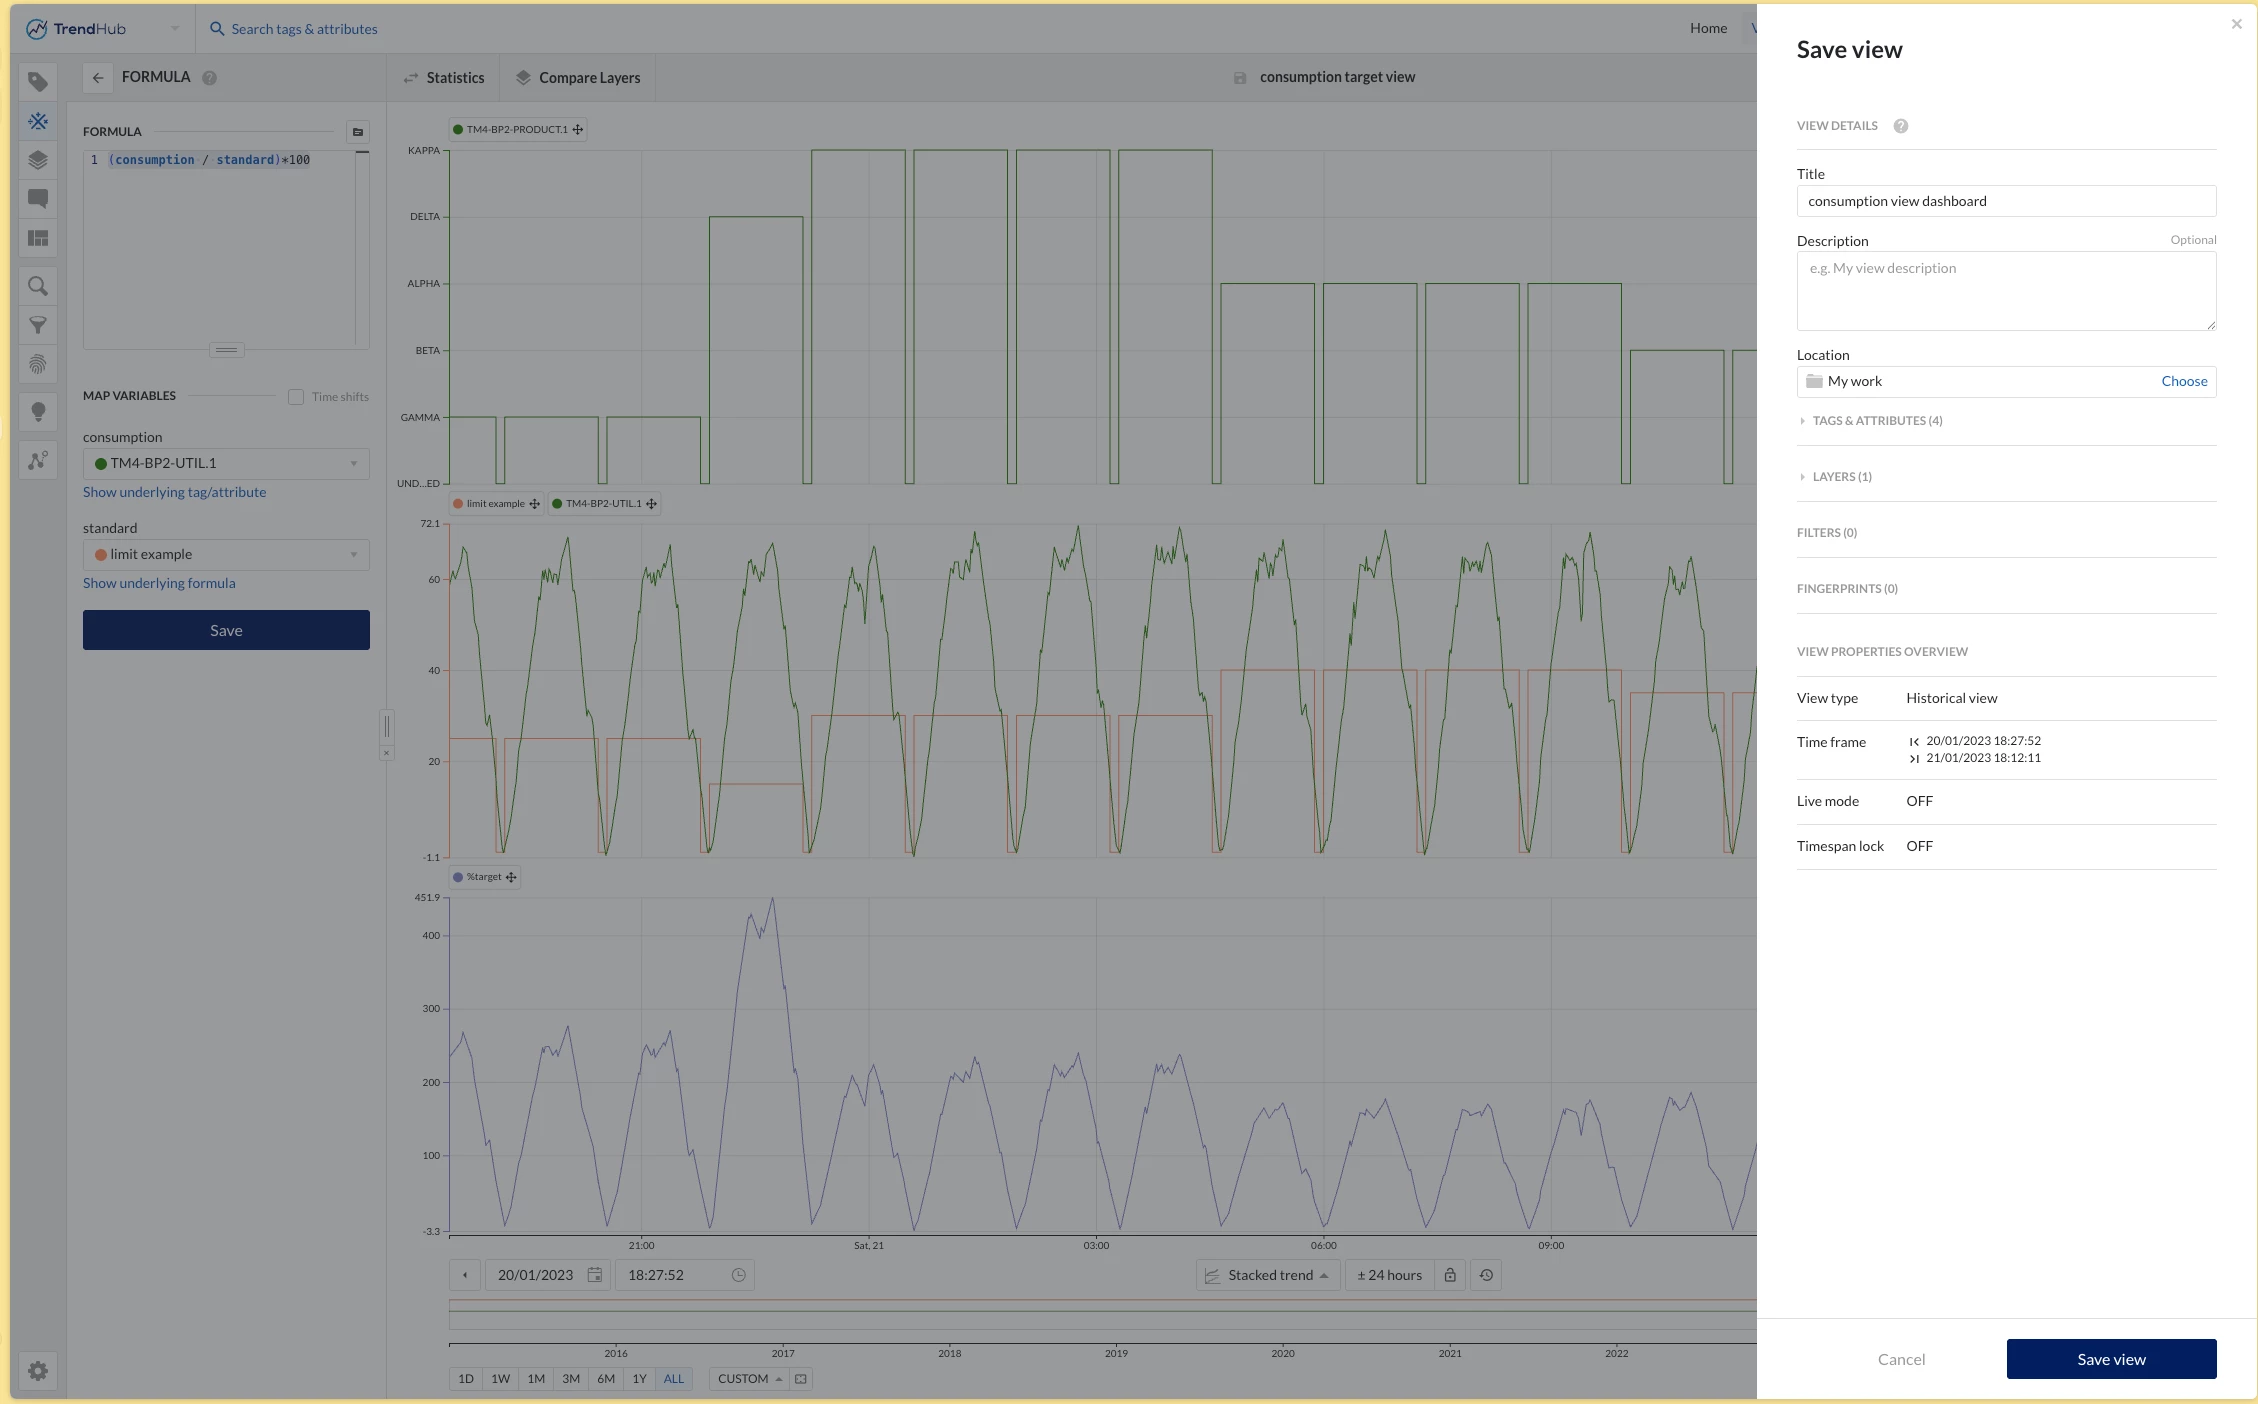
Step 3: Visualize the results in TrendHub
This setup results in the following TrendHub view, showing:
the standard consumption tag,
the actual consumption, and
the % target tag.
You can now save this view and add it directly to your dashboard.
Tip:
Enable Live Mode and lock the duration of your view to always display the last x amount of time on your dashboard — ensuring real-time visibility of performance.
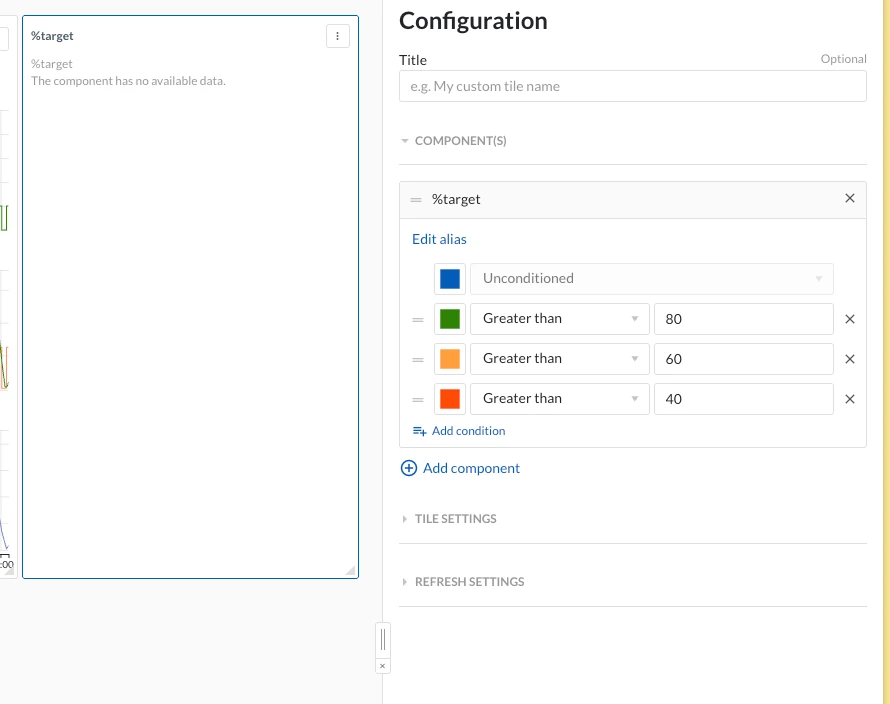
Step 4: Build the final dashboard
Next, create your final dashboard by:
Adding a TrendHub View tile using the saved view from Step 3.
Adding a Current Value tile for the % target tag, with conditional formatting applied (as shown in the image below).
This results in a dashboard that clearly displays your standard consumption vs. current consumption, along with a green/yellow/red indicator based on the percentage deviation from the standard.
If you have any other use cases you’re trying to solve, or if you run into any questions, we’re always happy to help!
Since you have 50 product types, this can be quite time-consuming.
However, if you’re allowed to use Copilot, you can provide a few examples and ask it to automatically complete the formula based on your list of product types and standard consumptions.
At the end of your formula tag, add the following line — where p_shift is your product tag shifted by -1 second:
+ 0 * p_shift
This ensures your standard consumption tag is displayed as stepped rather than continuous.
You can find more details about this technique in the article:
The completed tag setup looks like this:
Step 2: Create the percentage comparison formula tag
Now that we have our standard consumption tag, we can create a second formula tag to display the percentage difference between the actual and standard consumption values.
Formula:
(consumption / standard) * 100
Variables:
consumption → your actual consumption tag
standard → the standard consumption tag created in Step 1
This will give you a dynamic percentage value showing whether your current consumption is above or below the standard.
Step 3: Visualize the results in TrendHub
This setup results in the following TrendHub view, showing:
the standard consumption tag,
the actual consumption, and
the % target tag.
You can now save this view and add it directly to your dashboard.
Tip:
Enable Live Mode and lock the duration of your view to always display the last x amount of time on your dashboard — ensuring real-time visibility of performance.
Step 4: Build the final dashboard
Next, create your final dashboard by:
Adding a TrendHub View tile using the saved view from Step 3.
Adding a Current Value tile for the % target tag, with conditional formatting applied (as shown in the image below).
This results in a dashboard that clearly displays your standard consumption vs. current consumption, along with a green/yellow/red indicator based on the percentage deviation from the standard.
If you have any other use cases you’re trying to solve, or if you run into any questions, we’re always happy to help!