Solved

Monitoring low level dashboards from a high level dashboard

  • December 17, 2025
  • 3 replies
  • 144 views

Hello,

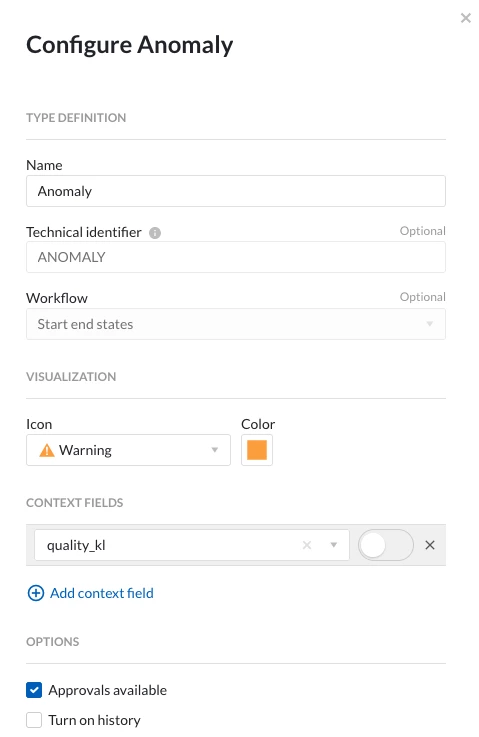
I am currently developing a dashboard to monitor the nitrogen consumption of our production lines. Each line consists of several machines connected to nitrogen tanks, and we have flow measurement devices for each machine. I have defined two types of anomalies for these machines:

  1. Nitrogen consumption when idle: to detect unintended leaks.
  2. Nitrogen overconsumption when running: to detect deviations from normal flow.

For this purpose, I have included two surveillance tiles for each machine in the line-specific dashboard. However, my goal is to create a high-level dashboard that provides an overview of all lines, showing if there is an issue with any particular line. From there, users could click a link to access the detailed dashboard for that line.

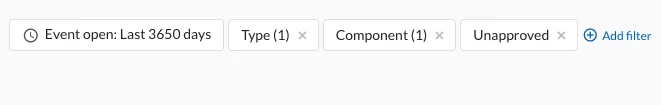
My question is: Is it possible to monitor from the general dashboard whether anomalies are occurring on the lower-level dashboards? The searches I use for the detailed dashboards are based on conditions like “over X value during Y minutes,” and these vary by machine. Therefore, I cannot simply replicate the same logic for multiple machines and combine them into one tile.

I considered using a context item search, but surveillance tiles do not seem to allow these types of searches to trigger an alarm, so that approach does not work. Do you know if what I am trying to achieve can be done with the current tools available?

Thank you for your help.

Best answer by Wouter Daniels

Interesting use case!

I see a few options here to create a higher level overview of the machines. One option would be to let the anomaly monitors create context items for each anomaly that is detected. Your overview could then be a list (or Gantt chart) of when an anomaly occurred and on which machine. It could be configured that you can approve the anomalies, moving them from one list (inbox) to the other (archive), leaving you with a clear overview of open issues. Unfortunately there would not be a way to link the context item directly to the lower level dashboard. A user would have to navigate there manually, or perhaps click a link on a text tile that is added to the higher level dashboard.

If the goal is really to have a traffic-light dashboard with the current states, and there can only be a single monitor status tile per asset, probably the best course of action is to try and capture multiple conditions into a single formula tag that gives a value of 1 or 0. For example:

or(and(flow > 10, status="ON"), and(flow > 0.1, status="OFF"))

This would give you a single tag to monitor on, which can be used for a single tile that monitors multiple conditions. This does not work if you need to monitor for different durations for the multiple conditions. In such a case a more complex setup where min/max aggregations are used as duration conditions might still be possible (for example, if the 1h minimum of flow is >10, this means the flow is >10 for at least 1h).

Hope one of these works for your use case. If not, let us know why and we can look into alternatives.

Wouter

3 replies

Wouter Daniels
Employee
Forum|alt.badge.img
  • Employee
  • Answer
  • December 23, 2025

Interesting use case!

I see a few options here to create a higher level overview of the machines. One option would be to let the anomaly monitors create context items for each anomaly that is detected. Your overview could then be a list (or Gantt chart) of when an anomaly occurred and on which machine. It could be configured that you can approve the anomalies, moving them from one list (inbox) to the other (archive), leaving you with a clear overview of open issues. Unfortunately there would not be a way to link the context item directly to the lower level dashboard. A user would have to navigate there manually, or perhaps click a link on a text tile that is added to the higher level dashboard.

If the goal is really to have a traffic-light dashboard with the current states, and there can only be a single monitor status tile per asset, probably the best course of action is to try and capture multiple conditions into a single formula tag that gives a value of 1 or 0. For example:

or(and(flow > 10, status="ON"), and(flow > 0.1, status="OFF"))

This would give you a single tag to monitor on, which can be used for a single tile that monitors multiple conditions. This does not work if you need to monitor for different durations for the multiple conditions. In such a case a more complex setup where min/max aggregations are used as duration conditions might still be possible (for example, if the 1h minimum of flow is >10, this means the flow is >10 for at least 1h).

Hope one of these works for your use case. If not, let us know why and we can look into alternatives.

Wouter


Hi Wouter, 

Thanks for your reply! 

Indeed, the challenge is that I implemented different durations for the conditions. For example, overconsumption while running has a lower time detection than leaks while the production line is stopped. This is because I did not want to have false alerts due to the calibration of the sensors or whatsoever. 

Since these anomalies are very rare and do not occur that often, maybe it is not worth it to create a complex logic and do as you said:  to have a context view of the events that had happened, and moving them to a different context view. How would this be achieved? For example, by changing the key words of the context items such that one context view shows the items with “Non-reviewed” and the other shows the items with “Reviewed”? In that way, we can make sure we don’t miss any anomaly.

Thanks again for your reply!


Wouter Daniels
Employee
Forum|alt.badge.img

Hi Manuel,

Keywords would work, but is a little bit cumbersome because you would always have to type to add the keyword and remember to remove the old keyword. There is a lot of room for error there.


My preferred way would be to activate approvals on the context type that is created bye the monitors. This is only possible with application admin rights, so you would need those or have to ask a colleague which has those.


While you are at it, it might could make sense to add a field with the anomaly condition as well, which could be 'Idle consumption' or 'overconsumption' in your case. In fact the creation of a specific context type (perhaps 'nitrogen anomaly'?) would be ideal to avoid confusing other users which might be using the default Anomaly type (or another existing type you are using).

The setup would then be that each monitor creates context items with the 'anomaly condition' field filled in based on its configuration, with an asset or tag associated with the corresponding machine or tank. The newly created items would be unapproved by default.

You would then create view a view with all unapproved items of your type, which gives an overview of all unchecked anomalies on all assets. You could then also make more specific ContextHub views per asset by including a component filter. These lower level ContextHub views could go into the lower level dashboards. They could also be used to display a count of open anomalies per asset on the higher level dashboard.

By adding the approvals to the type, you can now simply click the 'approve' button when you are done inspecting (and potentially describing or labelling) the anomaly.


Because of the approval filter, the item will then disappear from the 'unapproved items' view, and potentially appear in an archive of handled anomalies in a different view that you have created. The nice thing about the approvals is that it keeps a log of who approved an item when. Also, when the item is edited, this will remove all existing approvals (a warning for this is shown first, so it needs to be an explicit decision).


Wouter