Hello 👋
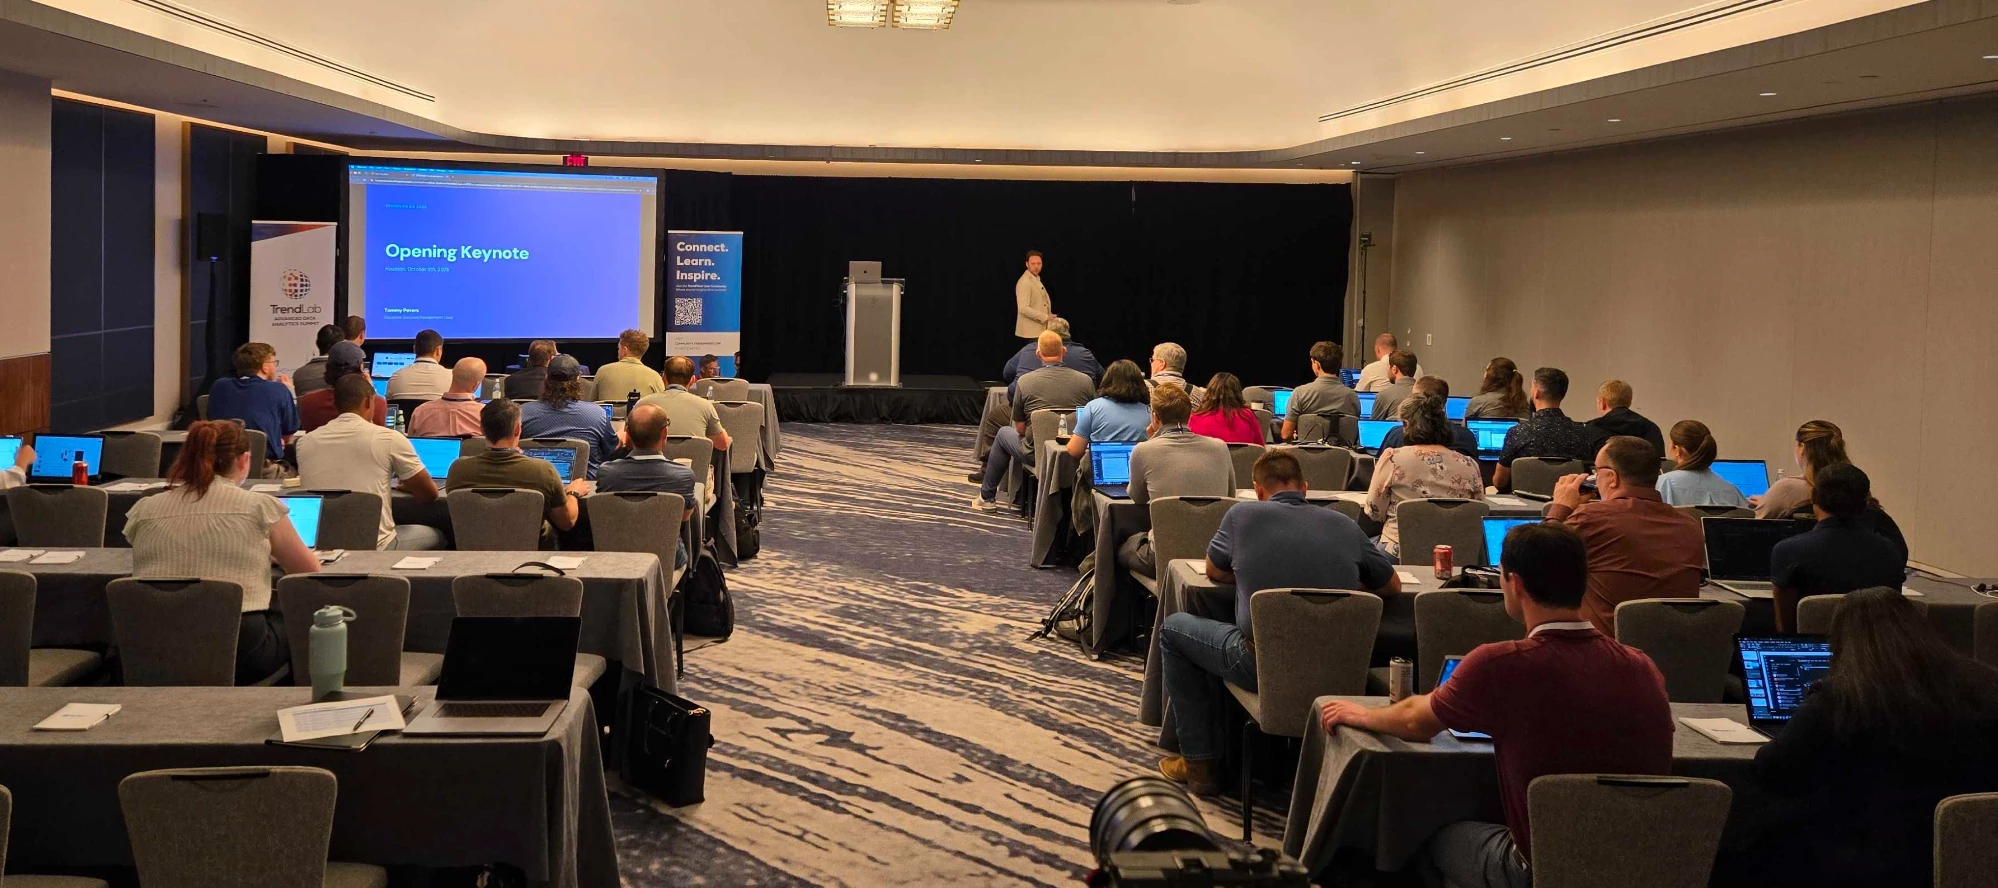
Here's a short recap of some of the customer sessions at TrendLab 2026 in Houston. The presentation slides are attached for a closer look.
Monument Chemical integrated tank inventory and lab data into TrendMiner. Layer comparisons showed that most of an unwanted impurity came at the start of distillation runs, so a higher-purity customer request was met with only slightly more column time. Comparing catalyst activation runs helped cut the time to the first on-spec tank from 21 days to 8.
👉 Check the slides here.
Martin Marietta rolled out TrendMiner across network-segregated sites with hands-on training. On its kilns, filtering isolates burning cycles for fair comparisons, and similarity search plus diagnosis traced secondary air temperature spikes to their root cause, reducing temperature variability by 27%. Monitors now send downtime alerts to the right teams automatically.
👉 Check the slides here: Presentation 1 & Presentation 2
Huntsman built soft sensors from drum level data and a mass balance to estimate solvent loss where the flow meter couldn't be trusted, then used them for KPIs, alerts and root cause analysis. ContextHub turns DCS phase-step data into Gantt views that flag batch steps running longer than standard.
👉 Check the slides here.
Zschimmer & Schwarz built step timers, plant and reactor dashboards, and automatic batch step times in ContextHub, replacing manual Excel logging. A golden batch fingerprint showed one long cycle came from an extended reflux step.
👉 Check the slides here.
BASF started from three problems: complicated tracking systems, no way to flag outliers, and cost data that arrived late. They built a real-time cost dashboard on SAP data that flags cost spikes by area, alongside steam utility trends, using formulas, historical vs. live views, conditional formatting and alerts. The impact was real-time cost visibility, a shared understanding of utility usage, support during hurricane operations, and more leadership and cross-department awareness of what TrendMiner can do.
👉 Check the slides here.
LyondellBasell combined fluid dynamics with TrendMiner to monitor cycle gas cooler fouling, converting pressure drop into a "percent area clean" indicator and turning compressor curves into daily trends that show increasing system resistance.
👉 Check the slides here.
Have you tackled a similar challenge with TrendMiner? Share your approach in the comments.👇

TrendLab 2026 NAM Recap: Customer Presentation Slides



Login to the community
No account yet? Create an account
Enter your E-mail address. We'll send you an e-mail with instructions to reset your password.