On Confighub you can view Metrics of a datasource. But:
- What do these actually mean?
- What are reasonable values?
- What is the difference between the two columns?
- Over what time are these captured? (are these reset at some time?)
Example:

On Confighub you can view Metrics of a datasource. But:
Example:
Best answer by Stijn Agten
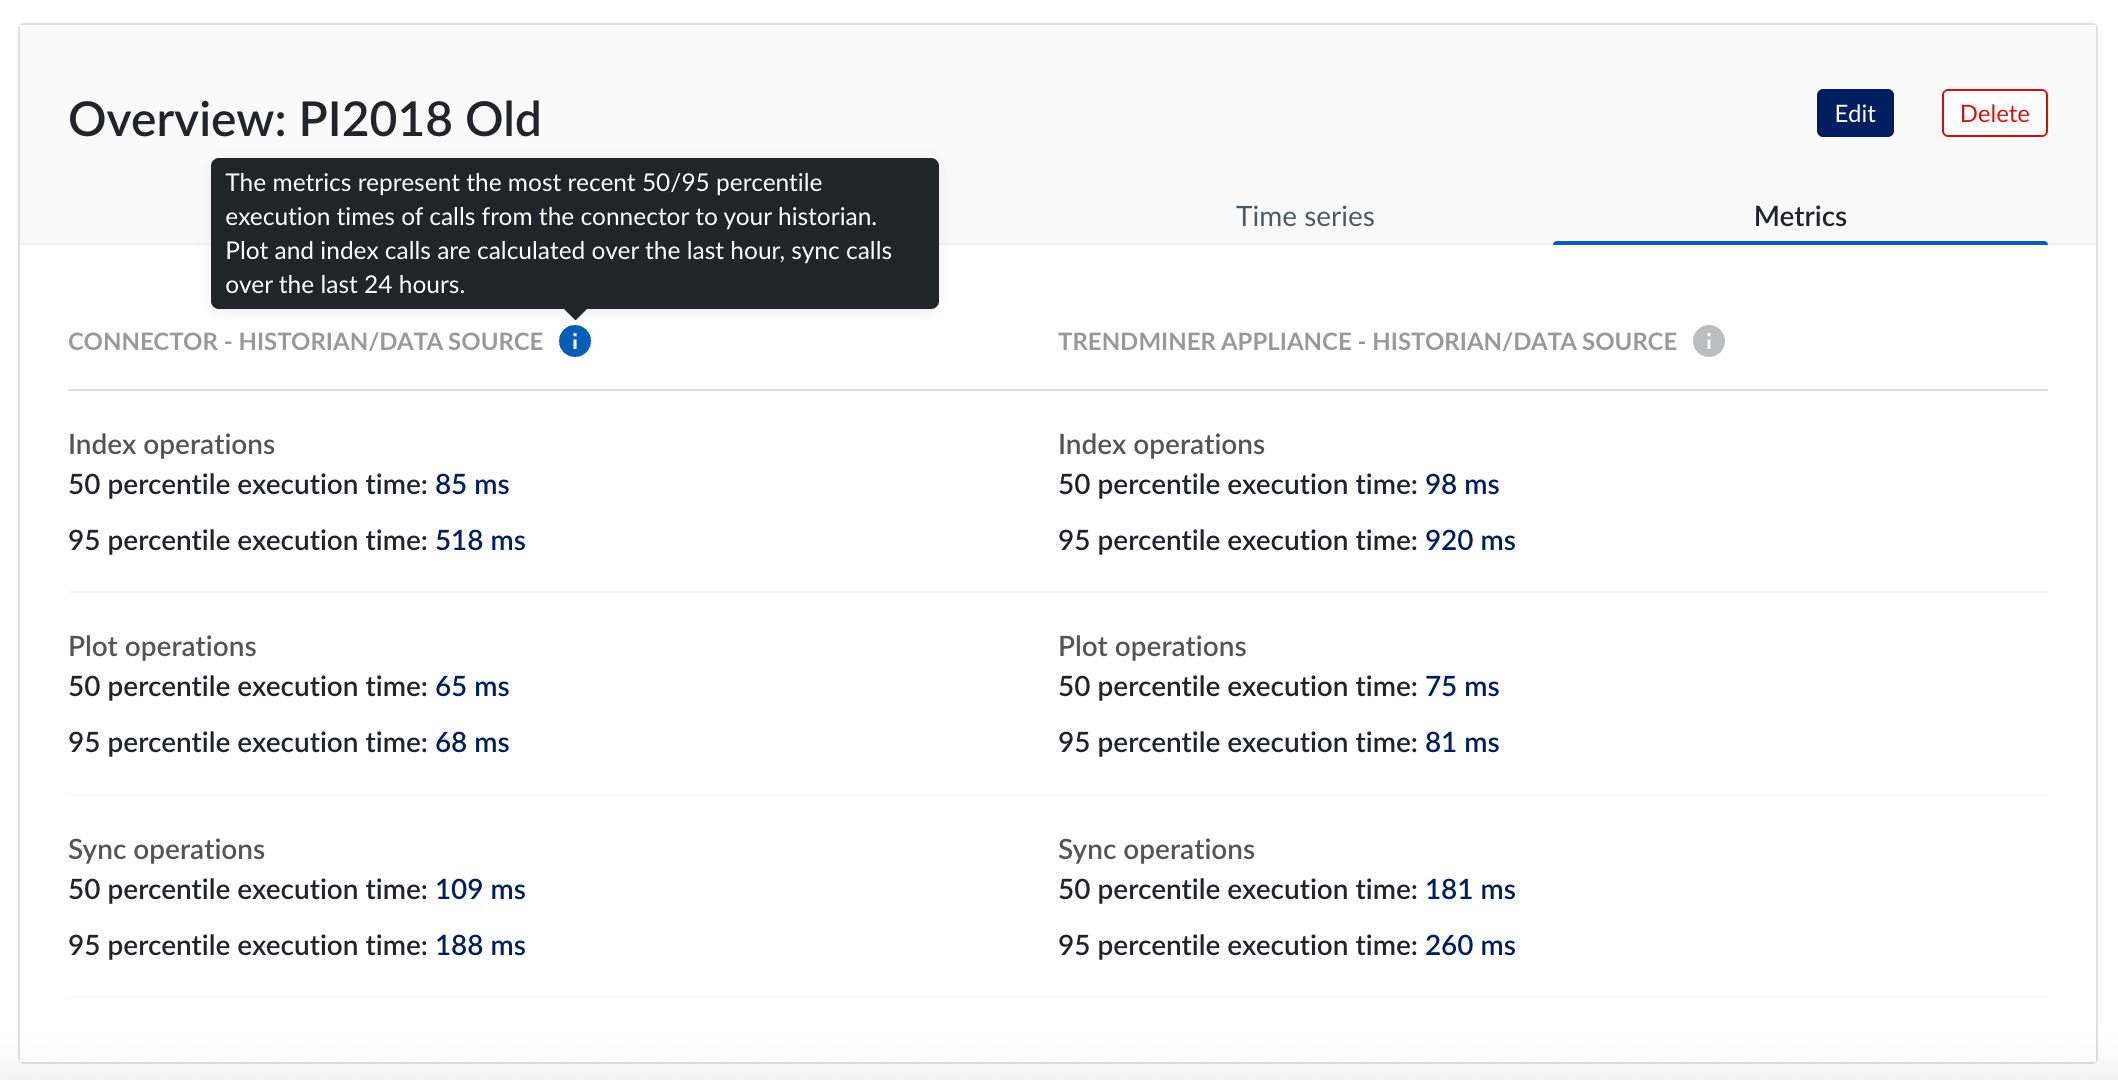
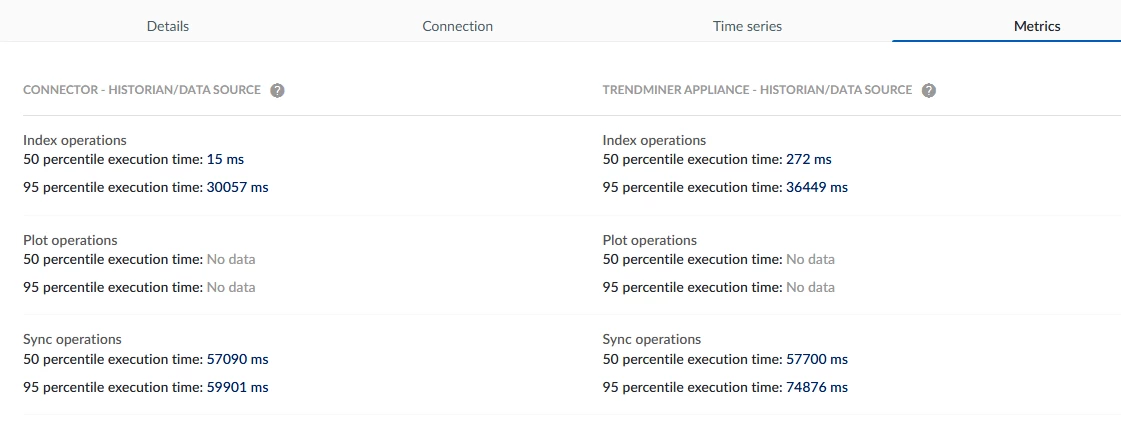
When you hover over the information icons in the title you can see the following tooltips:
The timings are split up between:
Q: what are reasonable values?
A: this depends on the requested time frame. The metrics do not distinct between small timeframes (e.g. 1 hour) or large timeframes (e.g. 1 month) but of course the timings might differ significantly. But overall we consider a good value to be under 1 second (for plot and index calls). Timings up to a few seconds are acceptable but timings above 10s could indicate performance issues. TrendMiner has some configuration options to mitigate the impact of a slow data source or to improve performance by tweaking the connection parameters but this depends on the type of data source. For deeper investigation reach out to support via support@trendminer.com
Q: Over what time are these captured? (are these reset at some time?)
A: these timings (plot and index calls) are covering a rolling window of 1 hour so they only represent the last hour. If an optimization is done it can take up to an hour before the full result is visible in the metrics screen.
No account yet? Create an account
Enter your E-mail address. We'll send you an e-mail with instructions to reset your password.
