I am making this post to create some more awareness about the upcoming Solution Training at TrendLab 2025.
In this workshop aimed towards more experienced TrendMiner users, you will learn to use TrendMiner as a platform for building custom solution packages. Throughout the training, you will follow our solutions approach to set up Overall Equipment Effectiveness (OEE) KPI reporting on one of your own batch or continuous processes. Our team of TrendMiner experts will then guide you through the steps of:
Capturing production events (batches, operating periods, …) with a monitor in TrendMiner, and collecting them as context items in a ContextHub view
Setting up a Python function that loads the context items from this ContextHub view, and writes loss data to their context fields
Capturing regular periods (weeks, months, etc.) as context items with another monitor
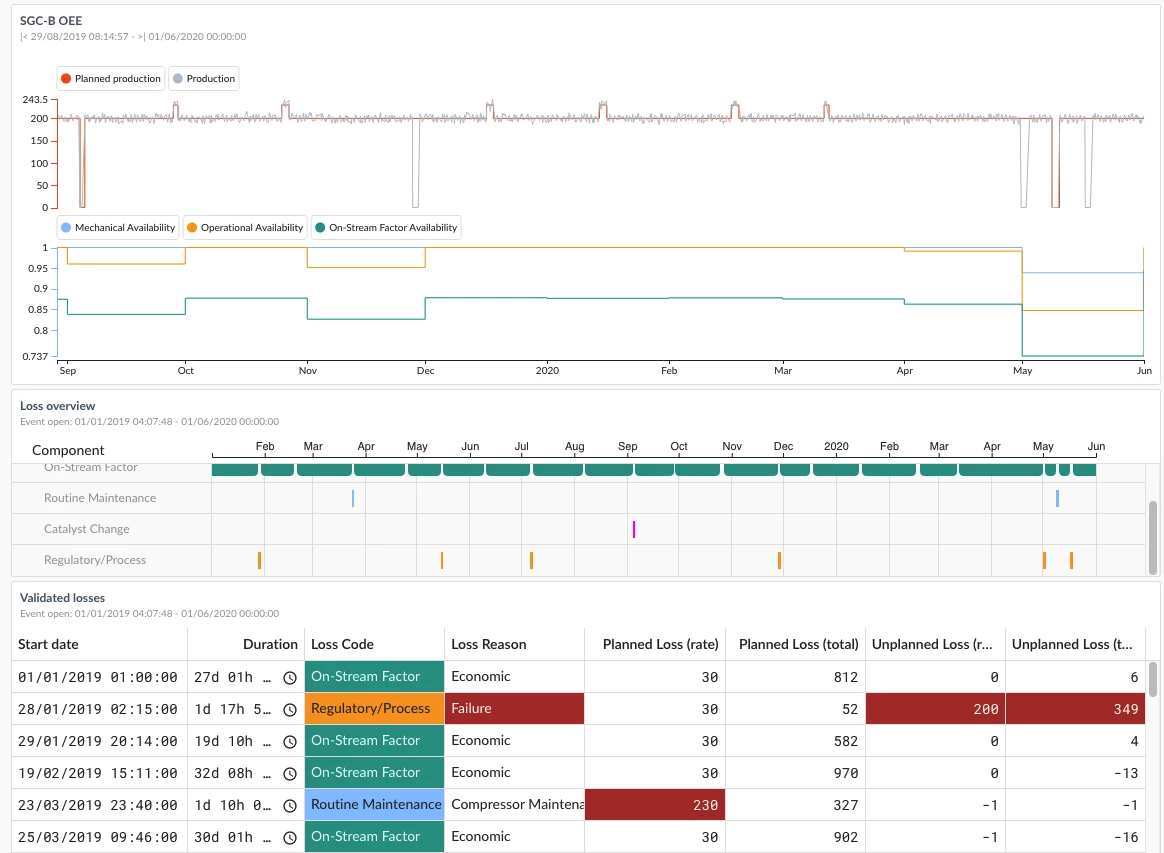
Setting up a second Python function which calculates the availability, productivity, quality and OEE parameters for these regular period context items, and writes them to their context fields. This function will use the data of production events captured earlier.
Bringing these enriched items together with other custom visuals into actionable user dashboards
Though the outcome of this workshop will be an automated OEE reporting dashboard for your process, the main focus is to teach you an approach to building solutions that is generally applicable to other processes (energy reporting, batch validation, …)
Rather than being a nice theoretical exercise, this workshop will teach the participants the same steps a TrendMiner Data Analytics Engineer would take when implementing a custom solution at a customer. You can expect tips, tricks and best practices based on years of real-life experience!