

💡 Extending the concept of hourly averages to shorter time intervals
📎 Related post: Calculations of hourly average consumption values
📌 Background
In process industries, consumption monitoring of resources such as steam, water, electricity, and compressed air is key to ensuring energy efficiency and sustainable operations. While hourly averages provide a solid overview, shorter intervals like 30 minutes can deliver even more granular insights—especially for fast-changing processes or detailed performance analysis.
👉 In some cases, half-hourly averages are required for regulatory reporting, for example to comply with environmental or energy-related limits imposed by authorities. Having these values available ensures transparency and compliance.
🎯 Challenge
How can we calculate average consumption values for fixed 30-minute intervals and distinguish them from rolling values? And how can we ensure the values are visualized cleanly as stepwise changes in the trend?
🛠️ Solution
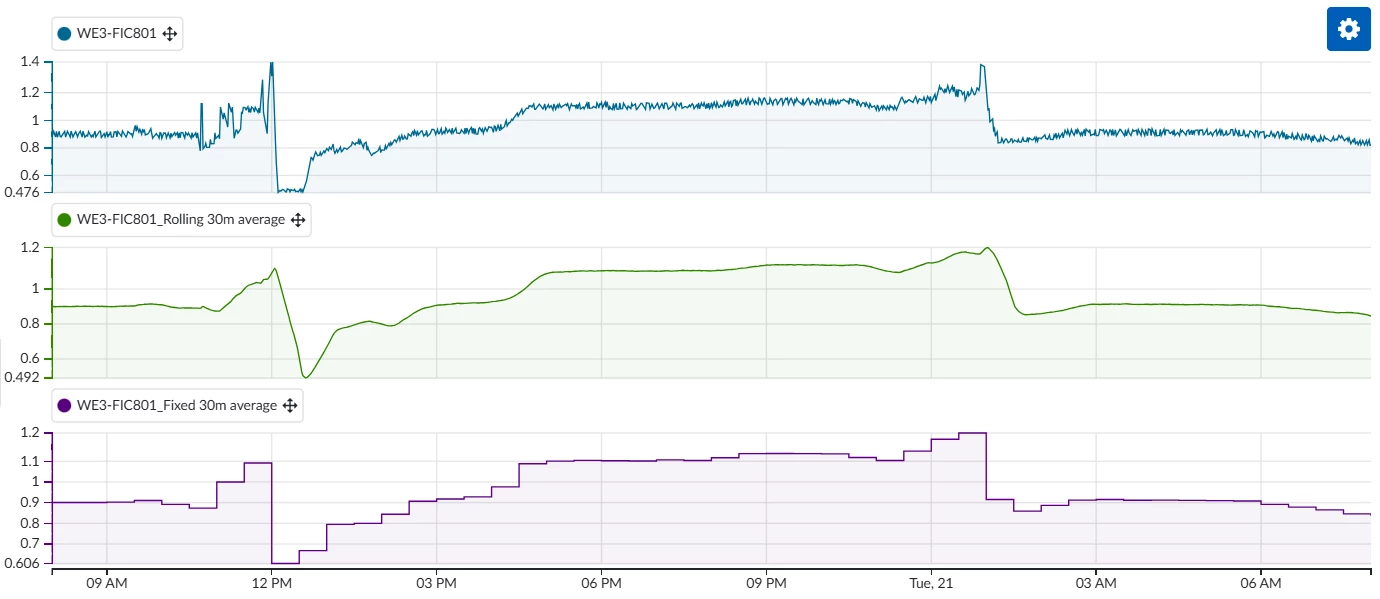
✅ Rolling 30-minute average
This can be done easily using the Aggregation in the Tag Builder:
-
Select your consumption signal (e.g., flow or energy).
-
Choose the average operator.
-
Set the direction to backward.
-
Define a 30-minute aggregation window.
-
Save the new tag.
This tag will always reflect the average of the past 30 minutes at any given time — ideal for real-time monitoring.
⏱️ Fixed 30-minute average
To represent fixed 30-minute average consumption values in a stepwise format (e.g., for regulatory reporting purposes), a custom formula is used in the Tag Builder. This ensures a new value appears precisely at the half-hour mark and remains constant for the next 30 minutes.
The logic builds upon shifted versions of the TM_hour_time zone tag to identify the exact transition points between 30-minute intervals.
🧮 Formula:
if(and(a<>c, a=b), AGGREGATION_1,
if(and(a<>d, a=c, a<>f), AGGREGATION_2,
if(and(a<>e, a=c, a<>g), AGGREGATION_1,
if(and(a<>b, a=c), AGGREGATION_2, sqrt(-1)))))
🔄 Variable Mapping:
- a = TM_hour_time zone
- b = a shifted by +1s
- c = a shifted by -1s
- d = a shifted by +30m 1s
- e = a shifted by +30m
- f = a shifted by -30m
- g = a shifted by -30m 1s
- AGGREGATION_1 = aggregation above
- AGGREGATION_2 = AGGREGATION_1 shifted by -29m 59s
The sqrt(-1) trick is used to enforce interpolation between steps where no fixed value should be shown. The result is a new tag that shows a constant average value for each 30-minute interval, updating exactly at the boundaries.
✅ Value
These new 30-minute tags—both rolling and fixed—offer a powerful way to:
-
Monitor short-term fluctuations.
-
Detect inefficiencies faster.
-
Provide more detailed insights for shift handovers or rapid diagnostics.
-
Integrate into energy dashboards or set smart alerts.
Would you like to try it out? ✨
👉 Share your experiences or ask questions in the comments!