Background
In the chemical industry, calculating e.g. hourly consumption rates of critical resources such as energy, steam, electricity, and others is important. Accurate calculations enable efficient resource utilization and optimal process control. Continuous monitoring of these consumption rates allows for early detection of potential bottlenecks and facilitates proactive measures to enhance efficiency.
Challenge
Consumption can be calculated both as rolling hourly averages and as fixed hourly values. Subsequently, the derived consumption values serve as the foundation for resource utilization monitoring, identifying efficiency potentials, and implementing targeted measures for process optimization.
Solution
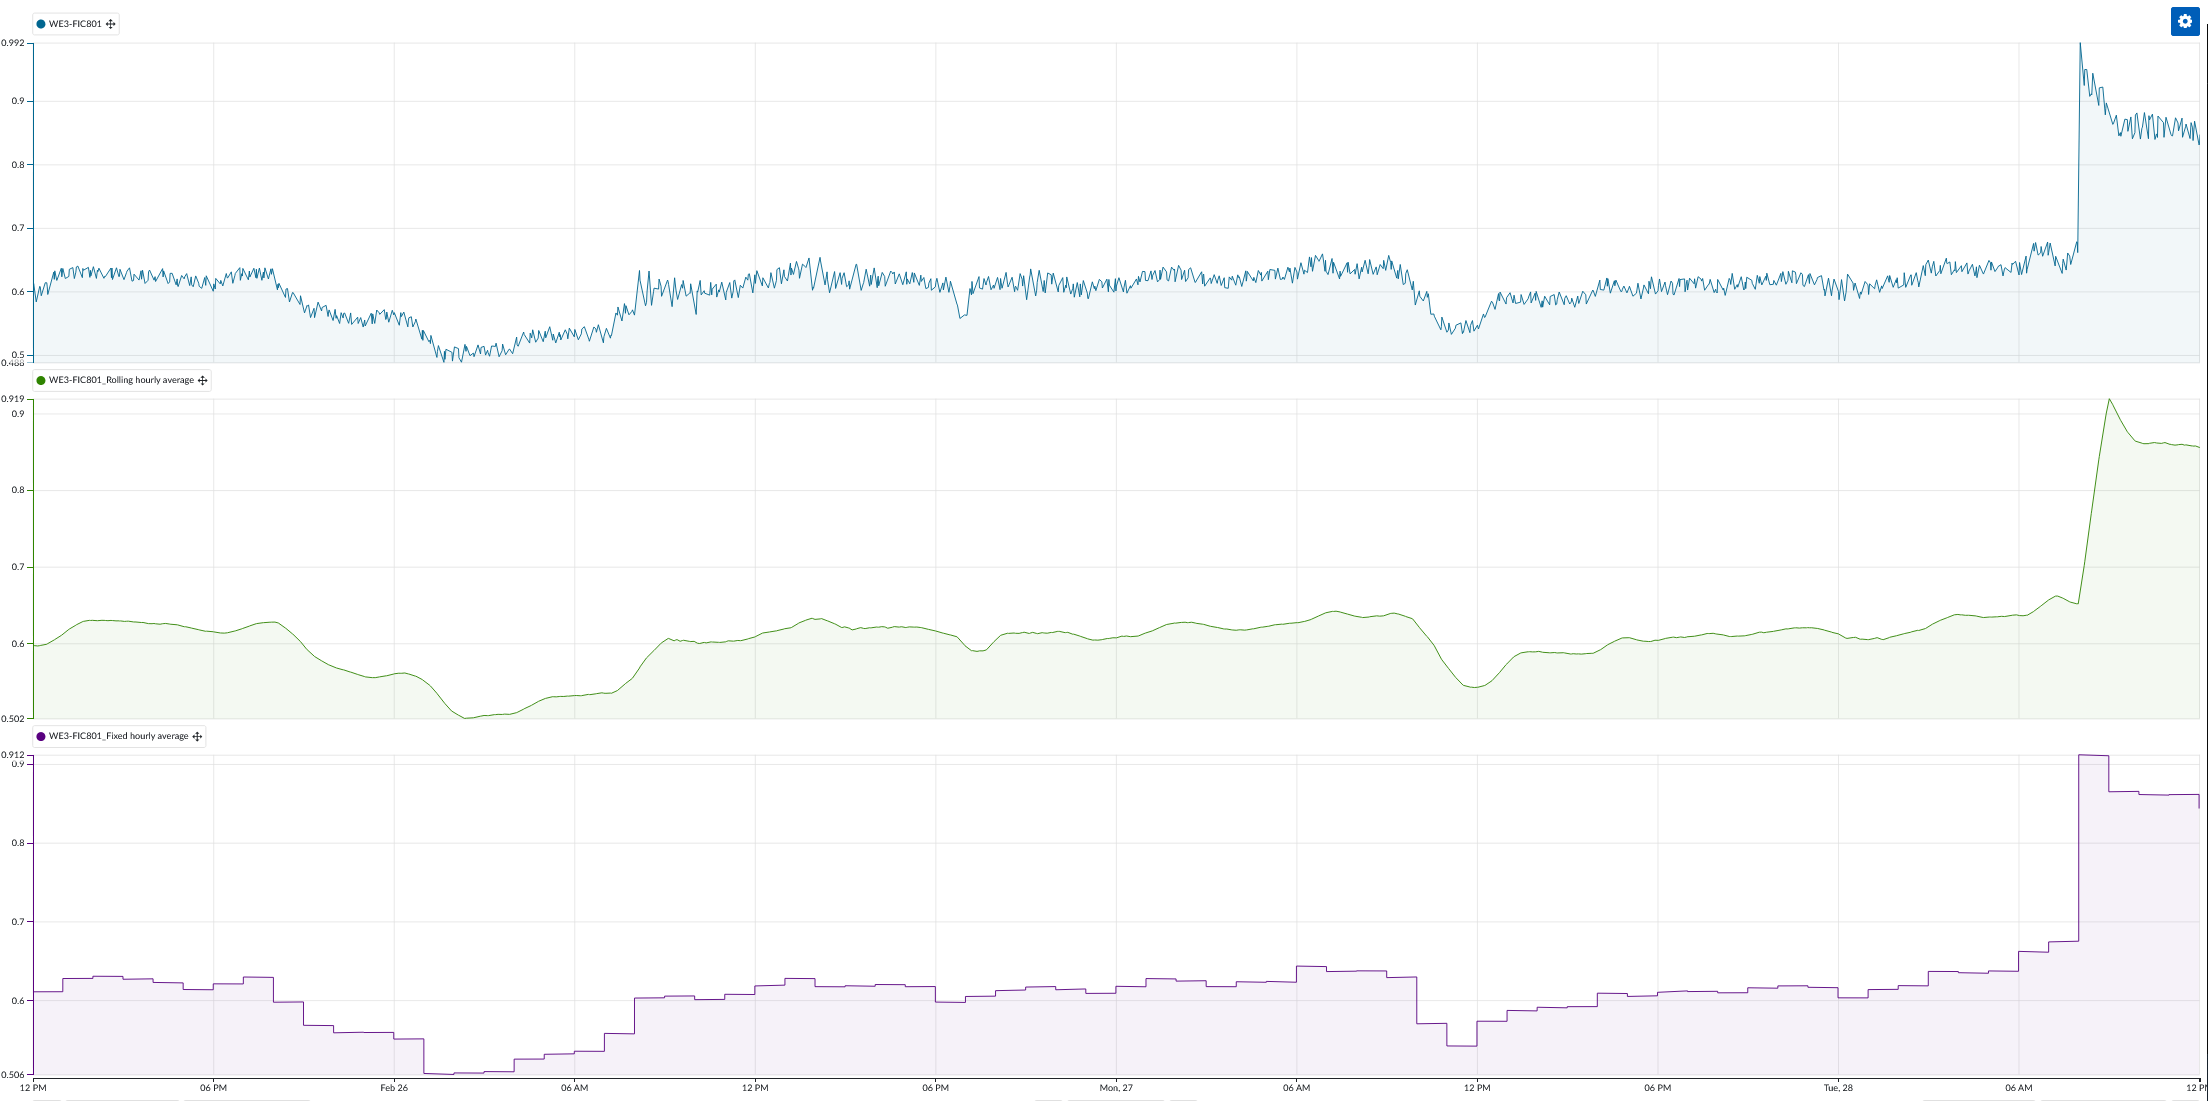
- Calculating rolling hourly averages
The rolling hourly average consumption is calculated using aggregation in the tag builder menu. We select our tag of interest, choose the average as the operator, set the direction to backward, and specify a one-hour aggregation window. With these settings, we can create and save a new tag, allowing us to retrieve the average consumption of the past hour at any given time.
- Calculating fixed hourly averages
The fixed hourly average consumption is calculated by creating a new formula in the tag builder menu:
if(and(a<>b,b=c),AGGREGATION_1, if(and(a=b,b<>c),AGGREGATION_2 , sqrt(-1))).
For variable assignment, we assign a, b and c to the TM_hour_(timezone) tag, where a is shifted by 1 second (1s) and c is shifted by -1s. This shift enables us to precisely capture the transition from one hour to the next. AGGREGATION_1 and AGGREGATION_2 are assigned to our aggregation created in step 1, with AGGREGATION_1 shifted by -1h and AGGREGATION_2 also shifted by -1s
in time, as we need the endpoint of the fixed hour to visualize the average consumption for the entire hour. With the sqrt(-1) function, interpolation is performed between data points, allowing us to create a step for each hour. This formula is then saved, creating a new tag that displays the average consumption for each fixed hour.
Value
Two new tags have now been created, representing the hourly consumption as a rolling average and as a fixed value for each hour. These can be utilized to set up monitoring, such as threshold exceedances, or to create (energy) dashboards. Additionally, these values can serve as a basis for making optimizations if needed. Of course, the calculation can be adjusted not only on an hourly basis but also to determine consumption per day.