

📌 Background
In many chemical plants, reactors contain catalyst beds that gradually lose activity and need to be replaced on a routine basis. Because catalyst life can vary significantly, it is difficult to predict exactly when a failure will occur.
A premature catalyst failure would have a major impact on production, supply chain, and maintenance. Therefore, it is critical to plan preventative maintenance well in advance – at least a few weeks prior to failure – to avoid costly unplanned downtime and production losses.
🎯 Challenge
With TrendMiner, a workflow can be set up to monitor and predict catalyst performance:
-
Searching on Process Values
The first step is to use value-based searches to identify when process values reach certain limits. These searches can be saved and later used as the basis for monitors. In this way, early indicators, warning levels, and critical conditions can be defined, all providing valuable insights into catalyst performance. Event analytics can of course also be used for further analysis. -
Monitoring for the Search Conditions
Based on the saved searches, monitors are configured to track real-time process behavior. Engineers can see immediately whether the reactor is operating within its optimal zone or if deviations are emerging. Current value tiles and monitor tiles can be added to the dashboard to highlight these states visually. -
Create a Performance Dashboard
All key KPIs and monitor information are brought together in a central performance dashboard. This provides at-a-glance insights into the current health of the catalyst.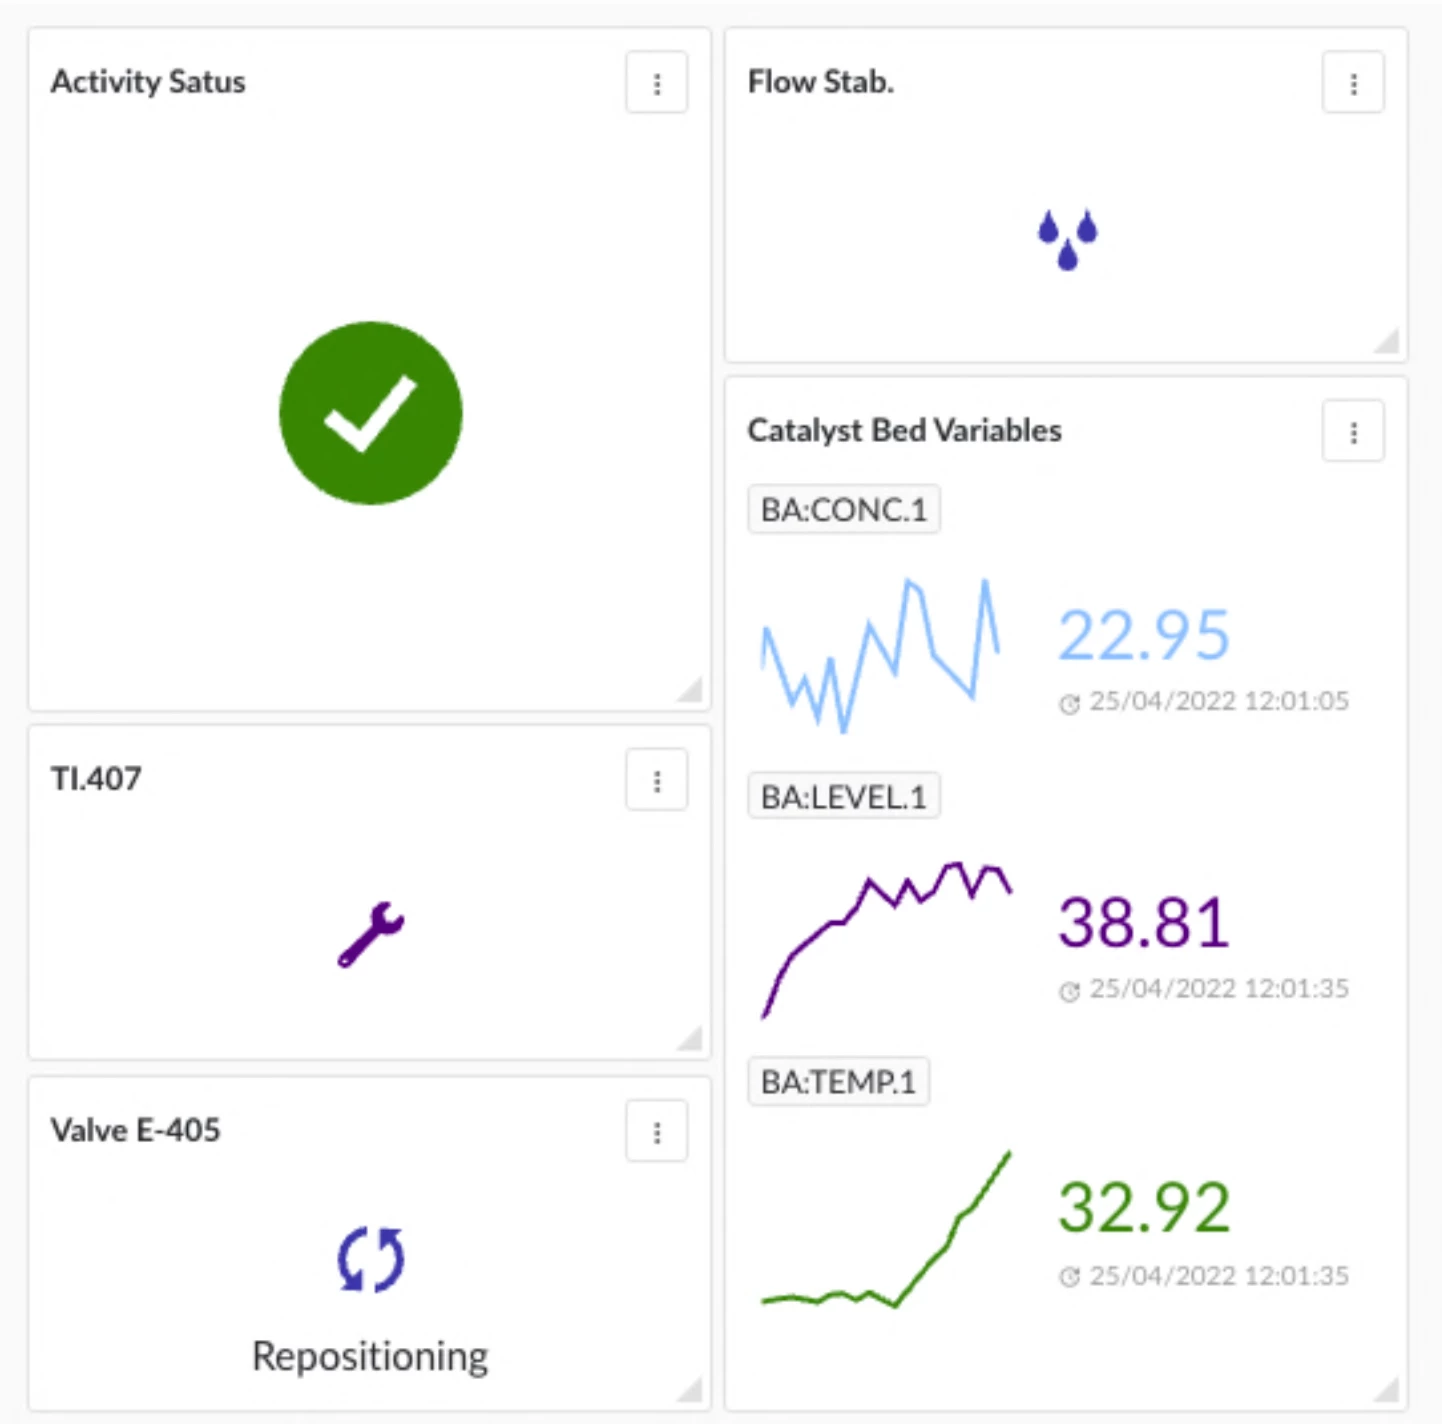
Example of a performance dashboard
✅ Value
The combination of value-based search, monitoring, and dashboards creates significant benefits:
-
Early detection of catalyst failures – well before critical limits are exceeded.
-
Proactive maintenance planning – more lead time for maintenance and supply chain coordination.
-
Reduced unplanned downtime – by enabling timely catalyst replacement.
-
Efficient visualization – clear dashboards that make it easy to assess the asset’s condition at a glance.
