TrendMiner can be used to automatically track the status of our sensor data during a batch process. To prevent losing time continuously having to check process trends, we can make a dashboard telling the user immediately the status of the production process during a period of choice. This can also detect problems, which were missed before and have had a big impact on, for example, product quality.
As an example, we will look at the production of an active pharmaceutical ingredient in a batch process. To show the principle, we are going to monitor if a batch is currently running, and subsequently we are going to check whether the temperature does not increase too much during the batch.
Workflow
- Set up monitoring on timeseries we want to track
- Create a new ContextHub view with corresponding filters
- Add a Gantt-chart tile on a dashboard
- Optional for admins: configure the context item
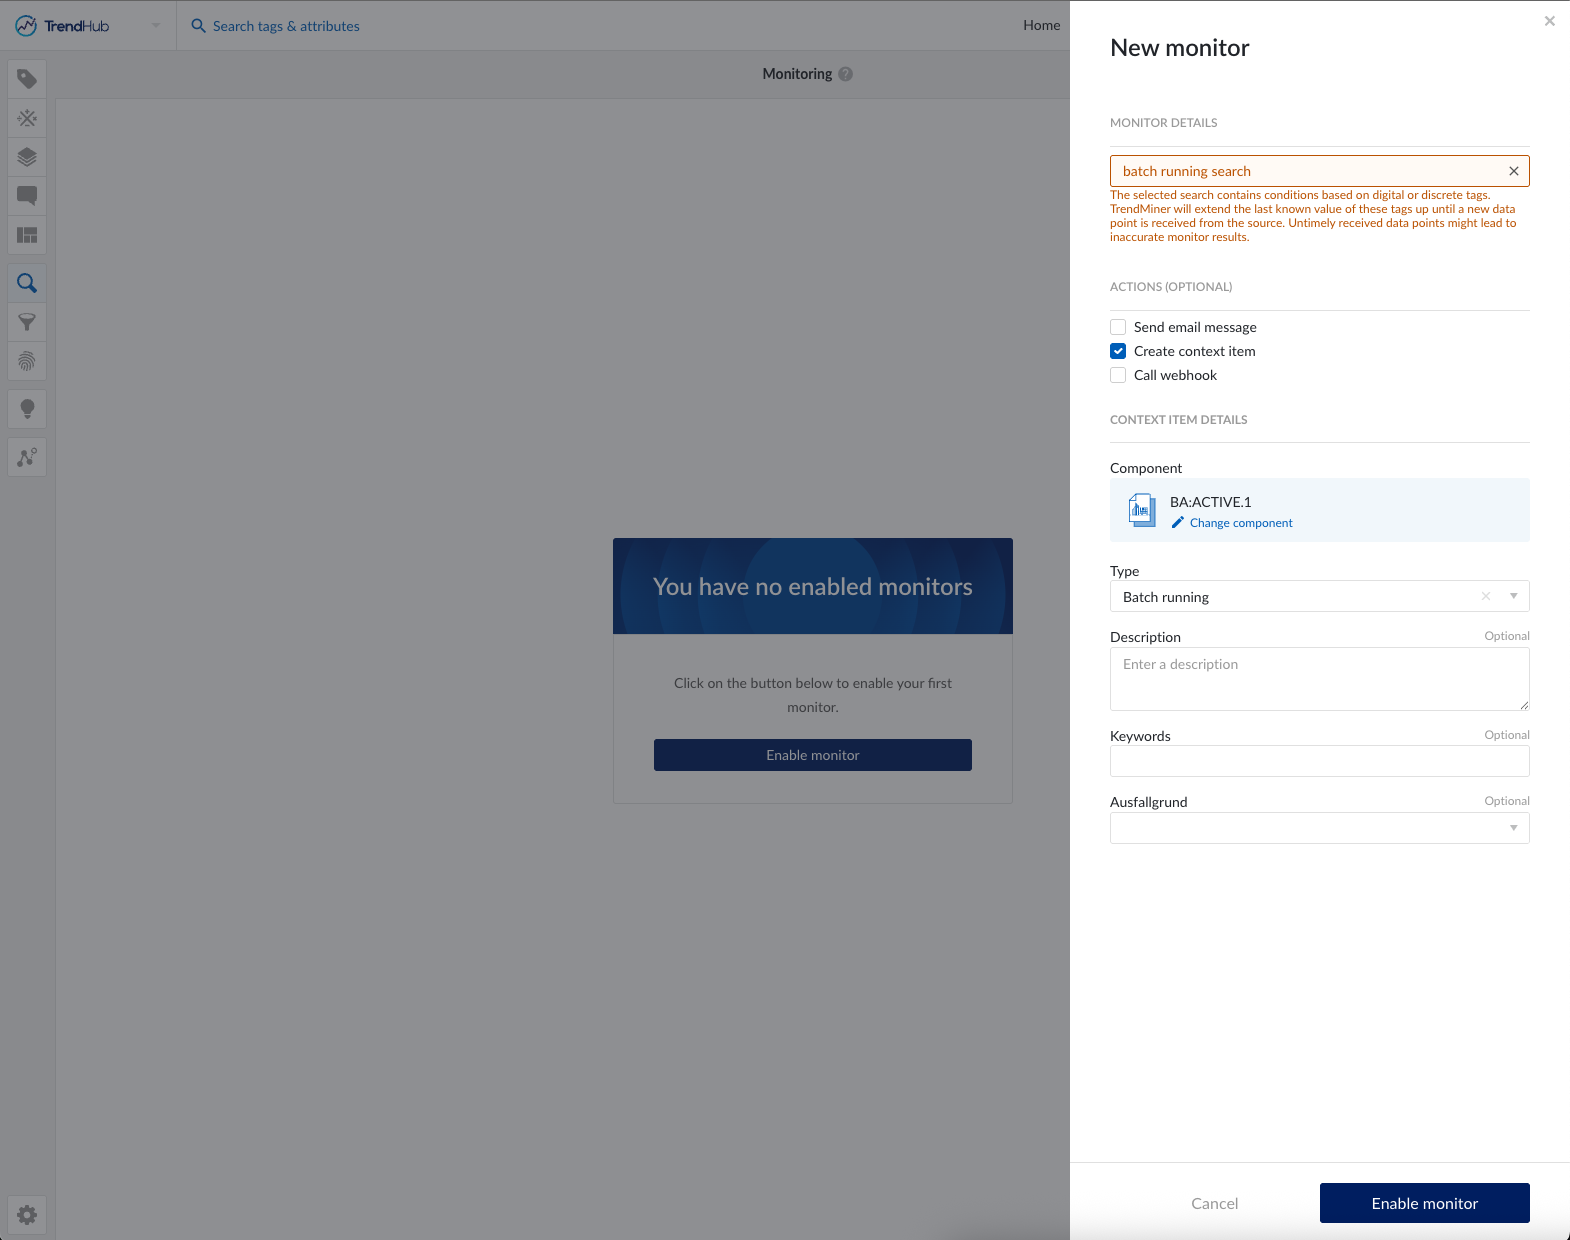
Set up monitoring on timeseries we want to track
First step is to track the events we want to have on our dashboard in TrendHub. This can be done on historical batches by performing a search on a tag. Tags can be digital referring to status of equipment, or analog tags like pressure, concentration or temperature measurements.
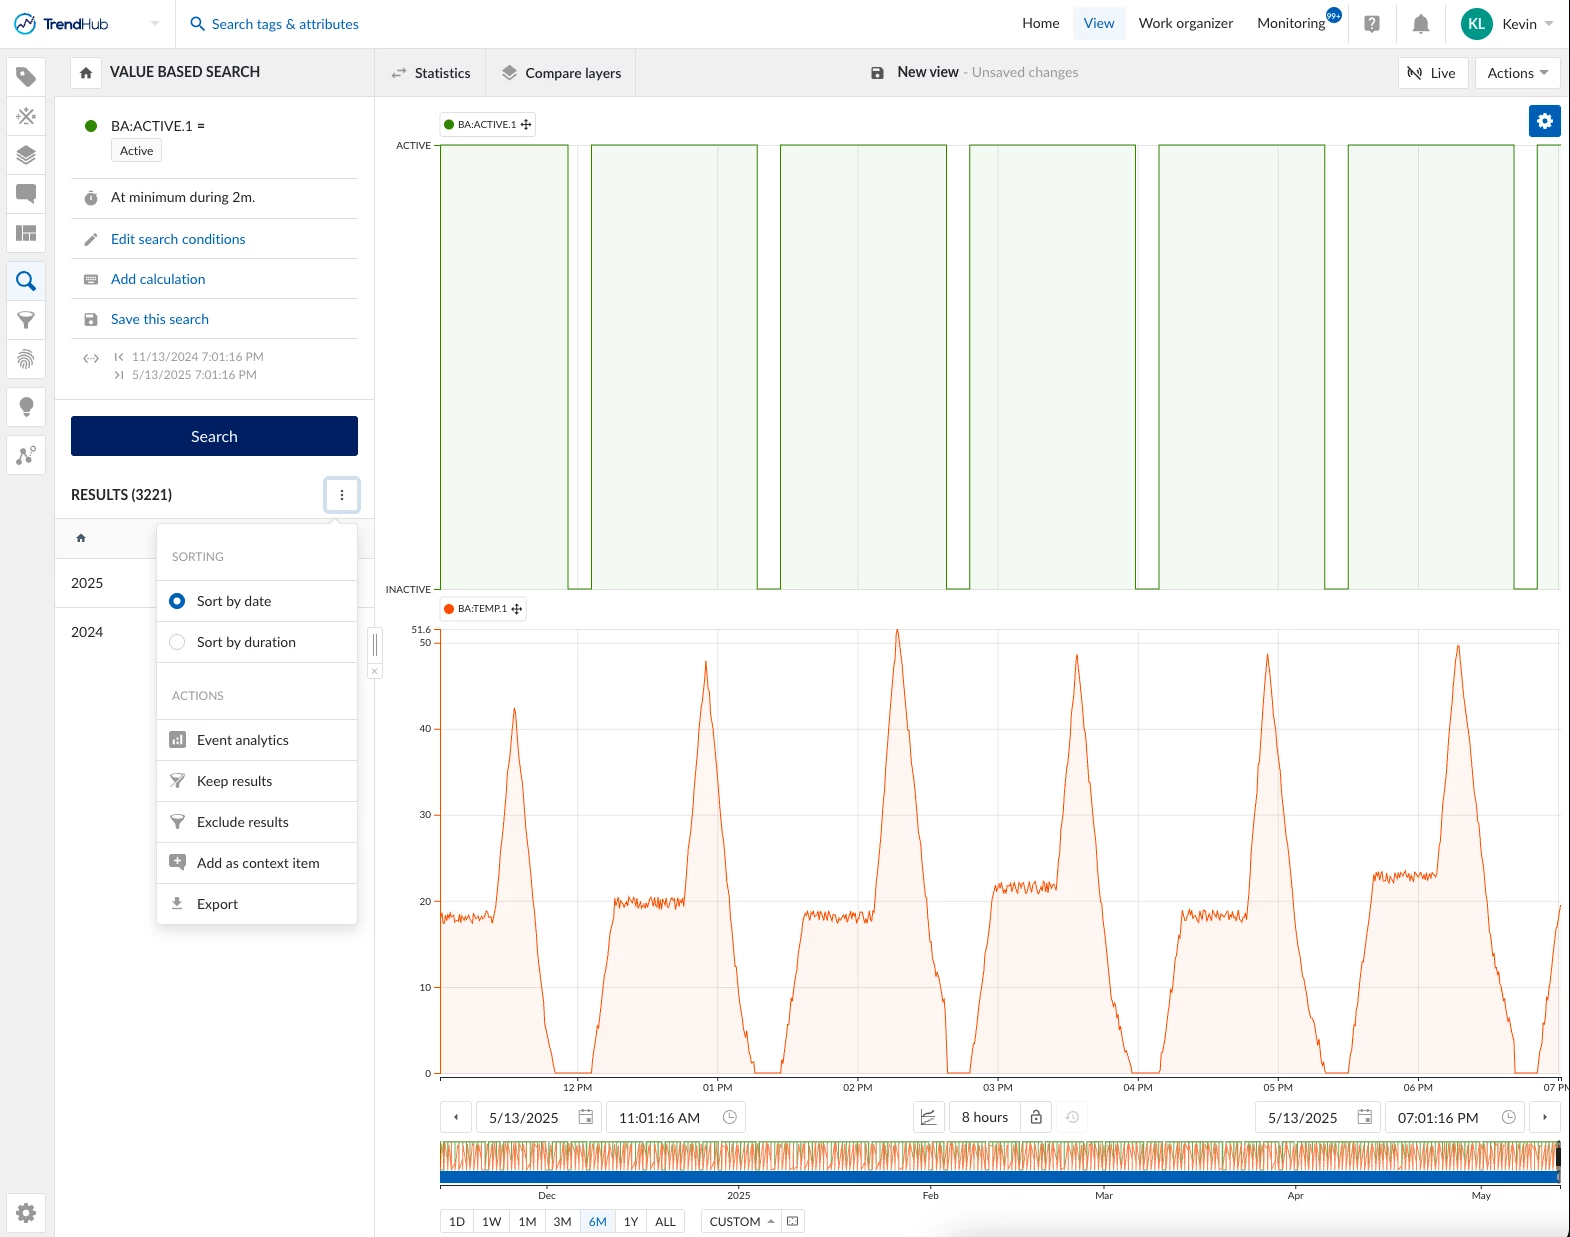
For this specific case we are going to do the following:
- Perform a value-based search on the digital tag BA:ACTIVE.1. This tag says if we are currently running a batch. Create annotations on the search results by clicking on the three dots next to the search results. The type of context item we create will be “Batch running”. Also, save the search and activate the monitor with context item creation.
- Perform a value-based search on the BA:TEMP.1 tag returning a result whenever the temperature during a batch is above 50C for at least 5 minutes. Again, annotate the results. Choose “Anomaly” as the context item type and describe the search conditions in the description field. Also, save the search and activate the monitor with context item creation.
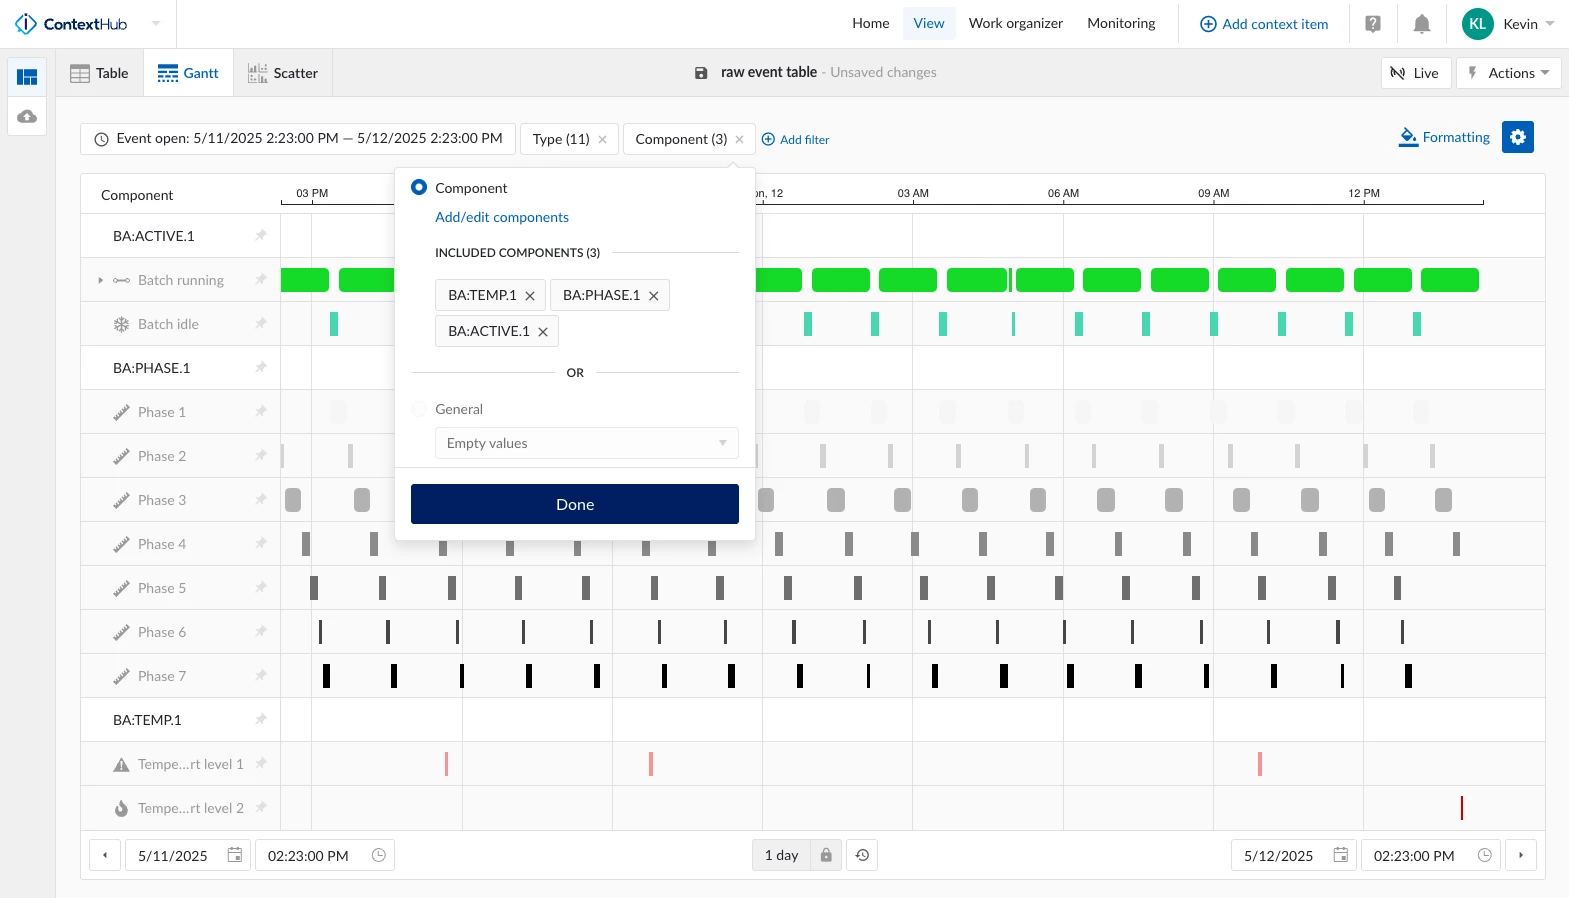
Create a new ContextHub view with corresponding filters
With the event-based data, we can make ContextHub view lists based on filters. Filtering can be done on the time the events occurred, on the fields, on the tag the items are attached to, and much more.
In this specific case we are going to:
- Put “Event open” on last 24 hours.
- Add a filter on components: BA:TEMP.1 and BA:ACTIVE.1
- Save the view
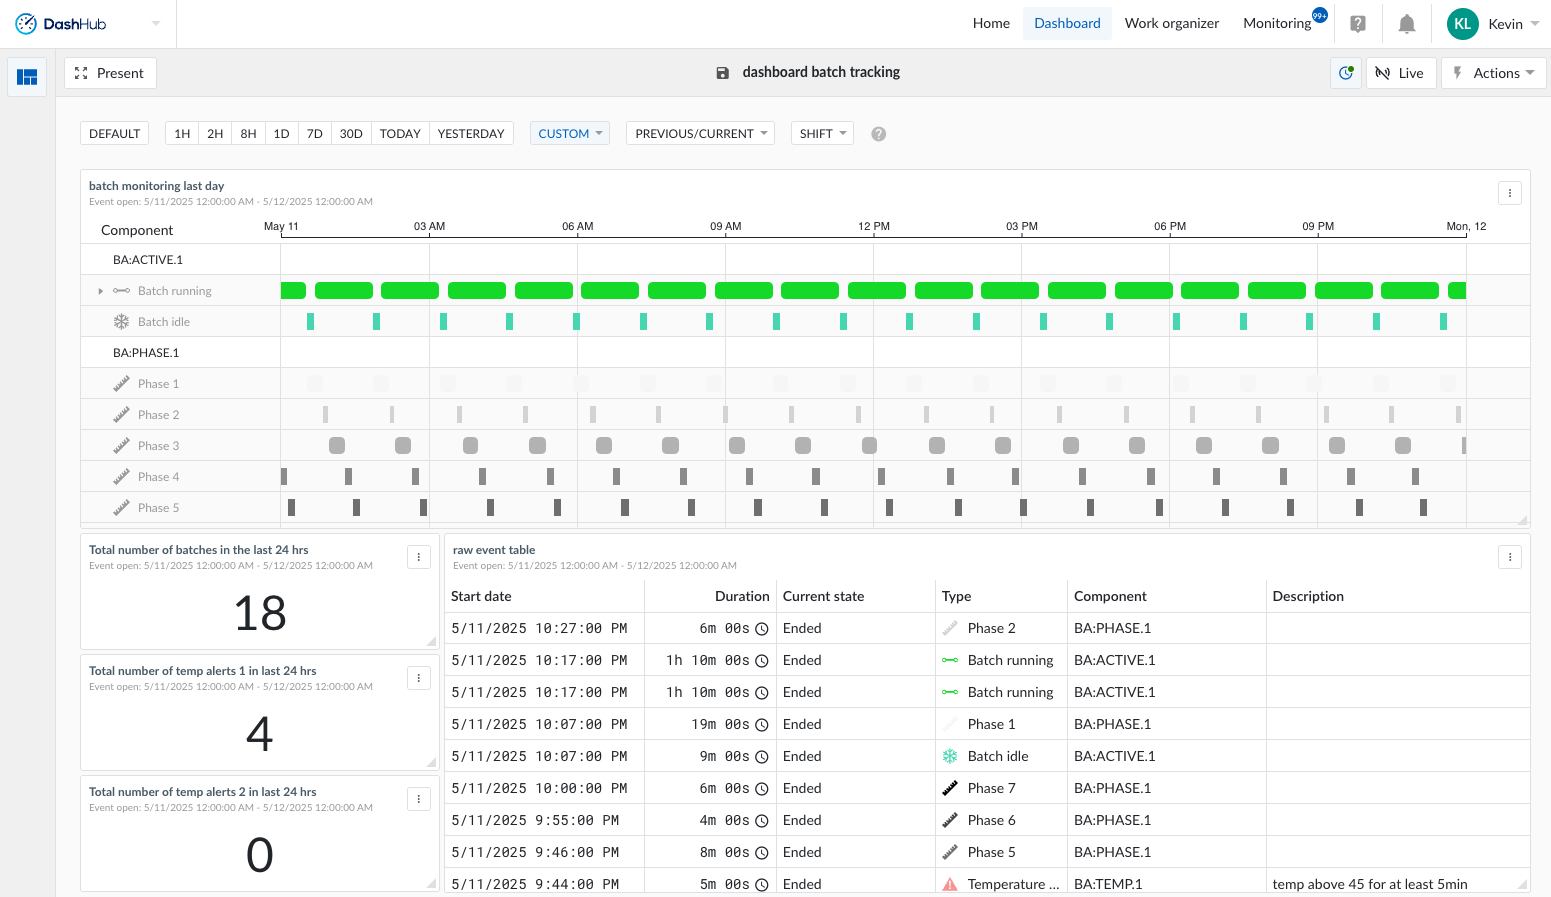
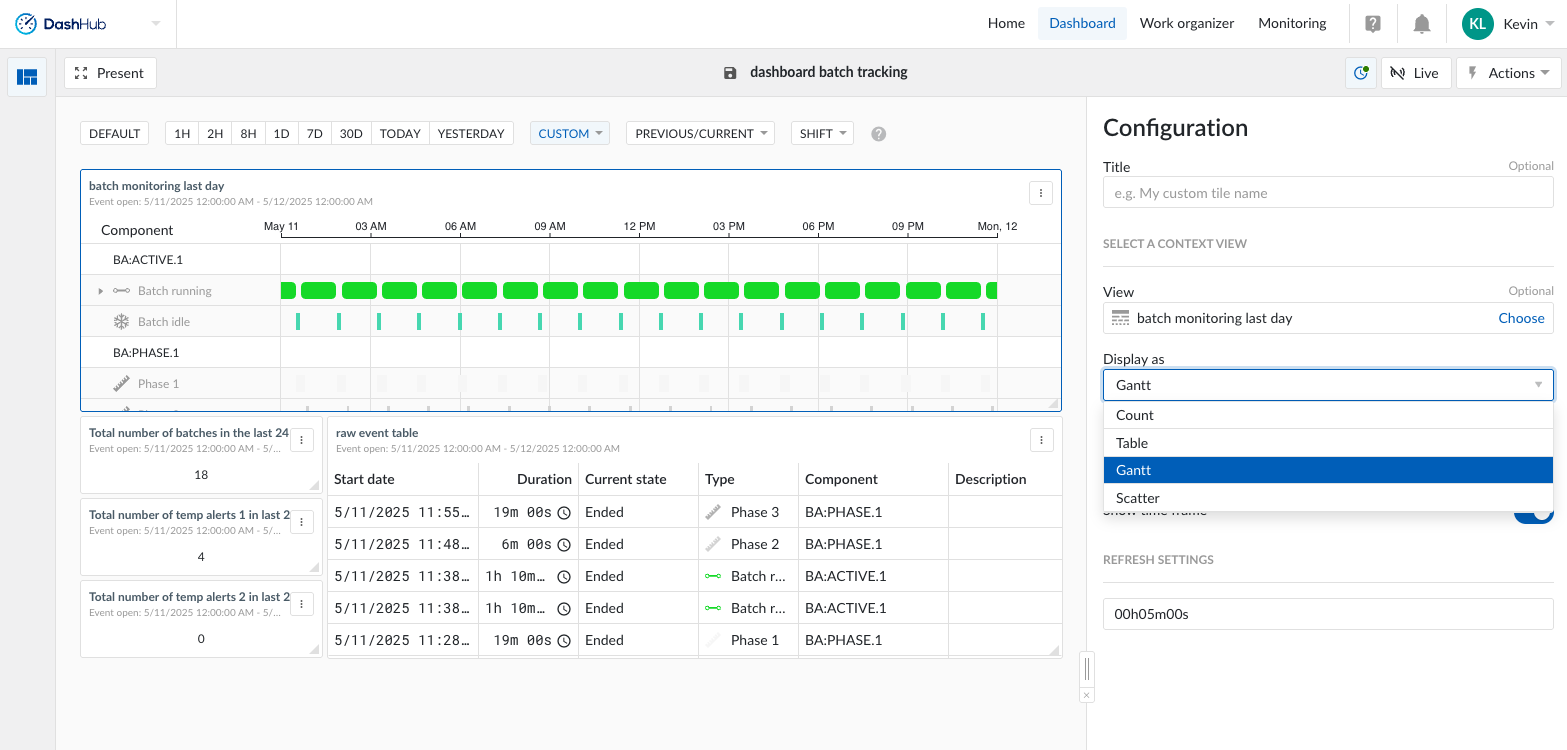
Add a Gantt-chart tile on a dashboard
Open DashHub and add a new dashboard. Underneath “Add tiles”, a new DashHub tile can be created. Here, we want to add a ContextHub tile showing the Gantt chart we prepared in the previous step.
For our particular case:
- The title of the tile: Batch overview
- Choose to display as “Gantt chart
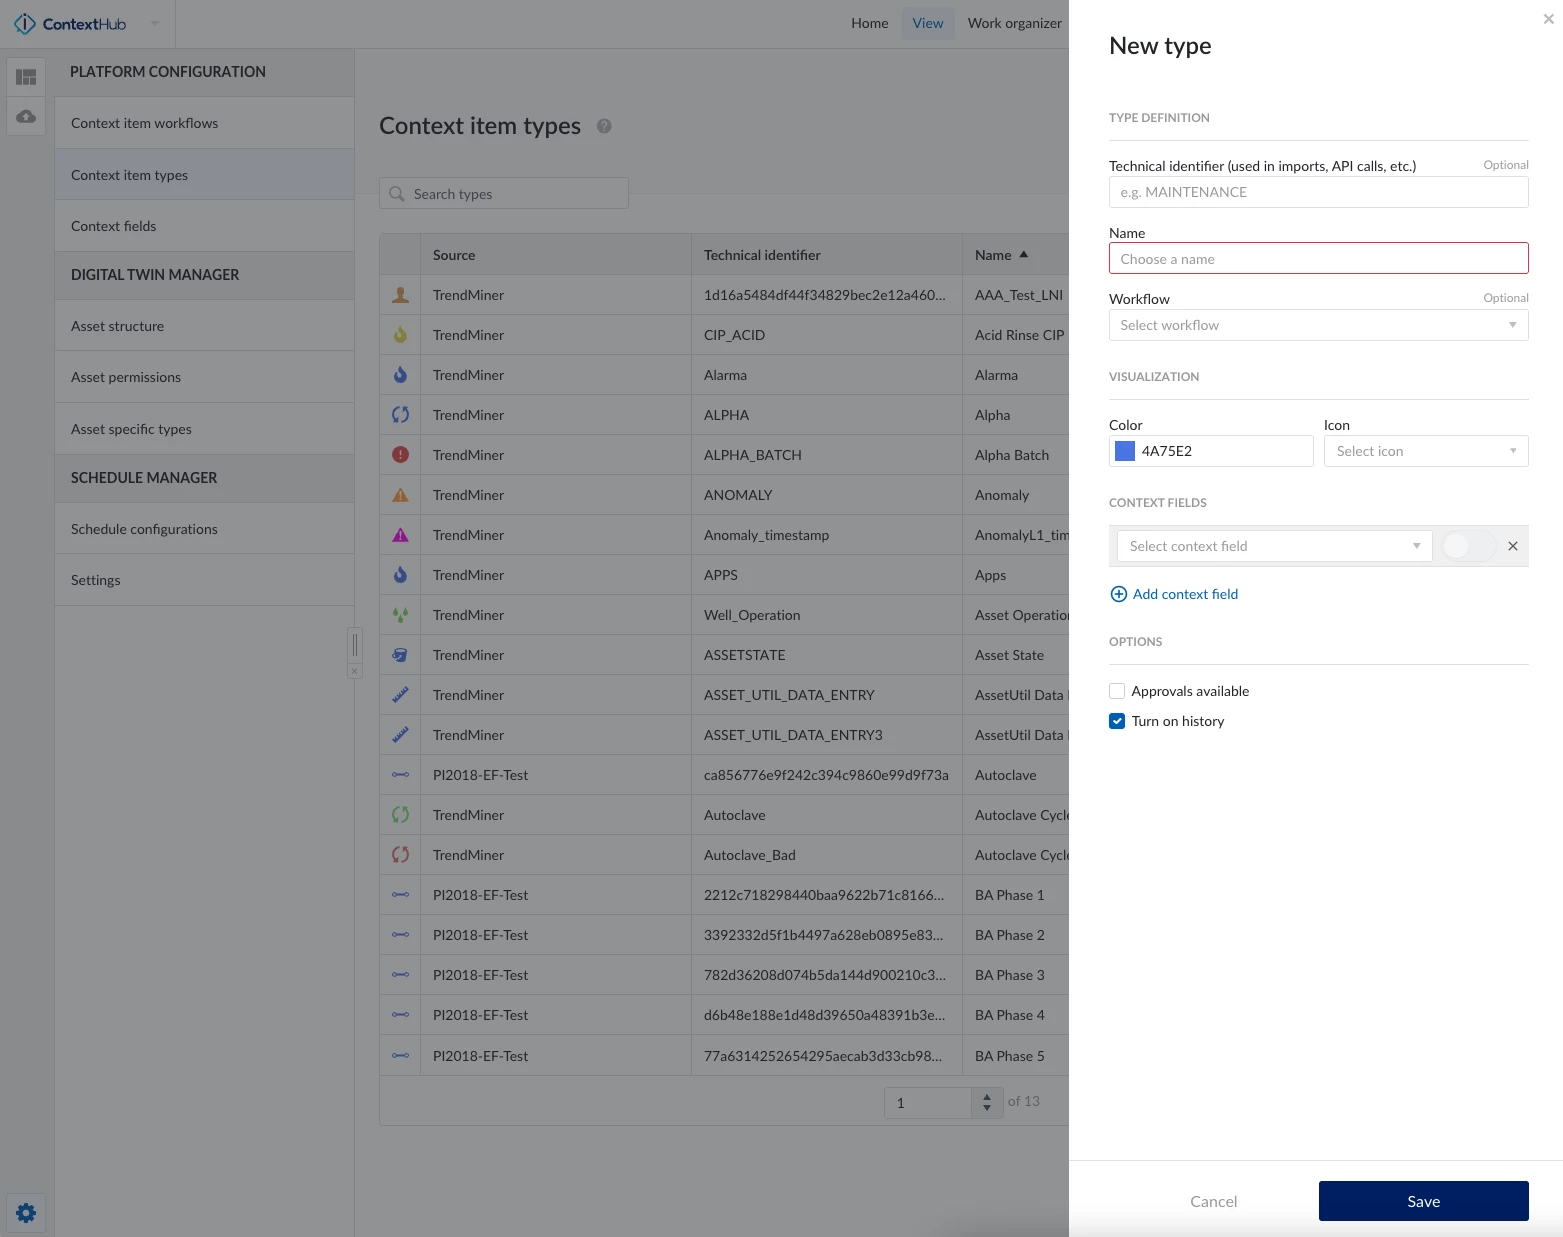
Optional for admins: configure the context item
The context item types “Anomaly” and “Operational” are pre-configured. News types can also be configured by an administrator of TrendMiner within your organization.