
Background
This use case shows how to create a dashboard that shows the number of events per day of the week. This can be emptying/filling of a tank or number of produced batches, or any event indicated by a tag in TrendMiner. Having such an overview can help you gain better insights in your process operations.
Solution
The solution includes the following steps:
- Value based search: Create a value based search to identify the events you want to count on your dashboard. Based on the search results create context items as stated in step 2. Also save the search to enable a monitor based on it for future context item creation.
- Context Item Creation: Each time an event happens, a context item is created to record the event via the search results or the monitor. This context item captures pertinent details such as the timestamp of the event and the day of the week as a keyword.
- Keyword Tagging: The day of the week is tagged as a keyword for every context item, facilitating easy categorization and filtering.
- Context Hub View: A centralized context hub view is established to display the event data. This view spans the last 7 days, providing a comprehensive snapshot of recent activities.
- Keyword Filter: Within the context hub view, a filter based on the day of the week keyword is implemented. This filter enables users to isolate and analyze event data for specific days, enhancing granularity and insights.
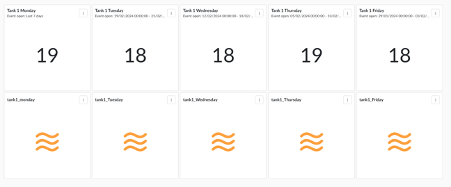
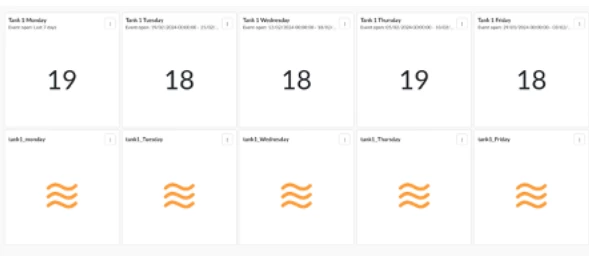
- Tile Creation: For each day of the week, a dedicated tile is created within the dashboard. These tiles have the number of events for each day of the week, based on the keyword filter of step 5.
Results and Value:
The implementation of the daily dashboard counter yields several notable results and delivers significant value:
- Enhanced Visibility: The dashboard provides real-time visibility into event activities, enabling stakeholders to stay informed immediately.
- Data-driven Insights: By analyzing the data presented on the dashboard, users can glean valuable insights into trends and patterns event frequency. This information empowers informed decision-making and process optimization.
- Improved Efficiency: With a structured system in place for tracking events, operational efficiency is bolstered. Users can identify inefficiencies, streamline processes, and allocate resources effectively.
- Facilitated Planning: Armed with comprehensive data and insights, stakeholders can plan and schedule event activities more effectively, minimizing disruptions and maximizing productivity.