

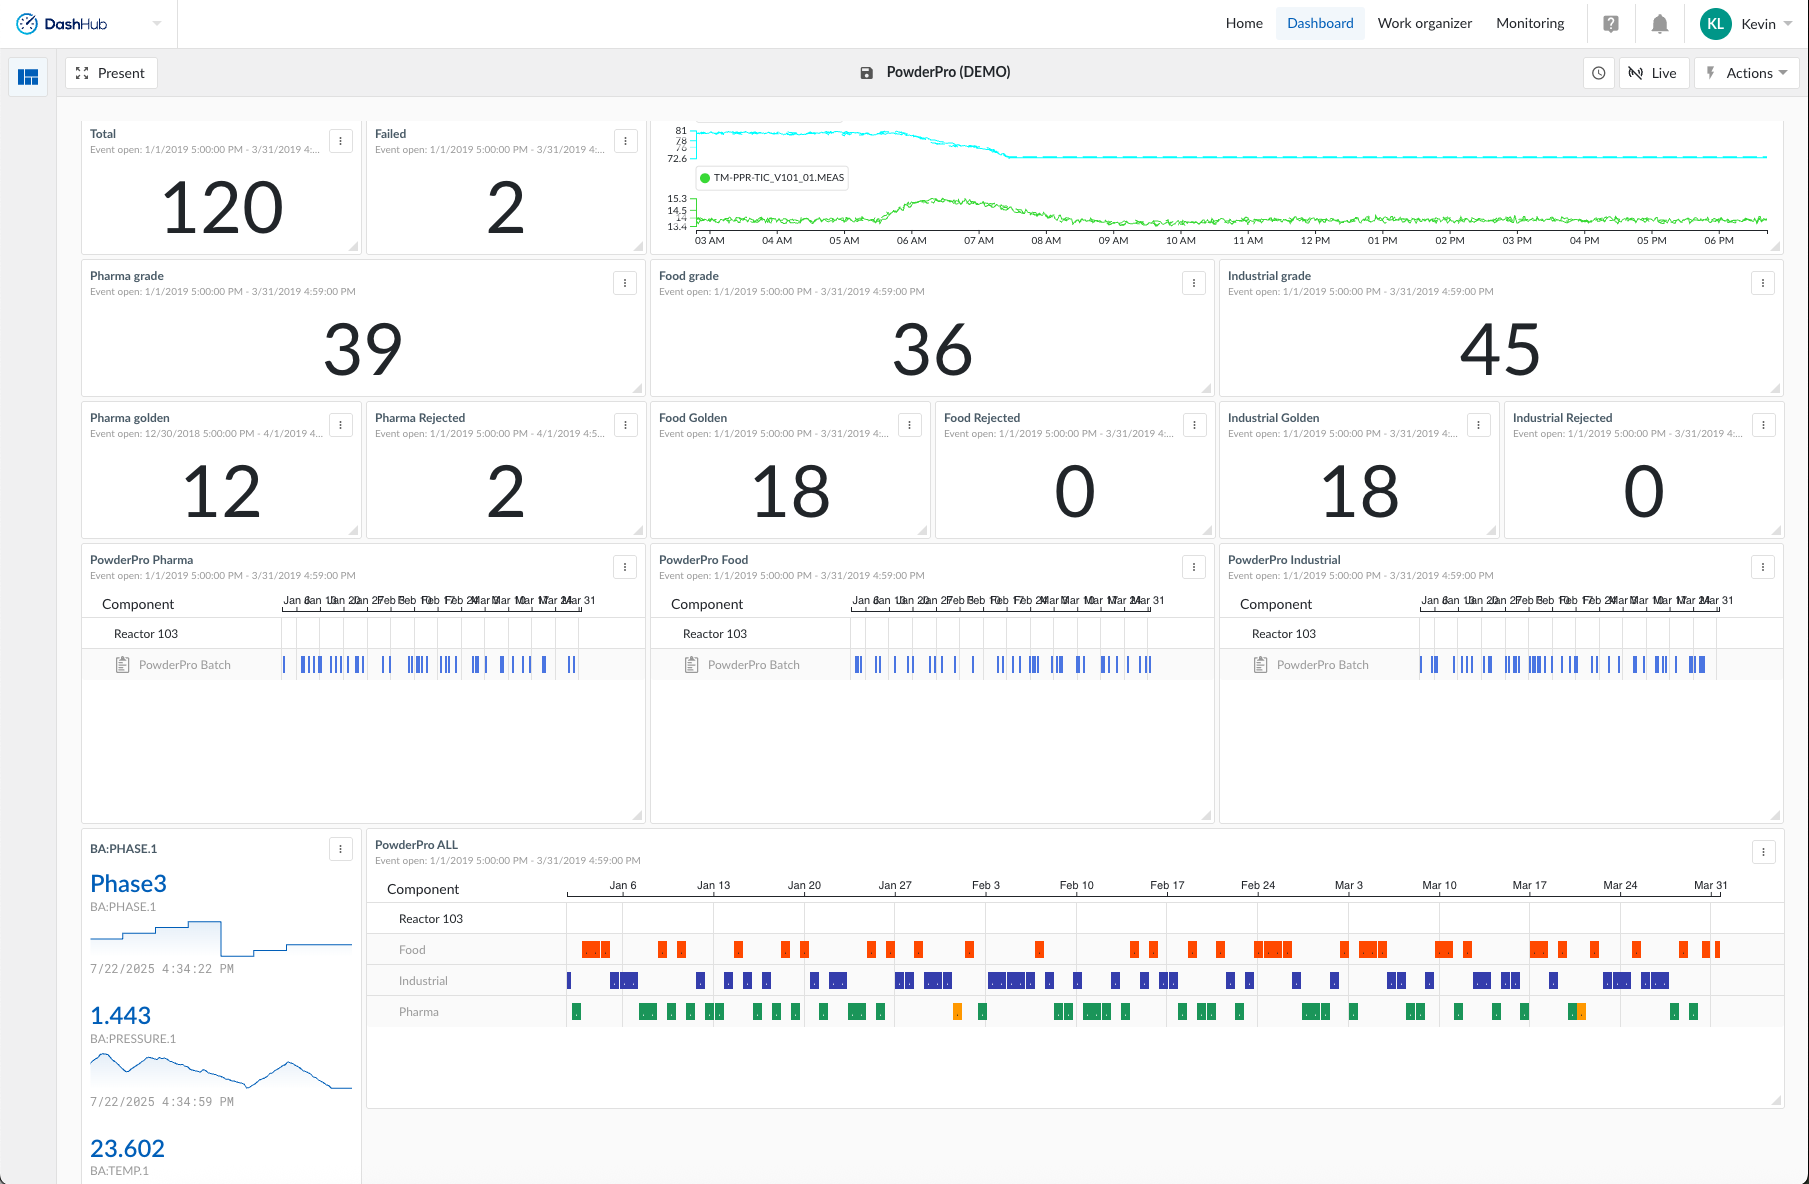
Produced batches often need to meet specific quality criteria depending on the product grade. In TrendMiner, dashboards can be used to monitor the different types of batches produced. For example, batches can be categorized by parameters such as product grade or quality. This provides a clear, real-time overview of how many batches of each category were produced over a user-defined time period.
As an example, we’ll use lab quality data from a polymer production process. The plant produces three different product grades, and quality is evaluated based on viscosity measurements.
Workflow
- Create a new ContextHub view
- Add a ContextHub counter tile
- Repeat for multiple trackers
1. Create a new ContextHub view
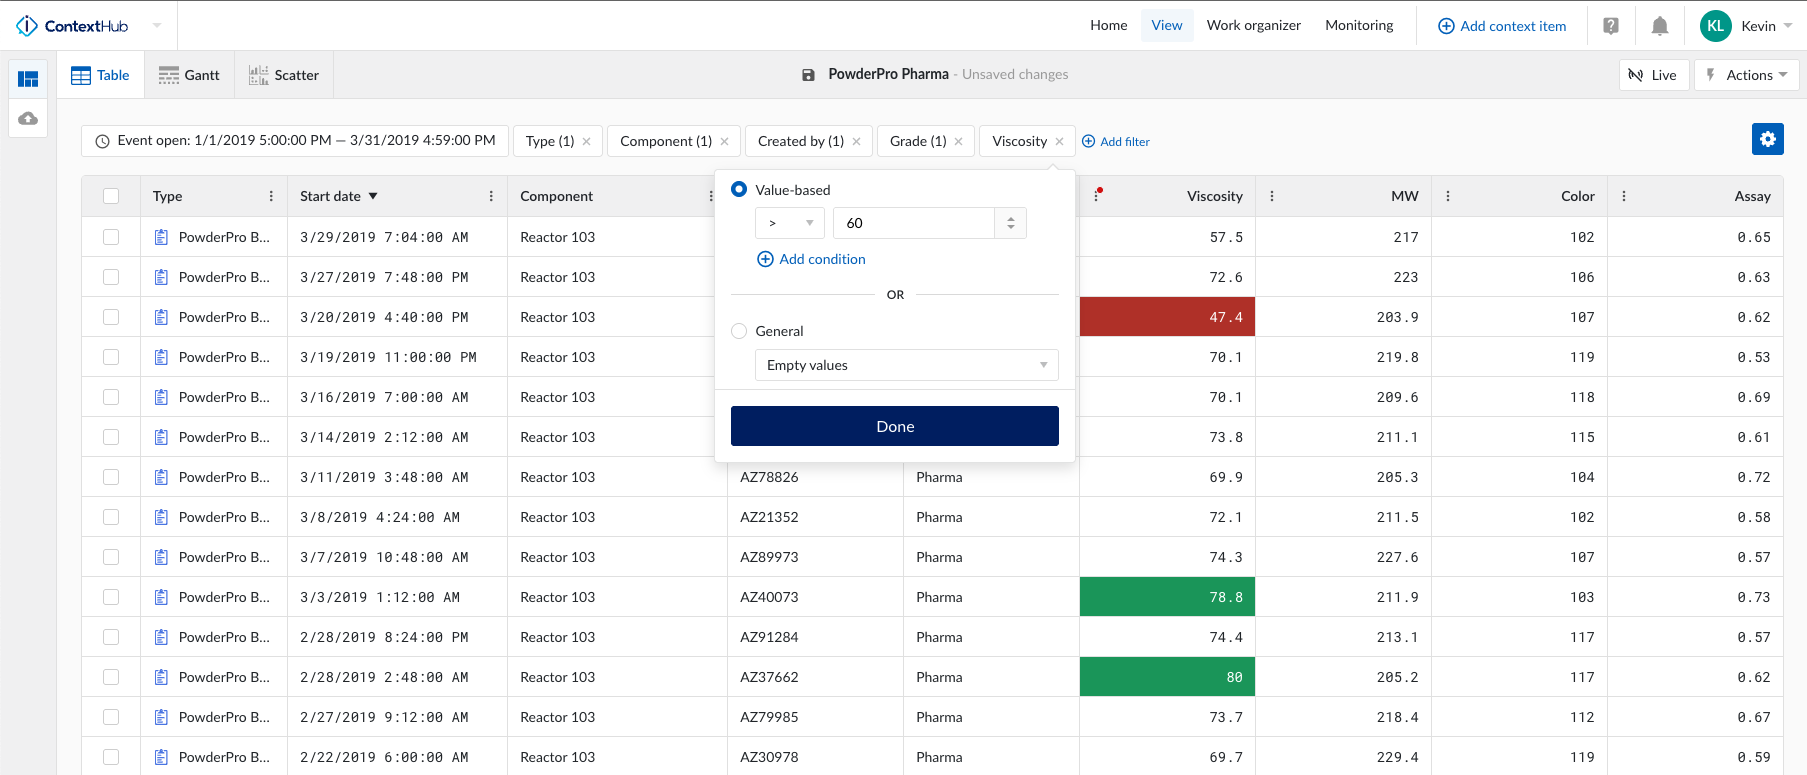
The content of a ContextHub list can be customized using a variety of filters. Common filter options include time period, fields, tags or assets, types, and keywords.
For our specific case, we are going to select:
- Period filter: Event open in range from 01/01/2018 until 01/01/2020
- Field filter: Grade on “Pharma”
- Field filter: Viscosity on “> 60”
These filters will select all Pharma-grade batches produced during the chosen time period with a viscosity greater than 60. As a final step, we save the ContextHub view in the Work Organizer so it can be easily retrieved later when building the dashboard.
2. Add a ContextHub counter tile
In DashHub, we can add tiles that count the number of items in a saved ContextHub view. This allows us to instantly see how many events occurred within a selected period based on our custom filters.
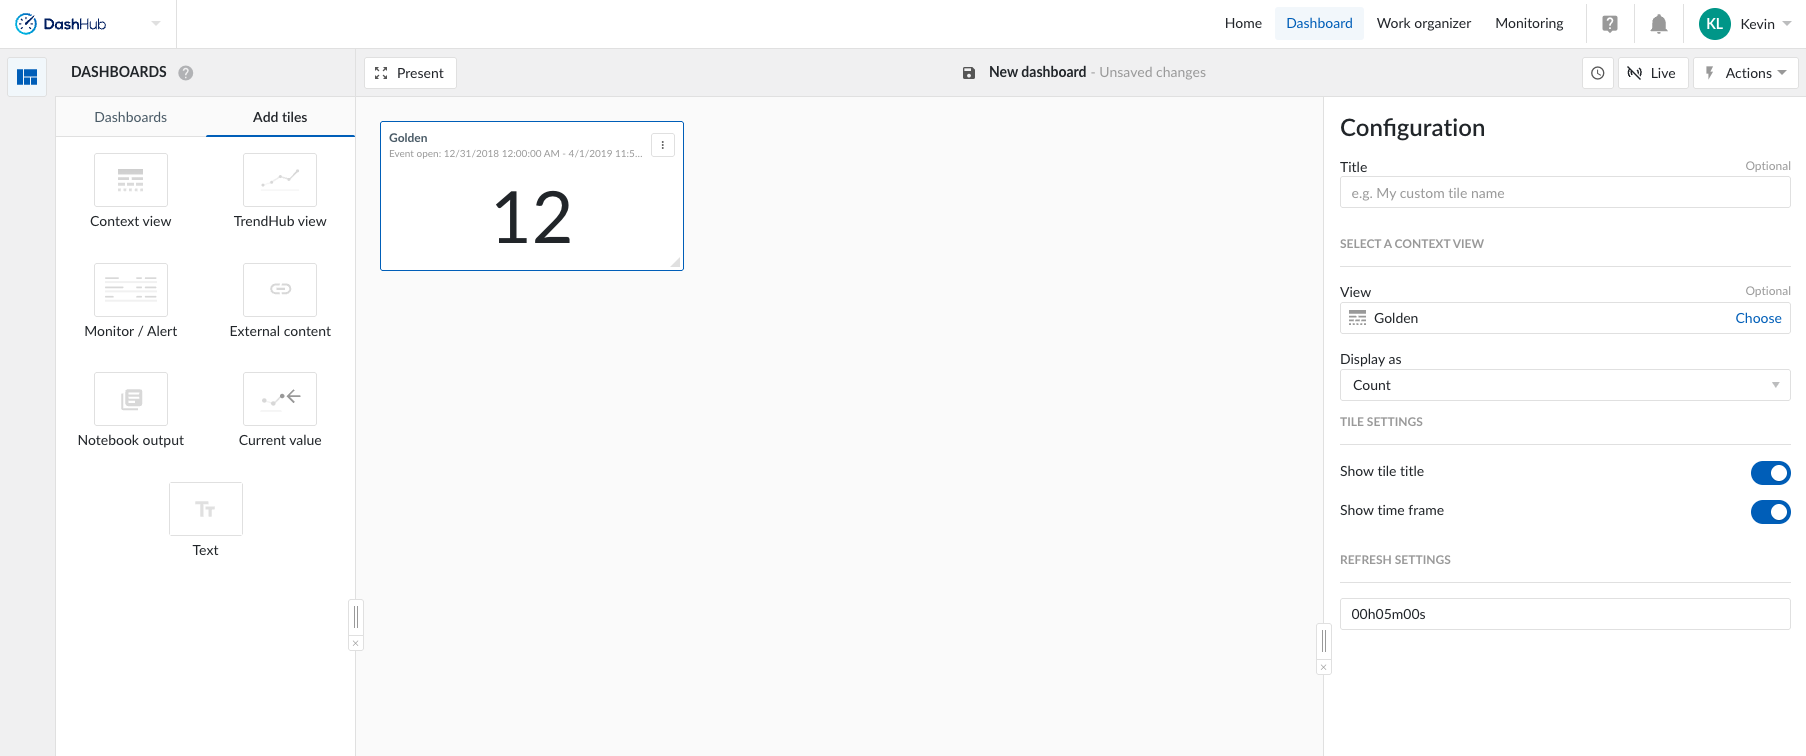
In our case, we’ll add a counter tile based on the ContextHub view we previously created. To do this, open DashHub and create a new dashboard. Under the ‘Add tiles’ menu, you can add a new DashHub tile. Select the option to add a Context view tile, and configure it to count the number of items in the saved view.
- The title of the tile: Pharma batches of good quality
- Choose to display as “Count”.
Once the new tile has been added, save the dashboard in your work organizer.
3. Repeat for multiple trackers
For each counter tile we want to include on the dashboard, a separate ContextHub view is required. As a best practice, it's recommended to organize the views for a specific dashboard using the folder structure in the Work Organizer.
For our case, we repeat the steps to get an overview of:
- Total number of Pharma, Industrial and Food grade batches.
- For each grade, we want to show the number of rejected batches (viscosity < 60) and the number of golden batches (viscosity > 60).
I hope this use case sharing has been informative! Please let us know if you have any questions in the replies below - we would also love to hear about any similar use cases that you have developed. Cheers!