

Improve asset availability and energy efficiency with self-service analytics
📌 Background
In many process-driven industries, heat exchangers play a crucial role in maintaining efficient thermal operations. For example, process gases exiting a shell-and-tube heat exchanger are often routed to downstream equipment like baghouse filters, which are subject to strict temperature limits. To prevent safety risks or equipment damage, conservative temperature thresholds are often used—typically set well below actual specification limits.
However, over time, systems may experience efficiency losses due to fouling, which can increase outlet temperatures and push operations closer to critical thresholds. Being able to detect and address fouling at an early stage is key to maintaining asset availability and optimizing energy use.
⚙️ Challenge
Fouling inside heat exchangers reduces thermal efficiency, leading to higher outlet temperatures and potential process deviations.
To ensure safe and optimal operation, it is essential to:
- Identify fouling trends early on
- Compare current and historical operating conditions
- Evaluate whether operating limits can be safely adjusted
- Avoid unnecessary shutdowns and improve maintenance timing
🔍 Solution
With TrendMiner, engineers and analysts can leverage self-service analytics to explore historical process behavior and gain actionable insights into heat exchanger performance.
Key steps for addressing fouling and optimizing conditions
-
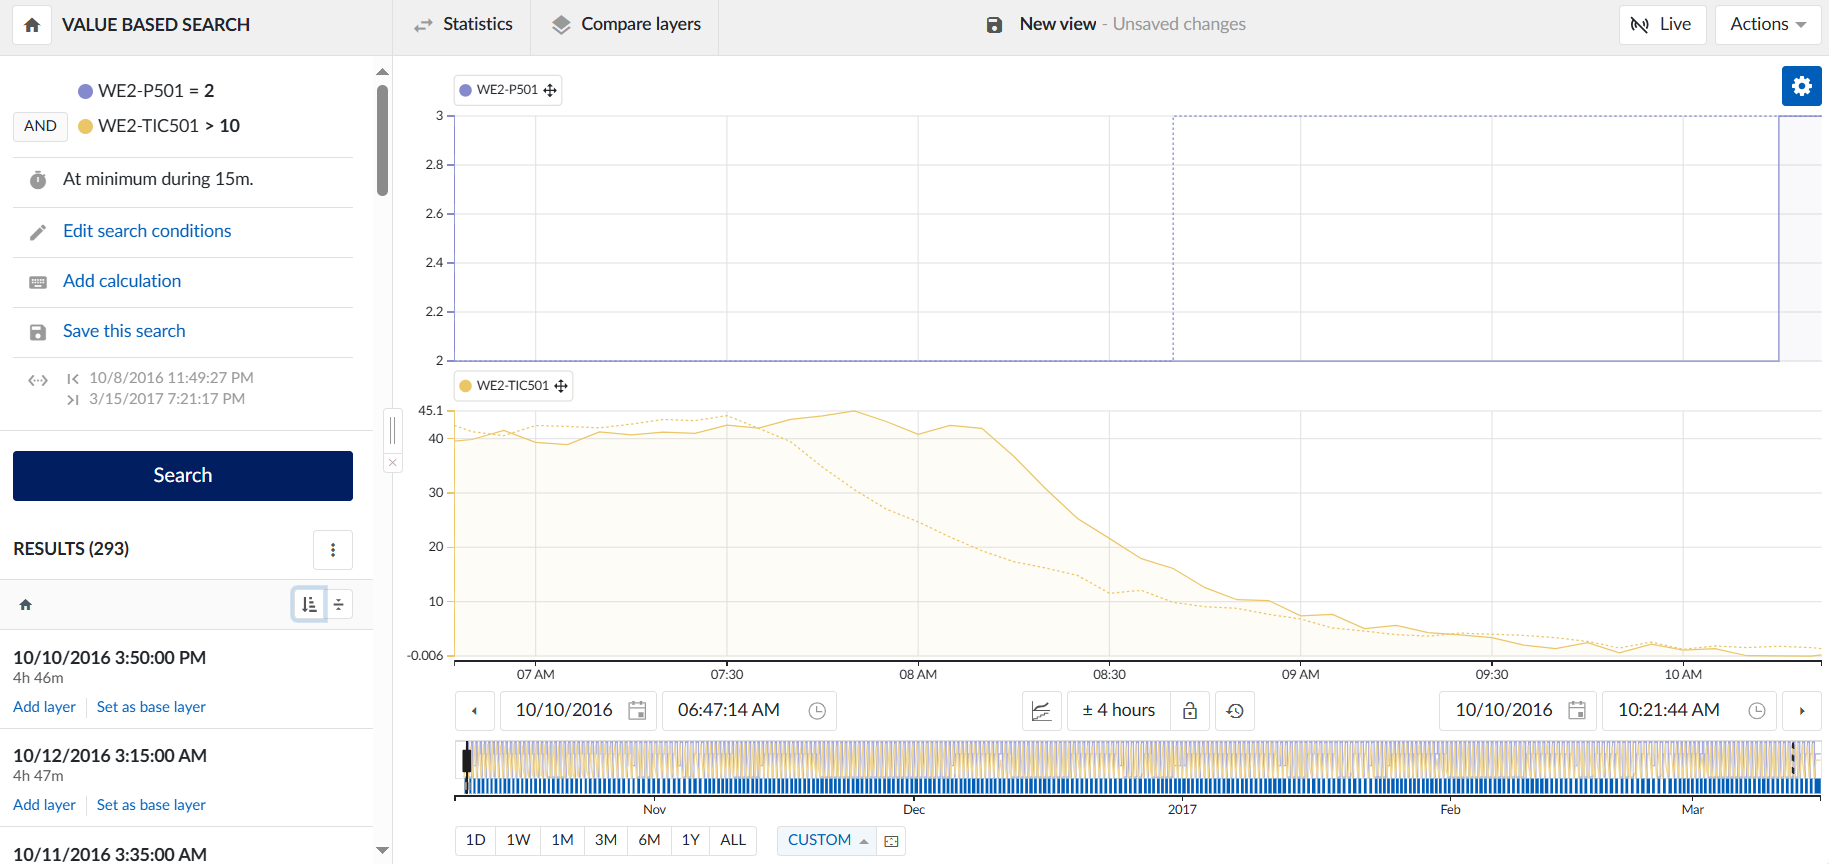
Define operating regimes using value-based searches
TrendMiner allows users to set up value-based searches to isolate periods where process variables (e.g., outlet temperature) fall within certain ranges. This makes it easy to compare different operating conditions—such as high vs. low temperature periods. -
Overlay and compare operating behavior
By overlaying timeframes with different conditions in TrendHub, users can visualize key process parameters and detect deviations. Comparing variables such as inlet/outlet temperatures, bypass valve positions, and flow rates can reveal how fouling impacts overall efficiency. A particularly valuable approach is to focus on the cooling phases of the process. By isolating these timeframes, it becomes possible to analyze how long each cooling phase takes, what temperature drop is achieved, and how efficient cooling compares to periods when the heat exchanger performs poorly. Of course, this can also be monitored by creating a monitor based on a saved search.
- Track thermal performance indicators
Calculating the temperature delta (ΔT) across the heat exchanger and monitoring it over time can help detect early signs of fouling. A decreasing temperature difference under similar load conditions often points to reduced heat transfer performance. - Support decision-making with contextualized data
Contextualizing events with tools like ContextHub and adding annotations or calculated tags can help track fouling incidents and correlate them with production or maintenance data. This supports more informed decisions regarding preventive actions or adjustments to operating limits.
✅ Results & Benefits
By following this approach, teams can expect:
-
Earlier fouling detection → Act before problems escalate
-
Improved asset uptime → Avoid unnecessary shutdowns
-
Energy savings → Operate closer to true efficiency
-
Faster decision-making → No spreadsheets or manual trend reviews
💡 Summary
Self-service analytics with TrendMiner empowers process engineers to manage asset performance proactively. By analyzing real operational data, fouling in heat exchangers can be detected earlier and handled more effectively—leading to improved plant reliability, efficiency, and safety.