

Background
Interpreting time-series data at a glance can be challenging, especially when process experts need a quick update on what’s happening in their plant. Instead of scanning raw trends directly, it’s often more effective to use a dashboard that highlights key incidents and events. With TrendMiner, dashboards can be configured to automatically track setpoints, rapid process changes, error codes, and much more, providing immediate insights without the need for manual data review.
As an example, we will set up a productivity tracking system to monitor sulfur production in a sulfur recovery plant.
Workflow
1. Set up monitoring on interesting sensor data
2. Create a new ContextHub view with corresponding filters
3. Add a Gantt-chart tile on a dashboard.
4. Configure new Context Types (Optional; Admin rights)
--------------------------------------------------------------------------------------------------------------------------------------------
1. Set up monitoring on key sensor data
Before events can be tracked, it is important to configure monitors for specific, self-defined conditions. These conditions might include a temperature that cannot exceed a certain threshold, a pressure that should not fluctuate excessively within a given period, or the status of an asset. Once the condition of interest is defined, we can perform a search on this condition in TrendMiner.
In our specific use case, we will perform a value-based search on a tag that represents the productivity of the sulfur recovery unit (SRU).
-
High production events: Perform a value-based search on the SRU production tag with values greater than 900 tons per day. Create annotations on the search results by clicking the three dots next to each result. Define the context item type as “Anomaly” and include the search conditions in the description. Finally, save the search and activate monitoring with context item creation enabled.
-
Low production events: Repeat the value-based search on the SRU production tag, this time with a condition of less than 800 tons per day. Again, annotate the results, define the context item type as “Anomaly”, include the conditions in the description, save the search, and activate monitoring with context item creation enabled.
-
Normal operating range: Perform a value-based search on the SRU production tag with conditions between 800 and 900 tons per day. Annotate these results as context items of type “Operational”, save the search, and activate monitoring with context item creation enabled.
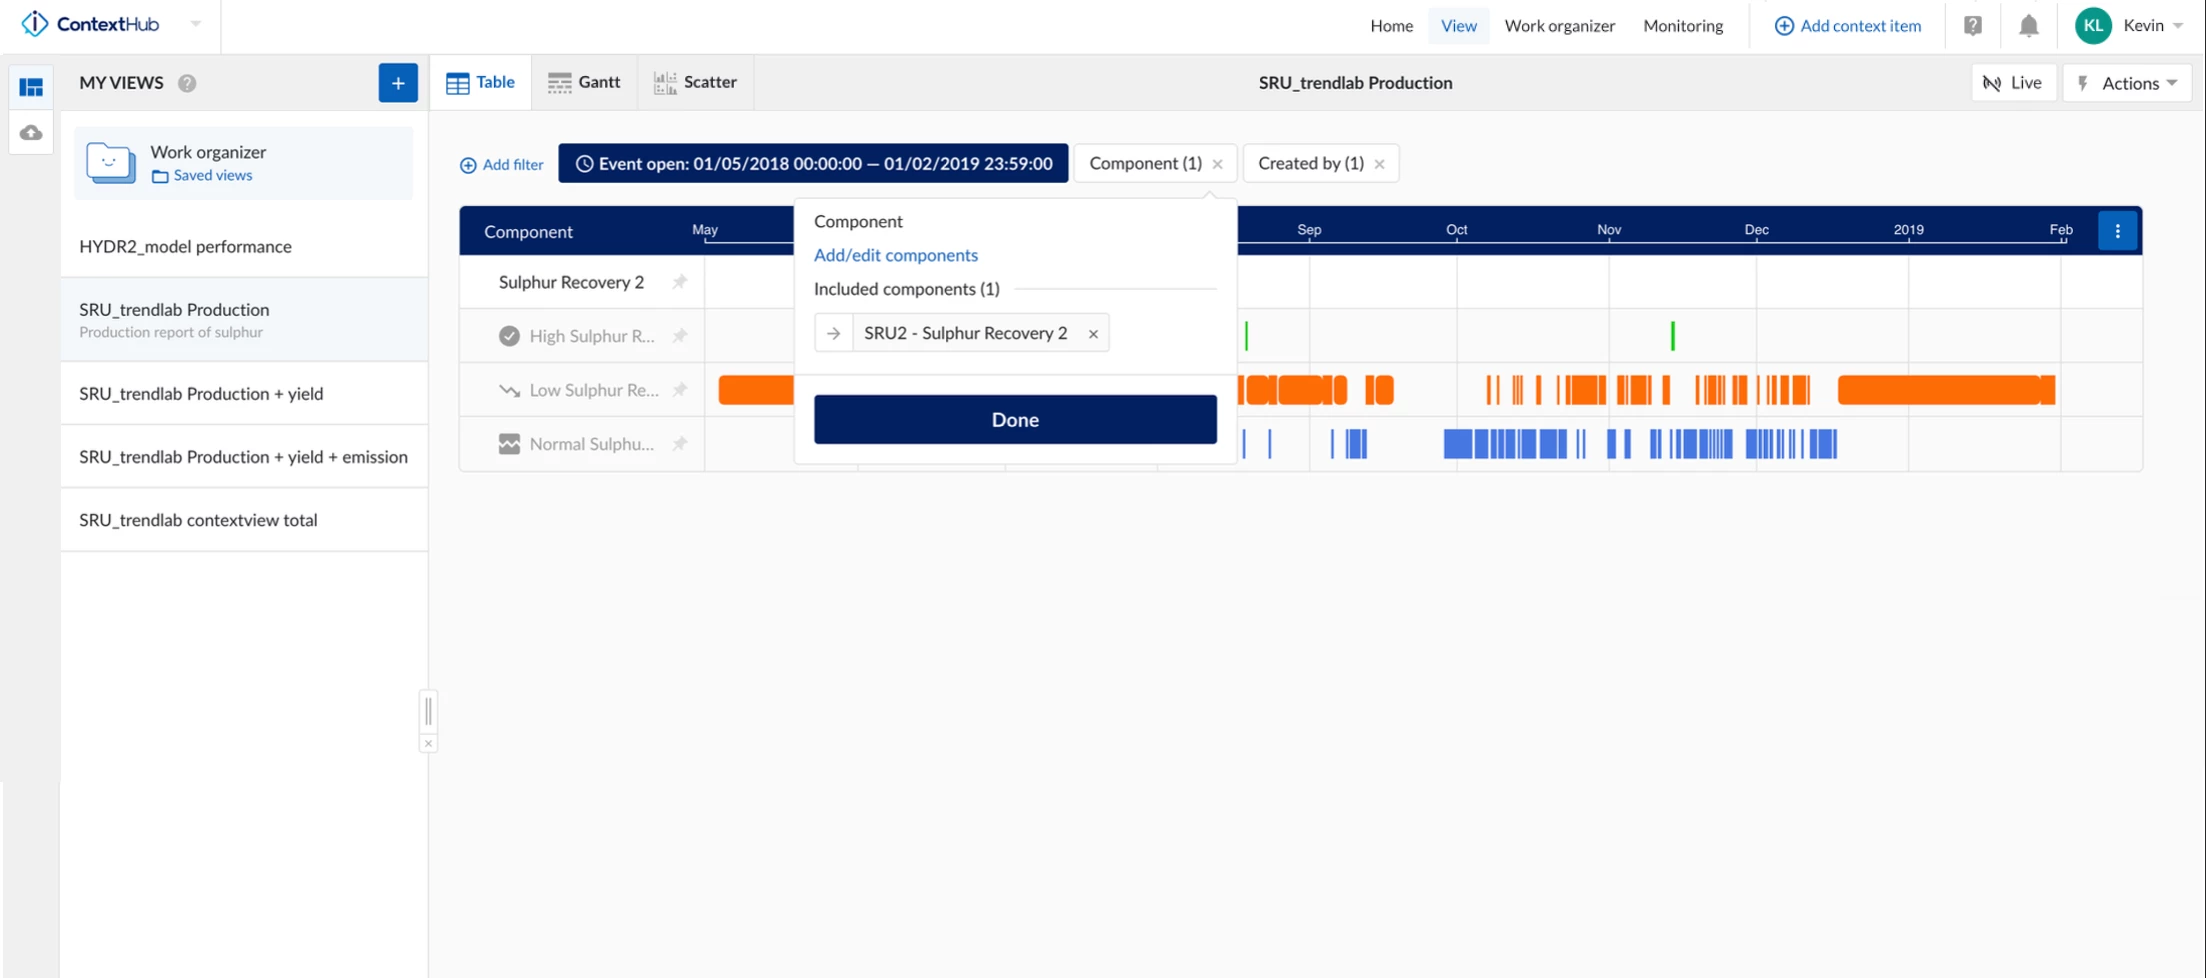
2. Create a new ContextHub view with corresponding filters
With event-based data, ContextHub makes it easy to create custom views using filters. Filters can be applied to event timing, context fields, associated tags, and more.
In this specific use case, we will create the following ContextHub view:
- Set the “Event open” filter to the last 7 days.
- Add a filter on components: TAG production.
- Save the view.
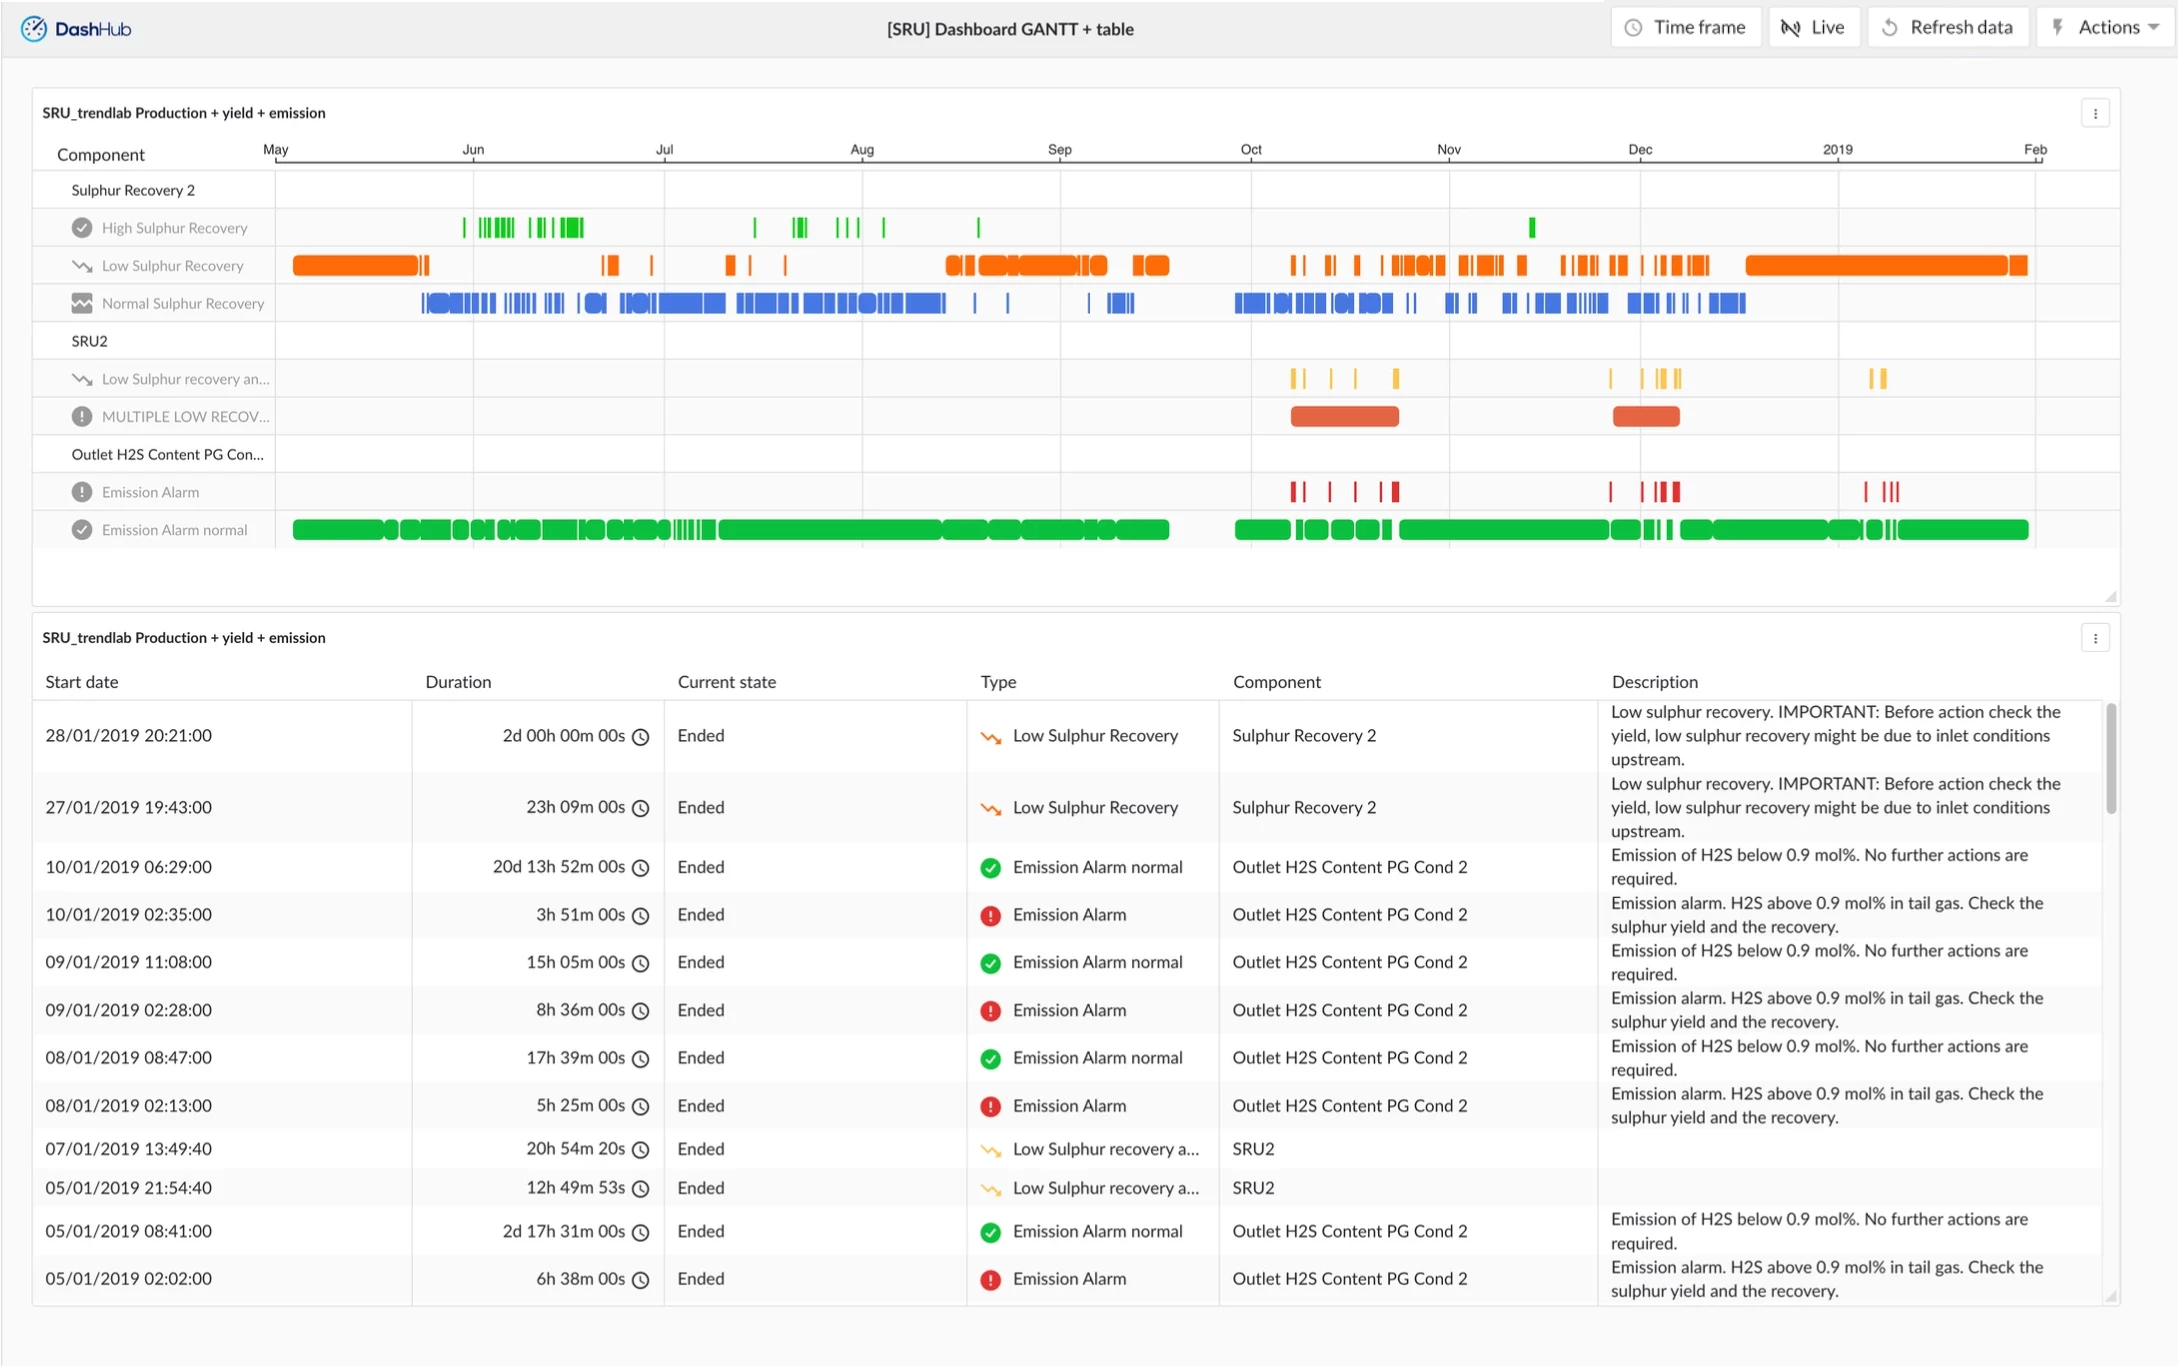
3. Add a Gantt chart tile on a dashboard
Next, we will visualize the filtered production events in a dashboard. Open DashHub and create a new dashboard. From the left side panel, you can add a Context view tile to display the Gantt chart we prepared in the previous step.
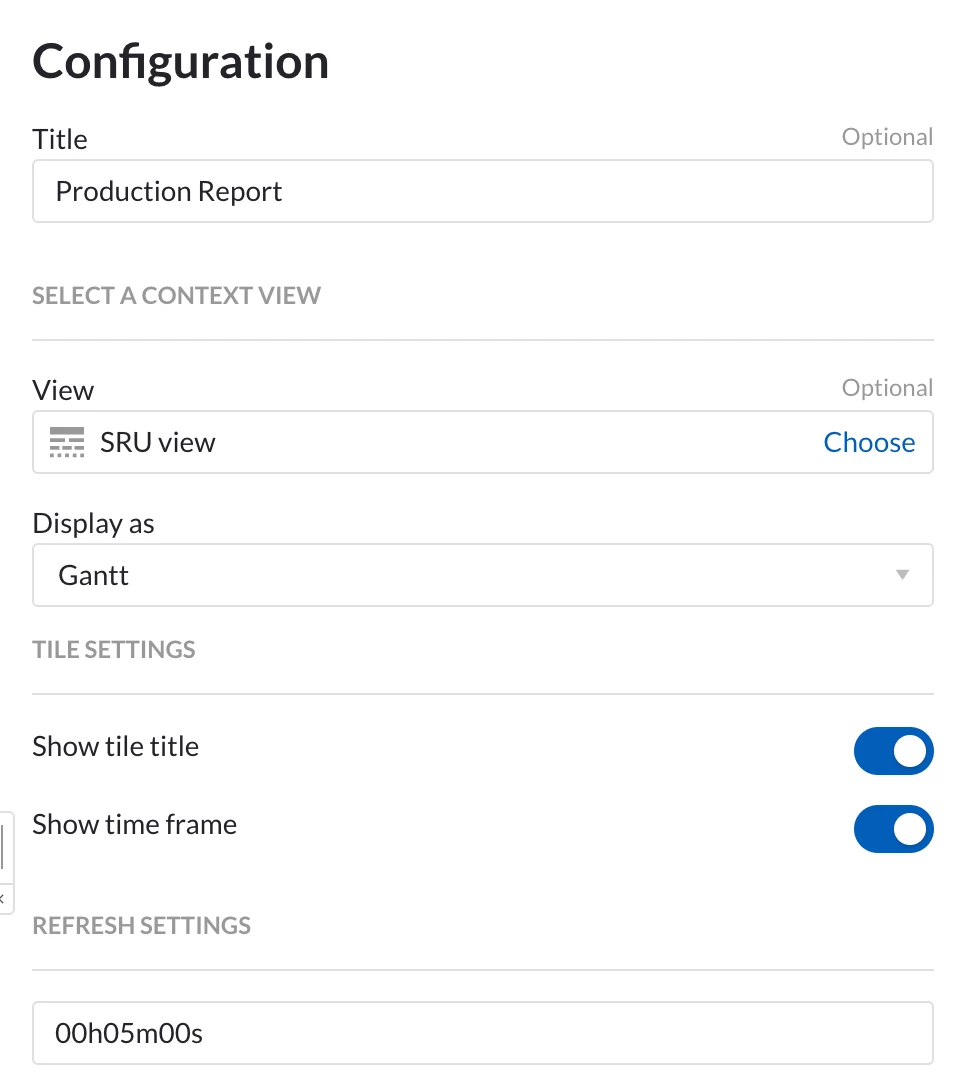
For our use case:
-
Set the title of the tile to “Production Report”.
-
Choose to display the tile as a Gantt chart.
💡 Rinse and repeat
The workflow above can be executed for multiple timeseries we want to monitor.
4. Configure new Context Types (Optional; Admin rights)
The context item types “Anomaly” and “Operational” are pre-configured. New context types can also be
configured by an administrator of TrendMiner within your organization.