

📌 Background
In batch processes in the process industry, quality fluctuations occasionally occur—for example, in the form of low concentration in the end product. These "bad batches" lead to increased waste, uncertainty in process control, and additional analysis effort. Often, it is unclear what exactly causes these deviations.
📌 Objective
This article demonstrates how TrendMiner’s Event Analytics can be used to identify the root causes of poor batch quality. Value-based search, calculated KPIs, and graphical evaluations are employed.
🎯 Challenge
How can all relevant batches of a product type be systematically identified, meaningful KPIs calculated, and differences between good and poor-quality batches visualized using Event Analytics?
🛠️ Solution
1. Load tags
First, load all relevant process data (e.g., pressure, temperature, concentration, fill level, dosing behavior) into TrendHub.
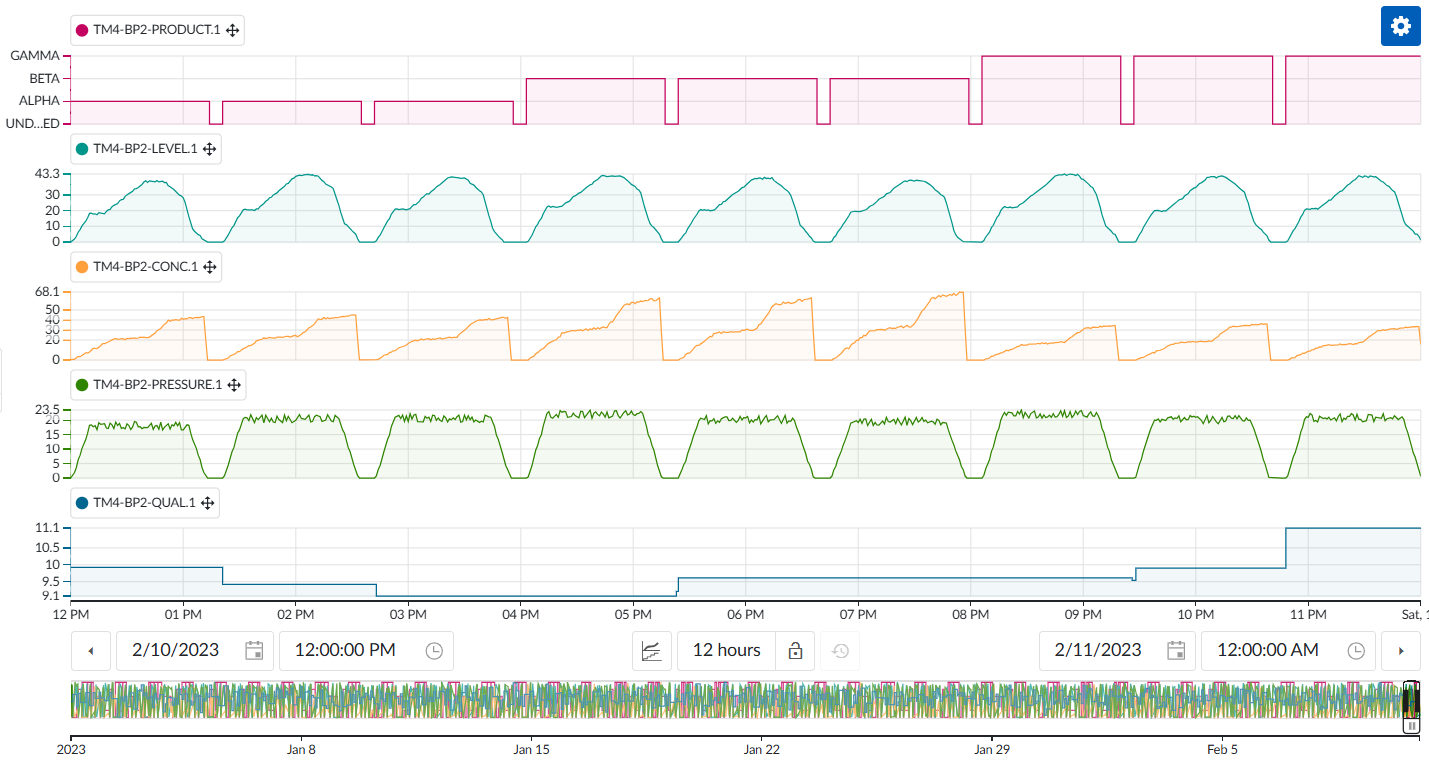
2. Define time interval
Limit the time window to the relevant period to focus the analysis on productive operation only.
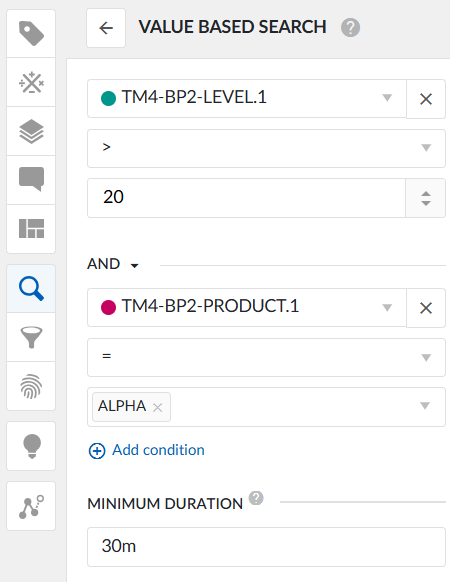
3. Perform value-based search
Example search conditions: Product = ALPHA and Level > 20, to exclude start-up and shutdown phases and focus on steady-state batch periods.
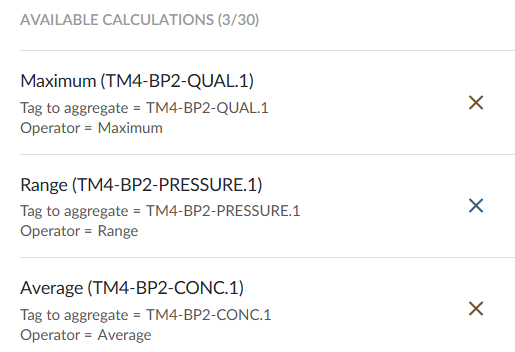
4. Calculate KPIs
Use result-based calculations to define up to 30 KPIs. For example:
-
Maximum quality
-
Pressure range
-
Average concentration
Additional possible calculations:
-
Average temperature
-
Flow fluctuations
-
etc.
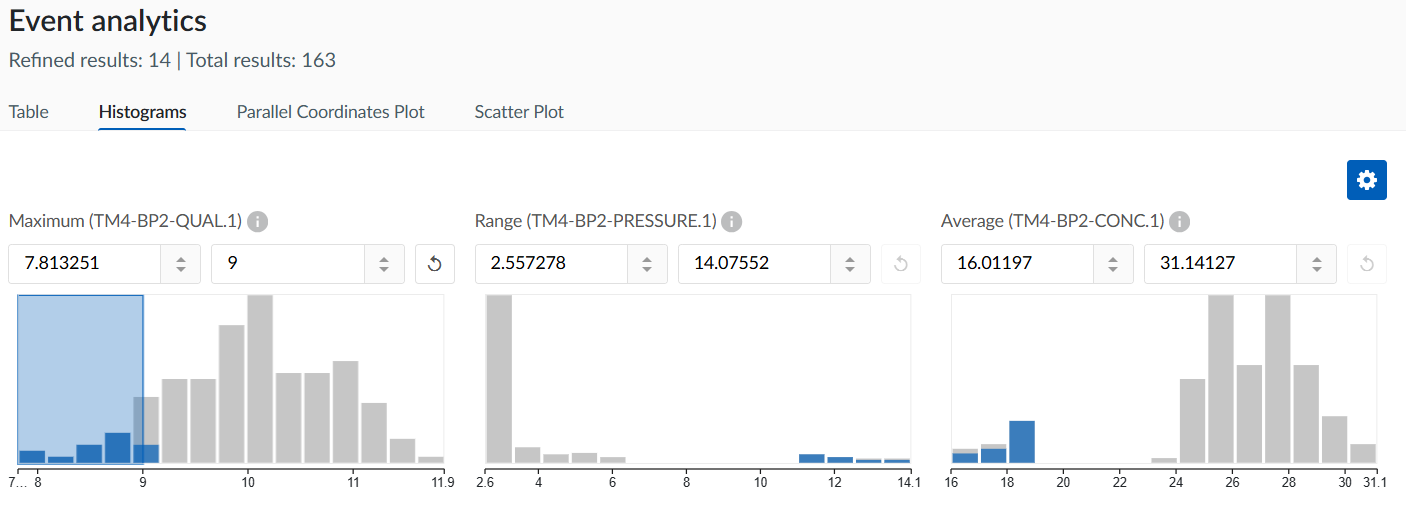
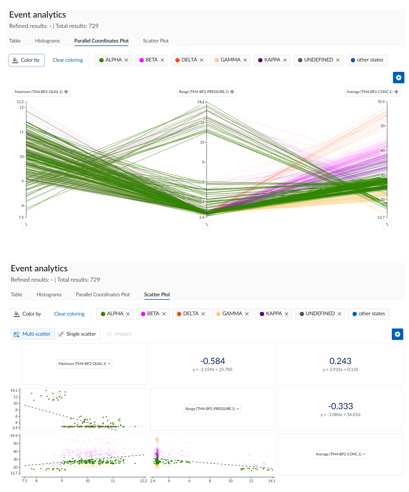
5. Conduct Event Analytics
The calculated KPIs are then analyzed using different visualizations:
To define good vs. poor-quality batches in this example, ALPHA batches must have a maximum quality of at least 9 g/L to be considered acceptable. Anything below this threshold is categorized as a bad batch.
-
Histograms: Show the distribution of specific KPIs for good vs. poor-quality batches.
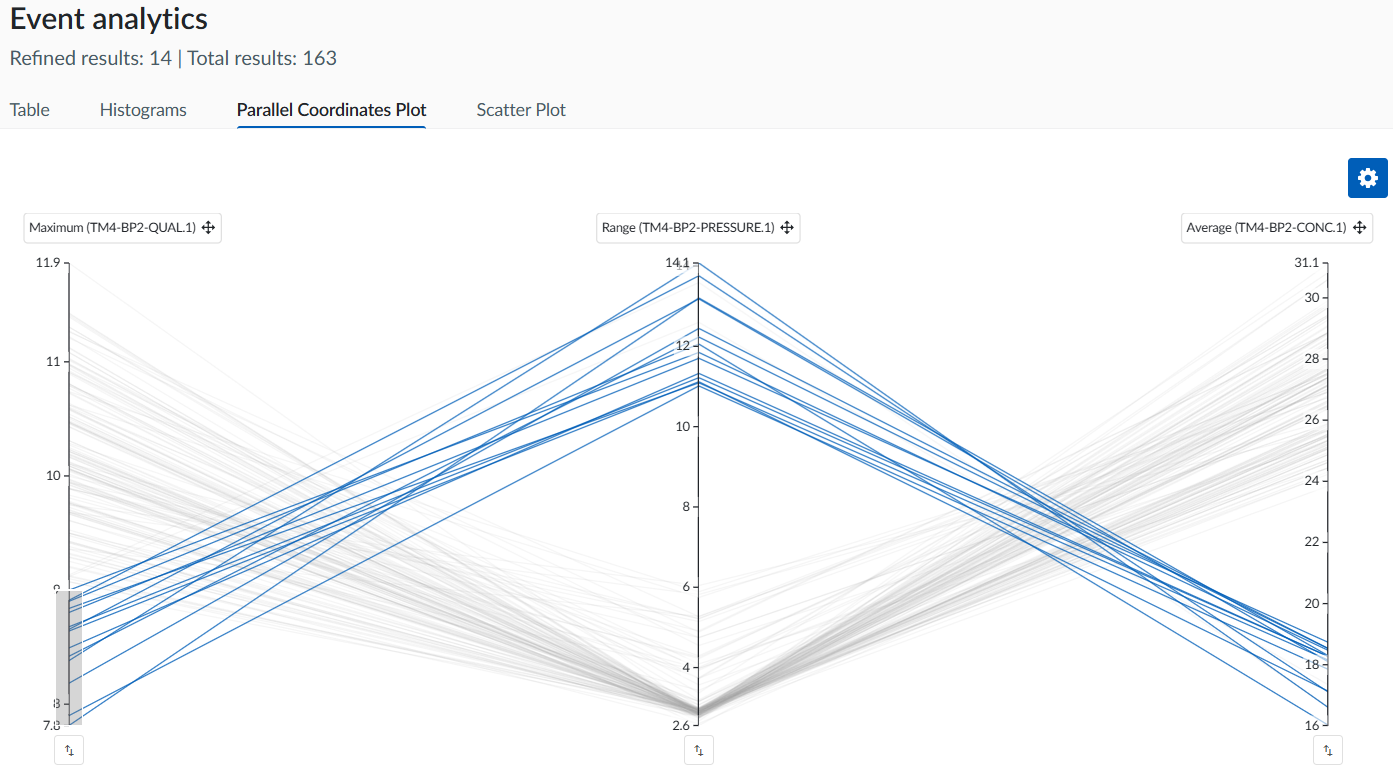
-
Parallel coordinates: Enable multidimensional comparisons between events.
-
Scatter plots: Reveal correlations, e.g., between concentration and pressure behavior.
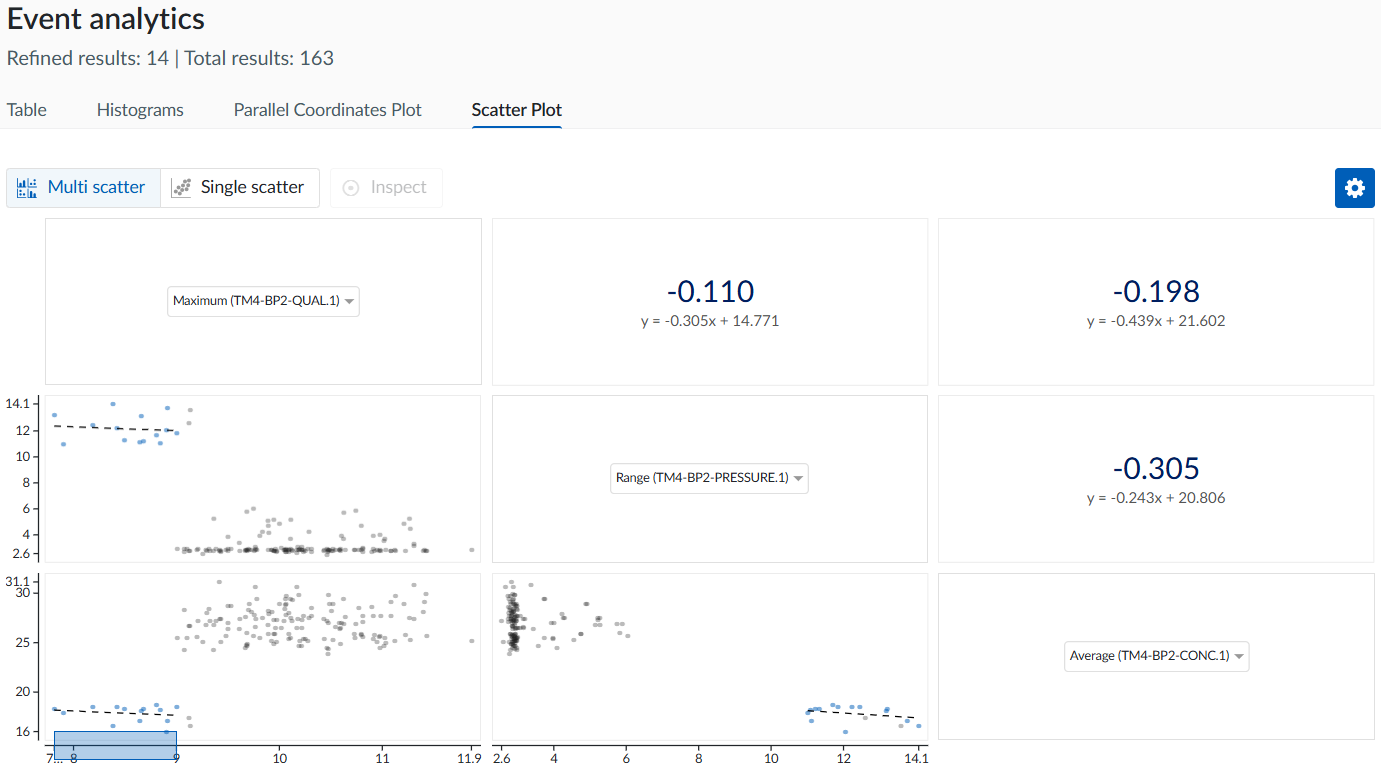
Example insight: The pressure range is systematically lower in bad batches—a clear indication of pressure losses during production.
🧰 Event Analytics Feature Overview
-
2023.R1.0 Refinement of search results (graphically refine on search result calculations and duration)
-
2024.R1.0: Enhanced parallel coordinates with more customization options
-
2024.R3.0: Introduction of scatter plots in Event Analytics – allows correlation analysis between calculated properties
-
-
Table view in Event Analytics
-
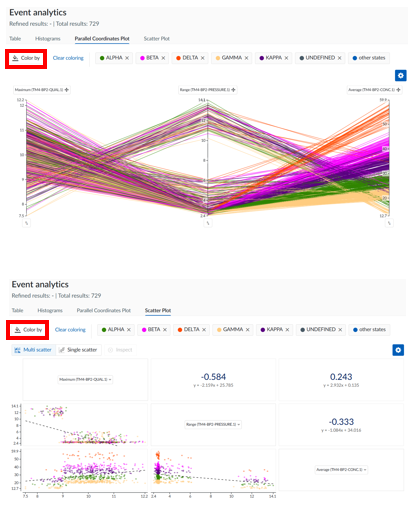
Color coding of points based on string values (e.g., product type)
-
Start and end time added as new properties to visualize drift or step changes
-
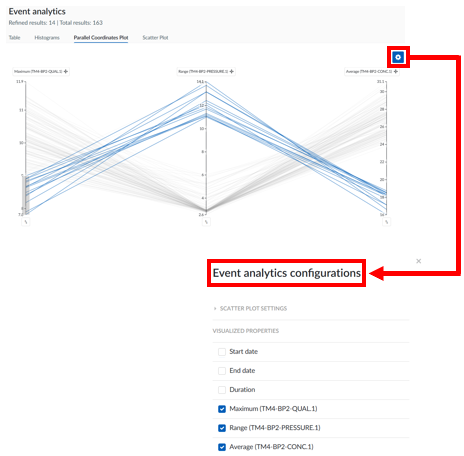
Ability to limit displayed properties per visualization
-
🔹 Pro Tips
-
Use the gear icon to configure visualizations in Event Analytics individually.
-
Color coding based on string values allows clear distinction, e.g., by product type.
-
In parallel coordinates and scatter plots, hover over individual lines or points to highlight them.
💬 Discussion How do you use Event Analytics in your batch processes—or in other types of processes? What additional features would you like to see?
As this is a highly requested topic, the TrendMiner team is continuously working on further improvements.
🚀 Share your ideas and experiences in the TrendMiner Community!