

Background
Fluctuating process parameters in the chemical industry present a significant challenge as they can impact the efficiency and quality of production. These variations can be caused by inaccurate measurements, unstable raw material quality, or insufficient process controls.
For instance, Torque fluctuations in machinery may lead to mechanical damage, compromising operational safety. Temperature fluctuations in reactors can affect reaction kinetics, resulting in inconsistent product quality. Likewise, pressure fluctuations in pipelines or reaction vessels can affect product consistency and equipment safety.
Challenge
Managing fluctuating process parameters may require setting and monitoring thresholds, tracking the range of variations, and creating context items. TrendMiner simplifies this by allowing users to define and oversee limits, measure fluctuations, and visualize all relevant data on a dashboard.
Solution
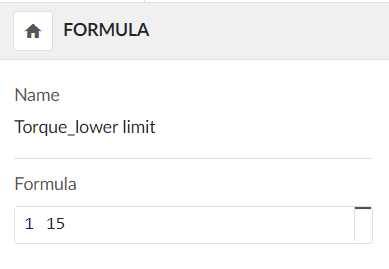
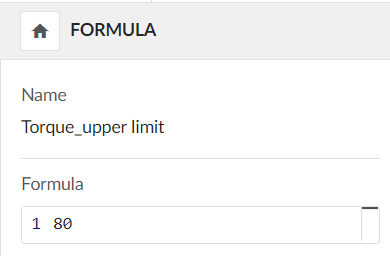
- Defining upper and lower limits
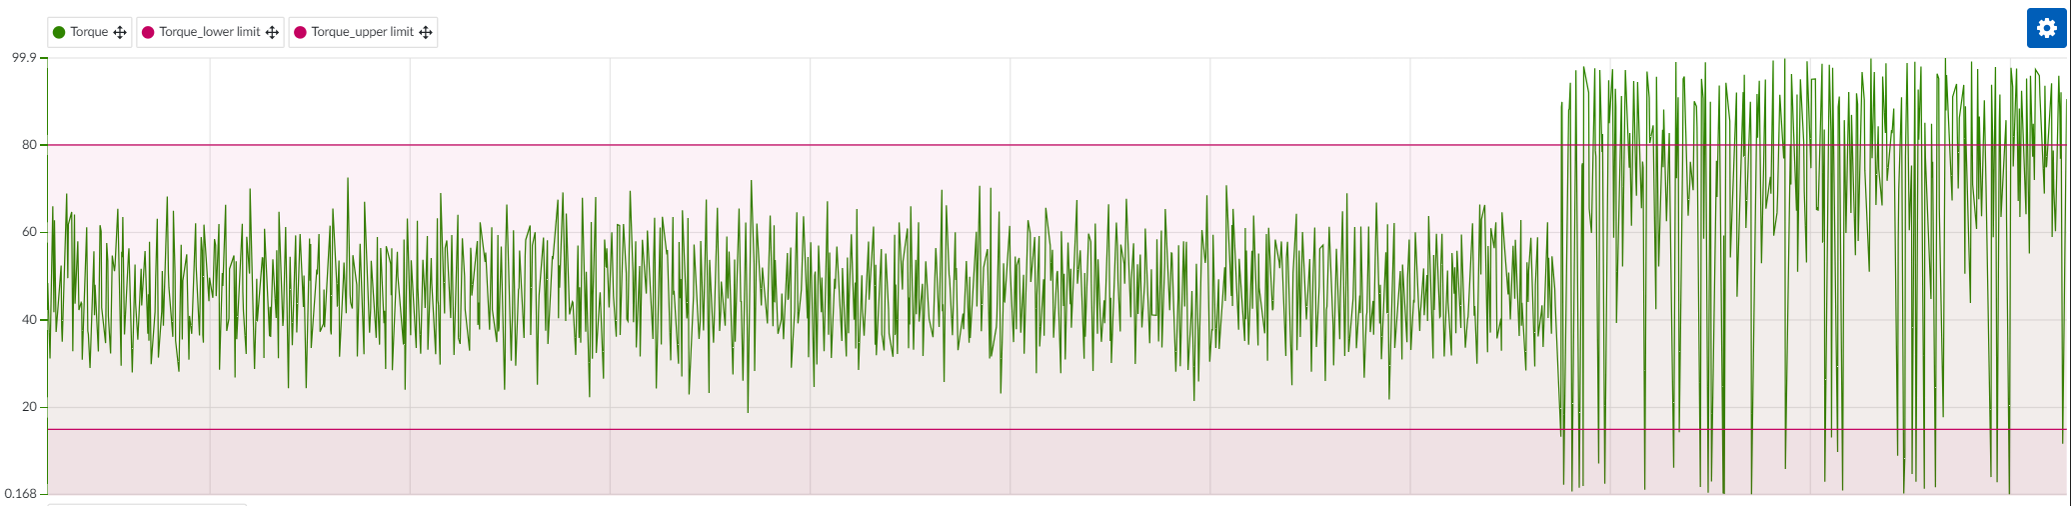
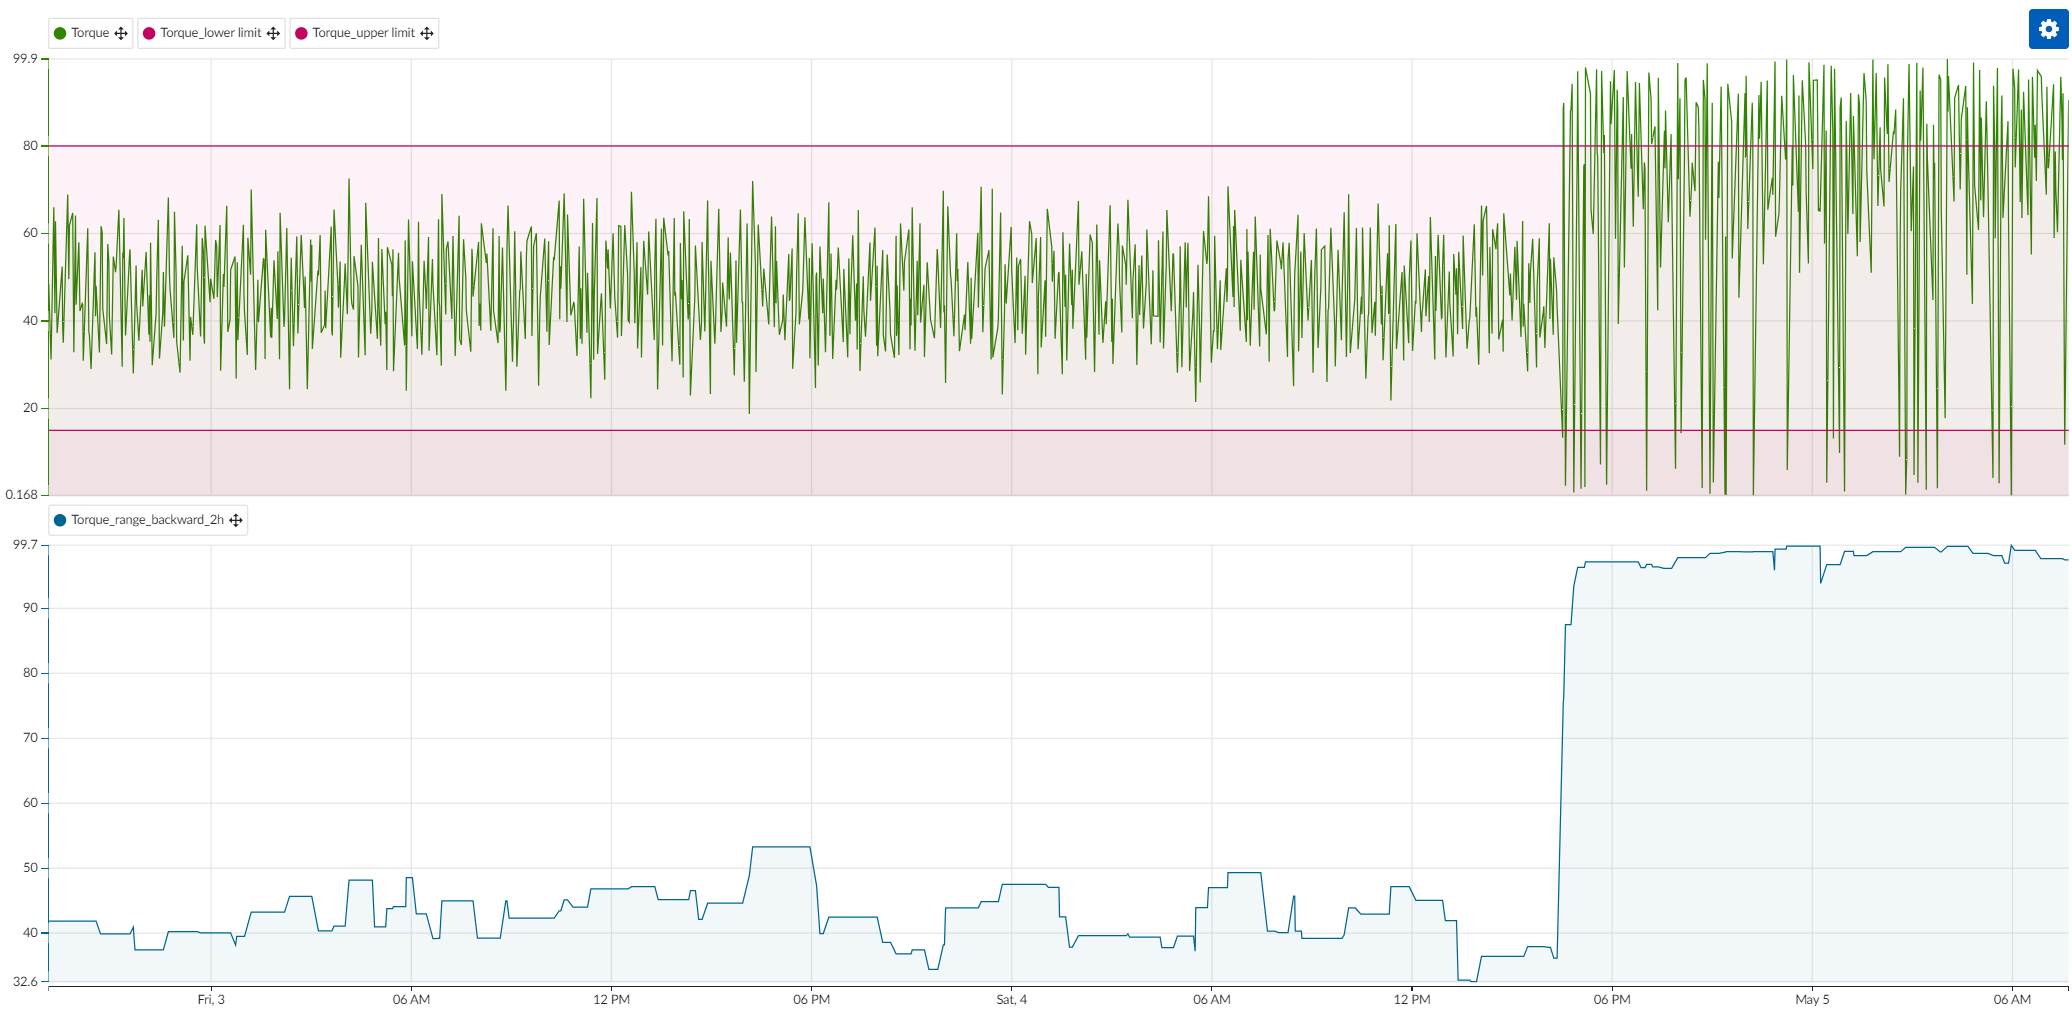
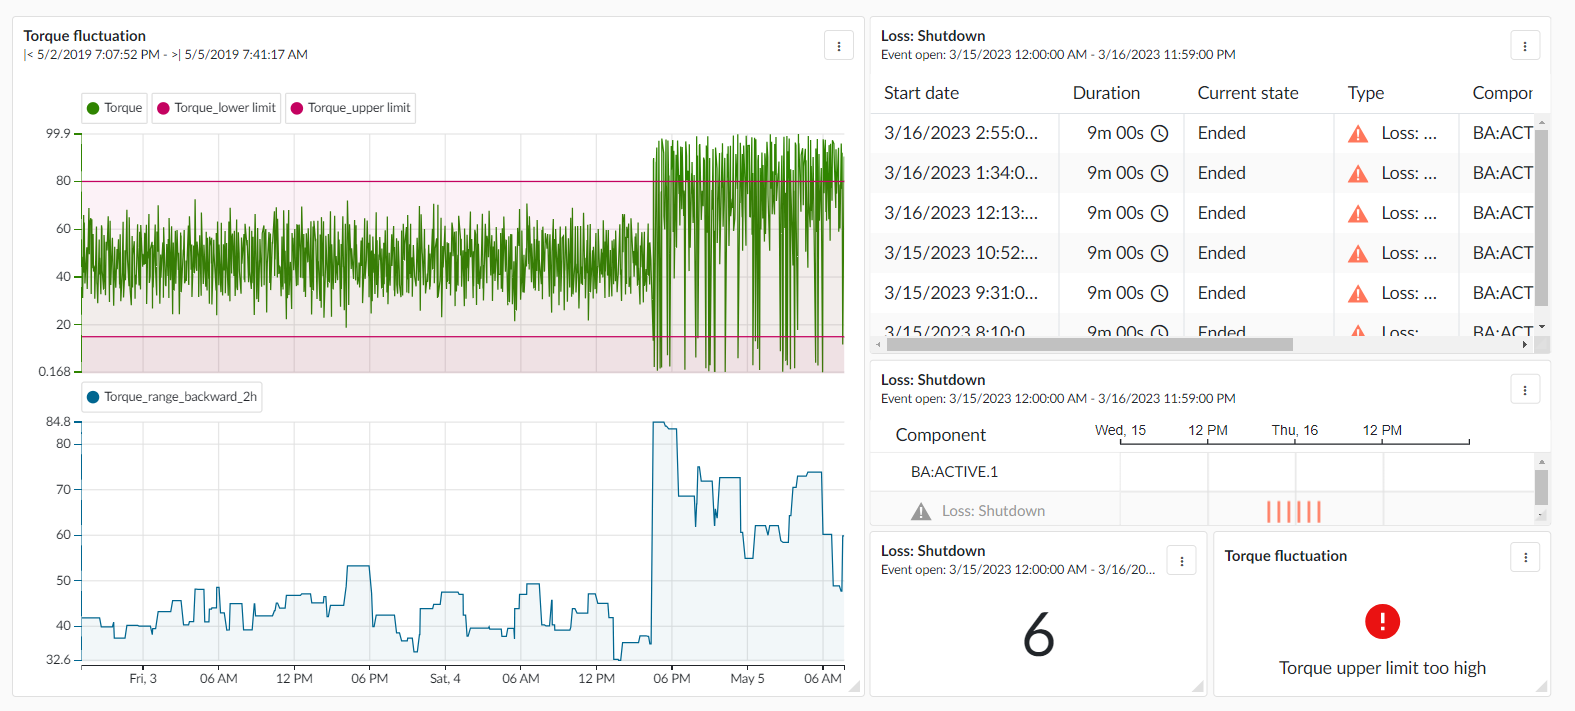
In this step, upper and lower torque limits are established using a formula. For instance, formula 1 defines the lower limit as 15, while formula 2 sets the upper limit at 80. These values can be easily visualized in a chart by grouping the tags, providing a clear and organized view of the limits.
- Measuring the range of fluctuating process parameters
Understanding the extent of fluctuations in process parameters is crucial, as increasing variation - in torque, for example - can lead to potential equipment damage or other issues like inconsistent product quality. To capture this range, you can create a new tag using aggregation, which records the range over a specified time period. This allows for a precise assessment of parameter variability, helping to identify and address potential problems early.
- Monitoring critical fluctuating process parameters
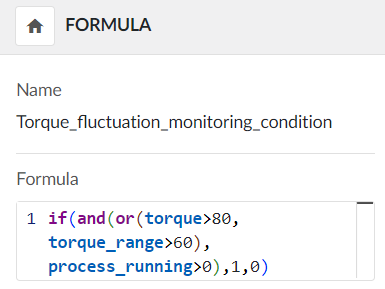
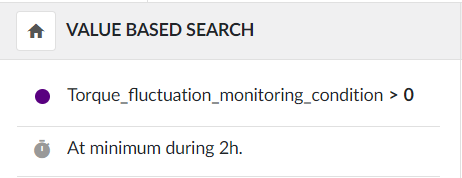
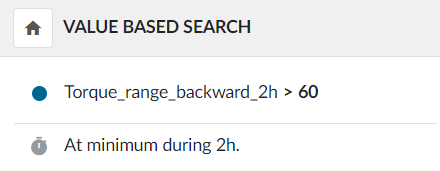
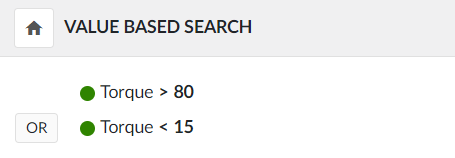
It can be beneficial to incorporate additional conditions into your monitoring strategy, such as ensuring the process is active or focusing on specific products. To monitor threshold breaches or fluctuations effectively, you can perform value-based searches and apply any additional conditions as needed. Alternatively, you can create a formula to link conditions together and then use this formula as the basis for your value-based search. Once conditions are defined and searches are saved, monitoring can be easily activated from the monitoring menu based on these configured searches.
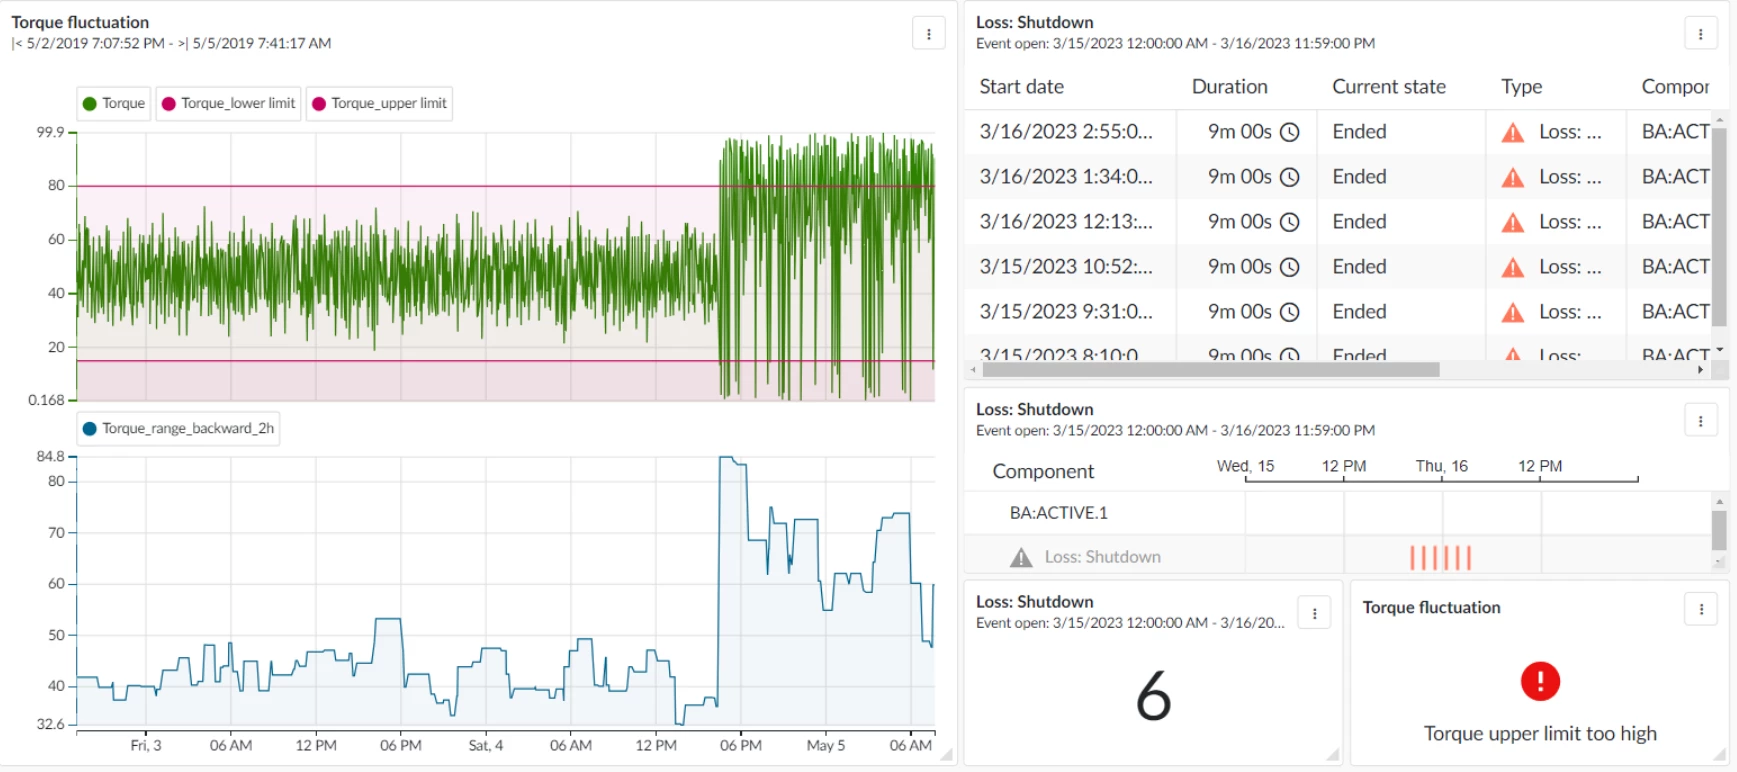
- Setting up context items and creating an overview dashboard
To effectively track and visualize your analyses, you can create context items. These elements improve the clarity of your data and make it easier to display on dashboards. This contextual information can then also be visualized as a tabular view, as a counter or as a Gantt chart. For past events, context items can be generated from, for example, value-based searches. For future events, context items can be activated directly in the monitor.
All these analyses can then be visualized on an overview dashboard, incorporating elements such as TrendHub and ContextHub views, monitor tiles, and current value tiles.
Value
TrendMiner delivers value by providing real-time insights through threshold monitoring, variation tracking, and context item creation. The visualized data on a comprehensive dashboard facilitates rapid issue detection and informed decision-making, leading to enhanced process stability, reduced downtime, and improved product quality.