Knowing how certain settings impact our main KPIs is key in fine-tuning a process to drive
productivity. Such a feat can only be accomplished by actually measuring the relevant KPIs in a
comparative study.
In this use case, you will see how you can very quickly assess the impact of process conditions on a
given KPI during a selected period.
- process conditions: equipment on/off, product grade, day of the week...
- KPI: energy usage, setpoint deviations, total production, ...
- period of choice: the period you currently have on your focus chart
An example would be assessing the impact our Advanced Process Controller (APC) has on the average
deviation of our Process Value (PV) from our Setpoint (SP). Is it actually doing its job in reducing the
average deviation?
Step 1 - Defining the KPI
Assuming we don't already have a KPI tag, we will need to use a formula to calculate the KPI we want.
In the case of APC performance, a typical KPI would be the absolute value of the difference between a process value and its setpoint.
Step 2 - Filtering on process conditions
We can create a filter for every process condition for which we want to determine the influence on the KPI. We can do this by first performing a value based search on these process conditions, and then saving that search to create a derived filter from that search that filters out everything that does not comply with our search criteria. This filter allows us to do operations on our KPI tag only when given process conditions are true. These steps need to be repeated for every set of process conditions for which we want to quantify our
KPI.
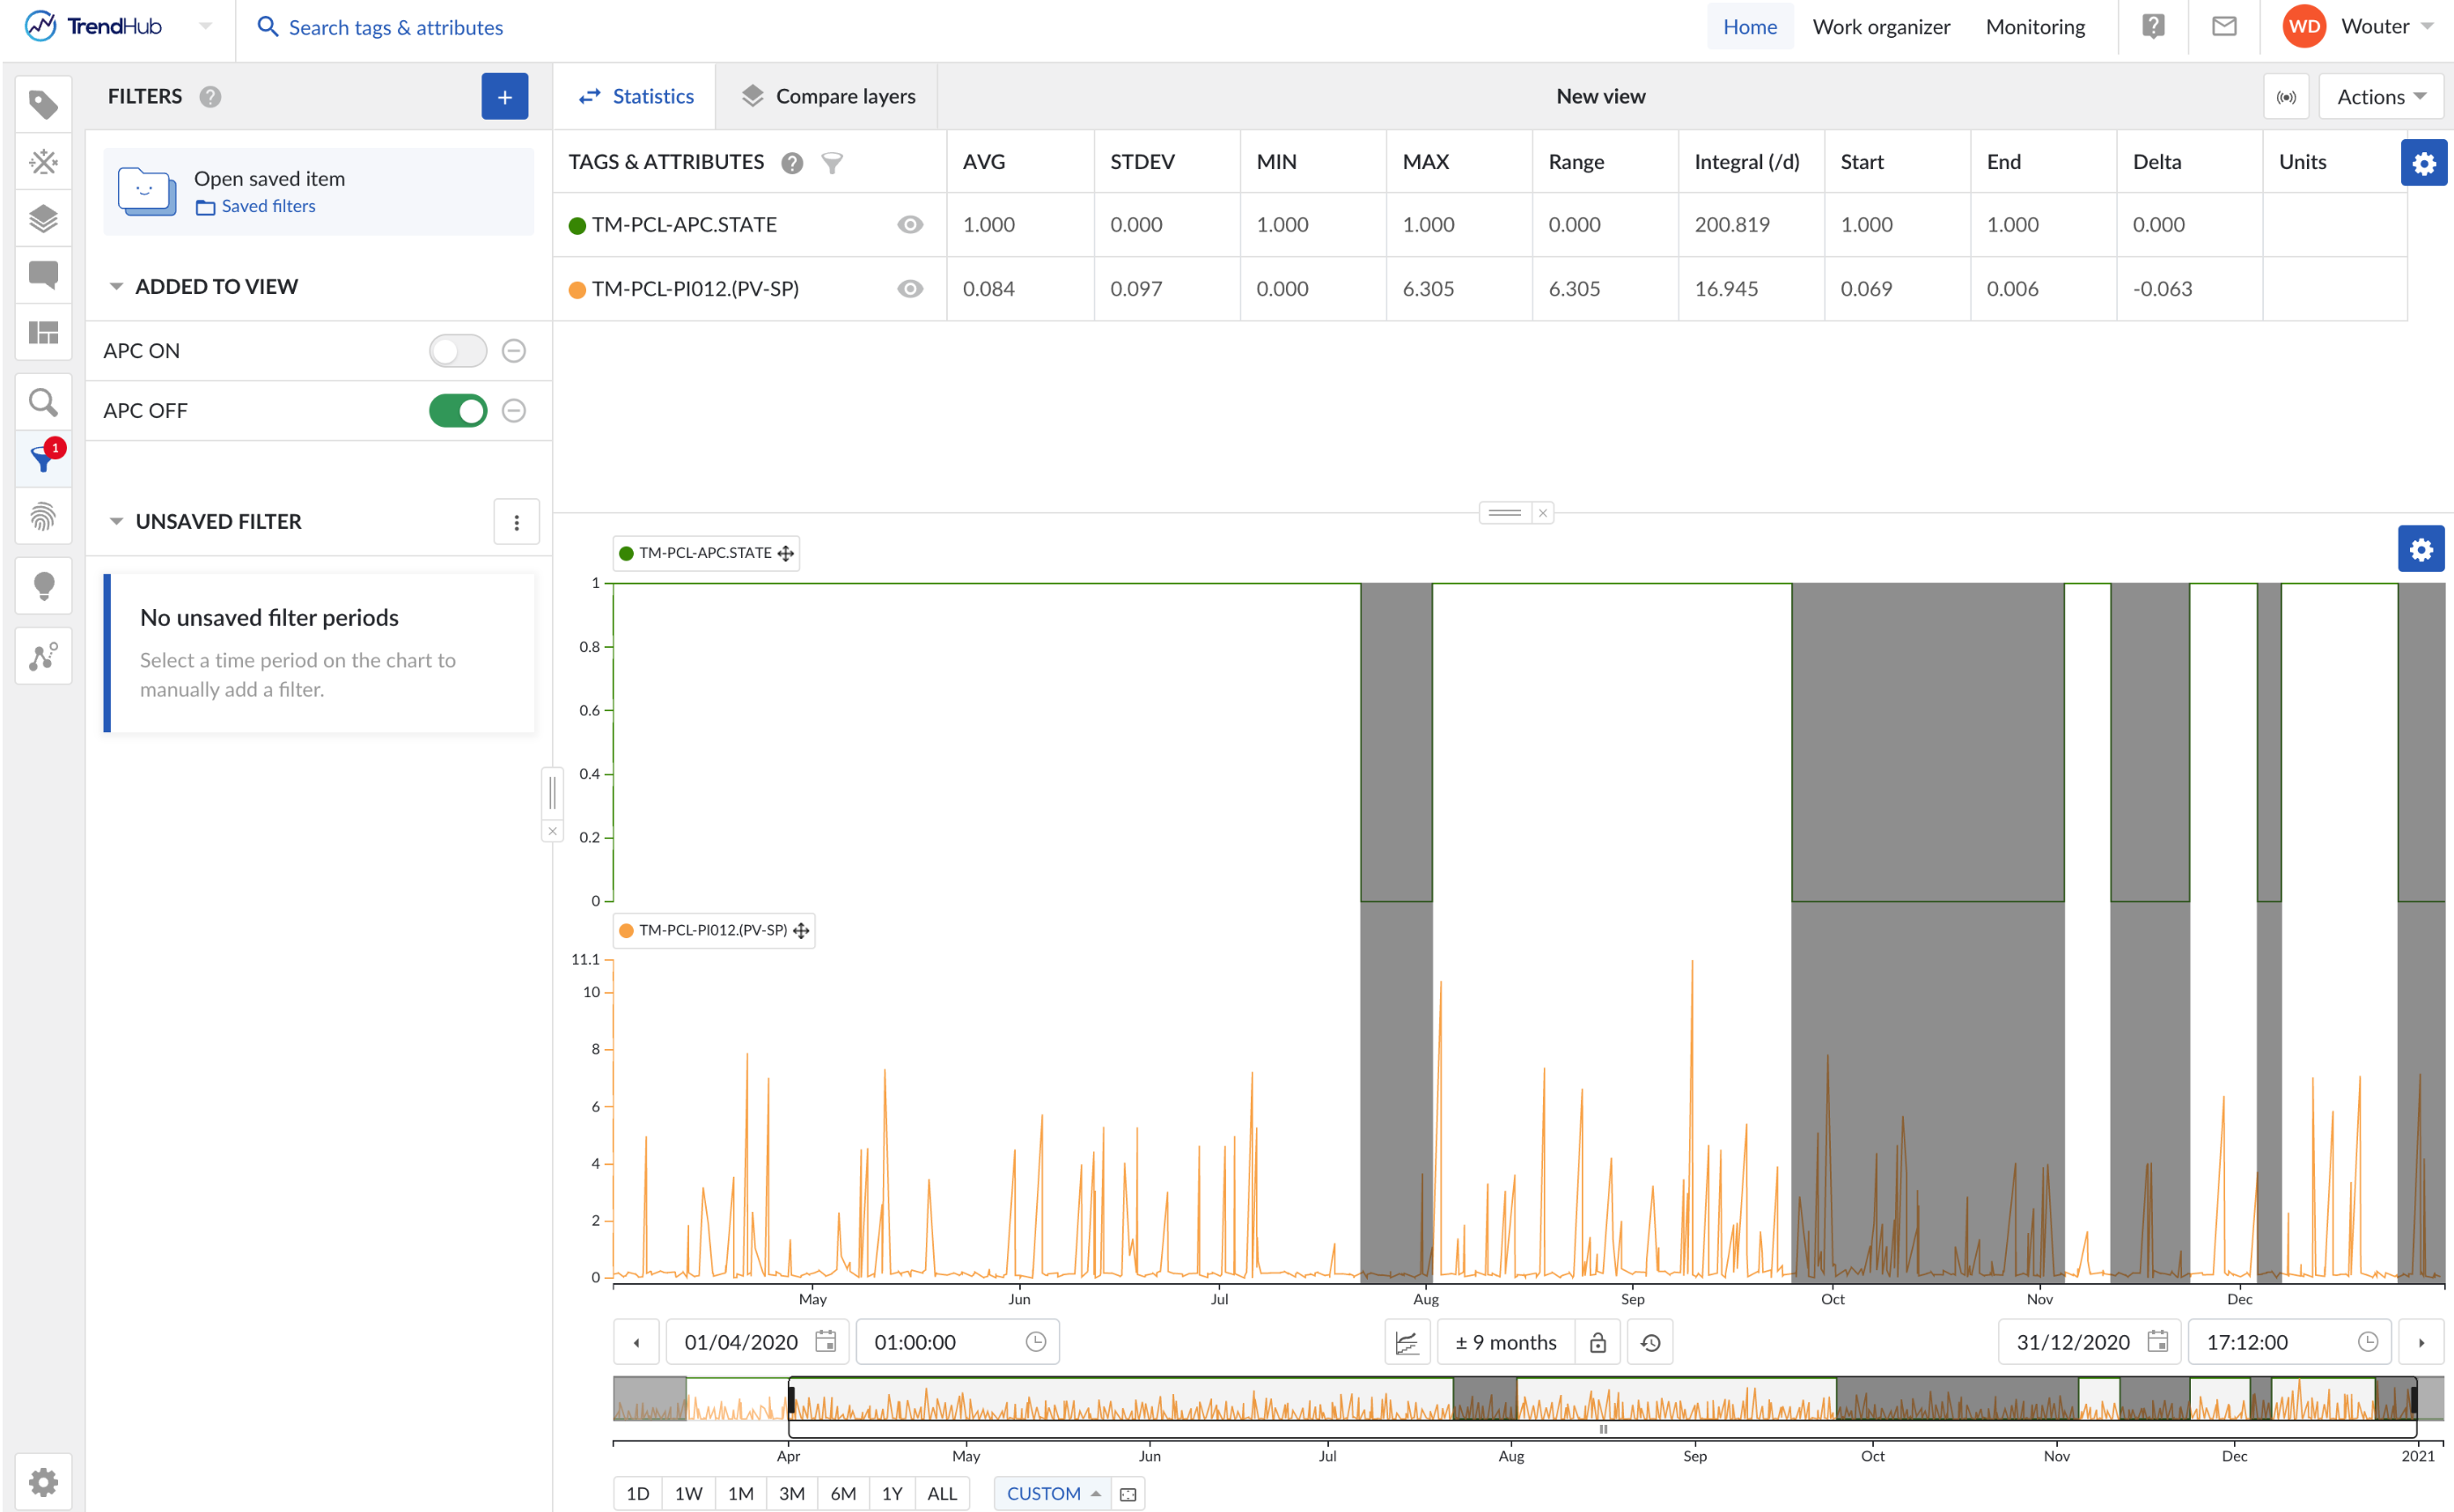
For our APC controller, let's suppose we have a discrete tag telling us whether our APC is on or off. We
can thus simply create two filters: one that filters for the APC being on, and the other for the APC being off.
Step 3 - Calculating the average of the KPI
With the statistics table, you can take the average value of your KPI tag, for the period you have
selected in your focus chart. These calculations take your filters into account, so we can see how the average KPI values change as we toggle our different filters.
When we calculate the average absolute deviation of our process value from its setpoint for a period of
a few months, while filtering first for APC=ON, and then for APC=OFF, we can clearly see the average
deviation is lower when it is on. A job well done!