

Background
The final product dosing process relies on a tank with rotors, maintaining a constant level and rotors speed during production, but level drops significantly when changing products. This drop in tank weight slightly reduces dosage, potentially leading to customer complaints about low product weight.
Operators manually increase rotor speed during tank emptying to compensate, but monitoring this action is crucial.
Challenge
- Automatically keep track of the number of times and dates when emptying happens and whether or not the speed of the rotors was increased, for traceability purposes.
- Create a daily dashboard to be used during operating meetings
- Only emptying events of more than 15mins are relevant.
Solution
- Create aggregations: Range of the rotors and Max of the tank level in the last 20m.
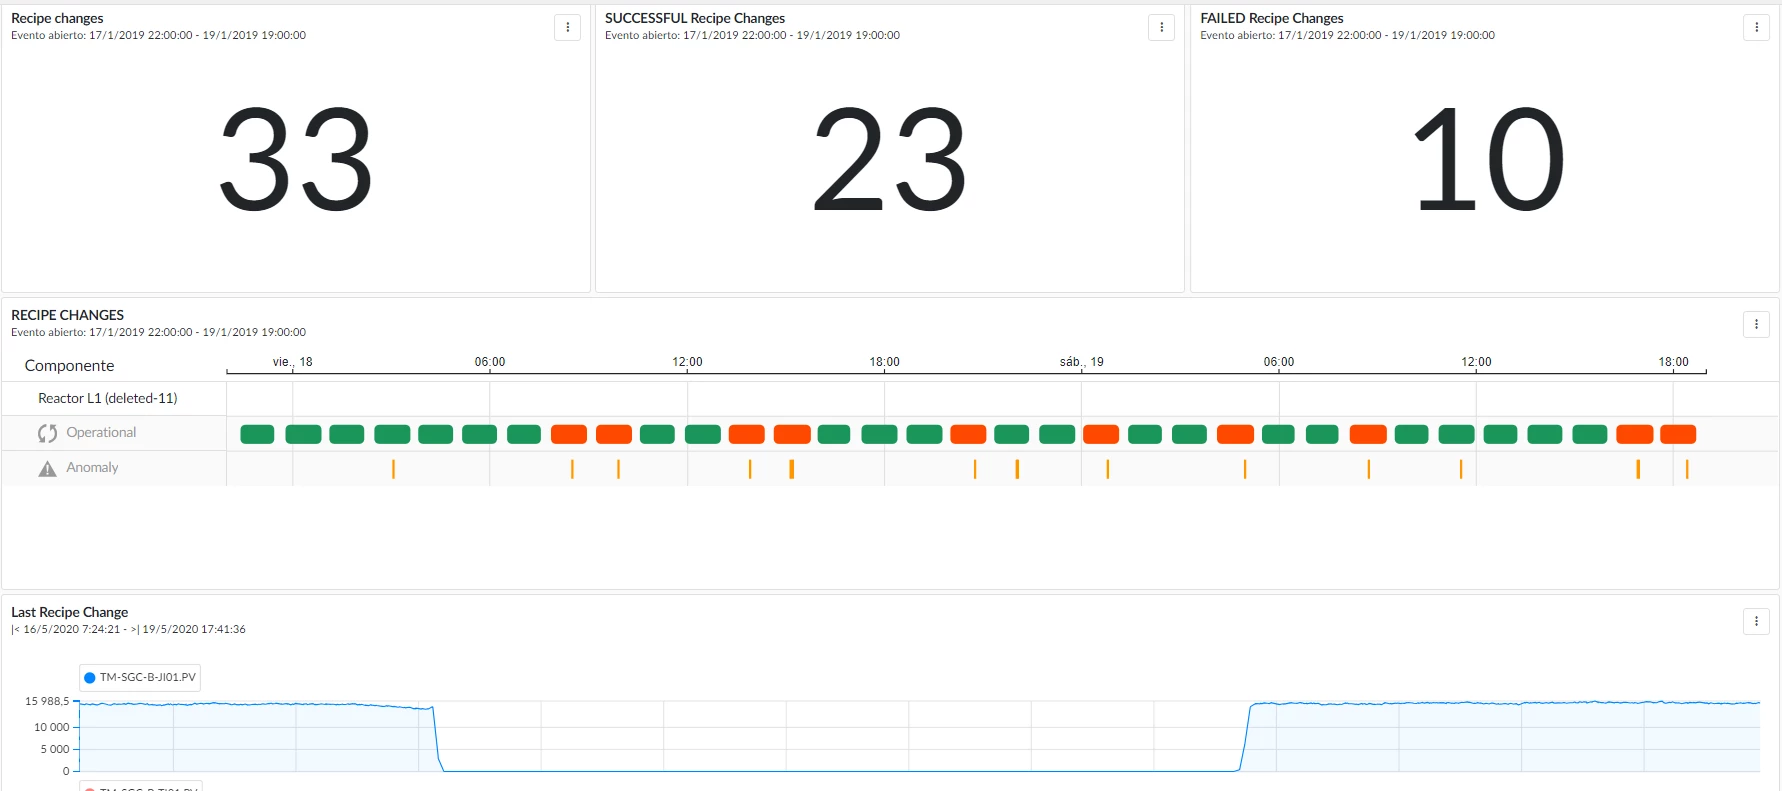
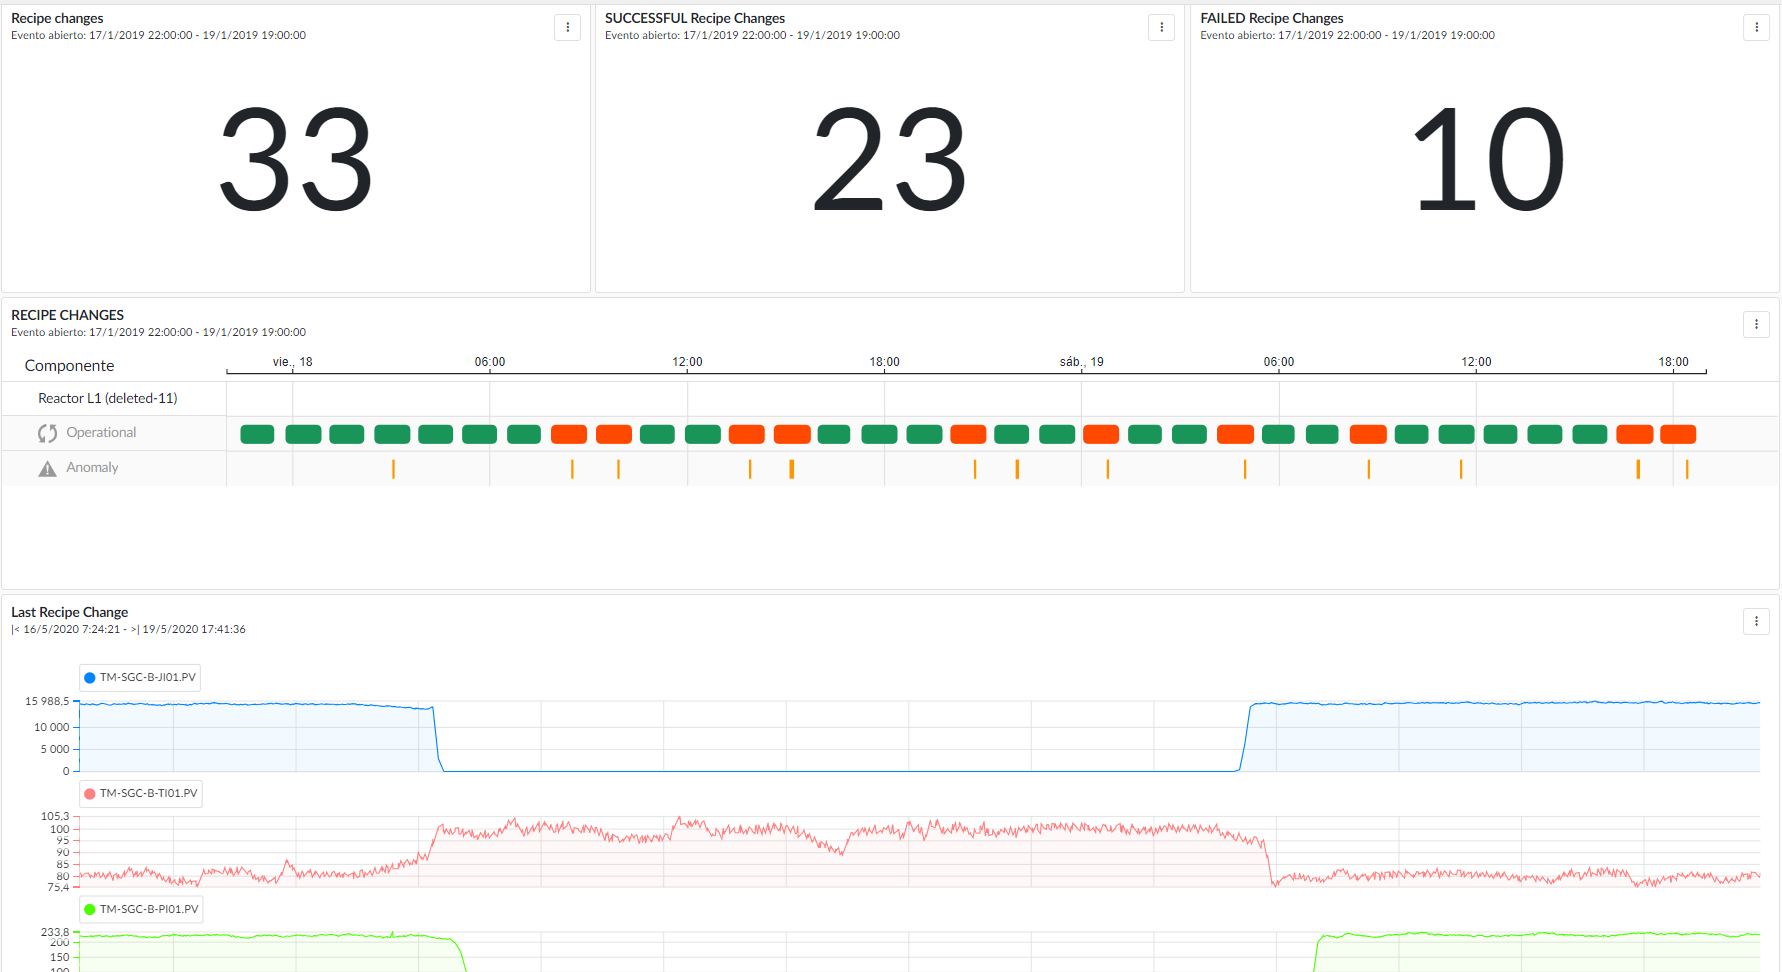
- Value Based Search for good and bad emptying periods of at least 15m: max level>60 & current level<50 + (rotors range>0/range=0).
This search will find periods where the tank used to be full in the last 20m but now is dropping (recipe change). Those changes where the rotors range is higher than 0 means that operators changed the value to a higher speed. If range is equal to 0, the value didn’t change and, thus, could cause weight complaints. - Automatically contextualize those good and bad recipe changes.
- Create a dashboard with counters of good & bad events, trends and current values of the main variables.
Value
- Detect quality losses, leading to improve the quality of the product
- Reduction of customers complaints: 37% of low weight complaints reduced
- Traceability improvement
- More efficient data analysis and reporting