
Background
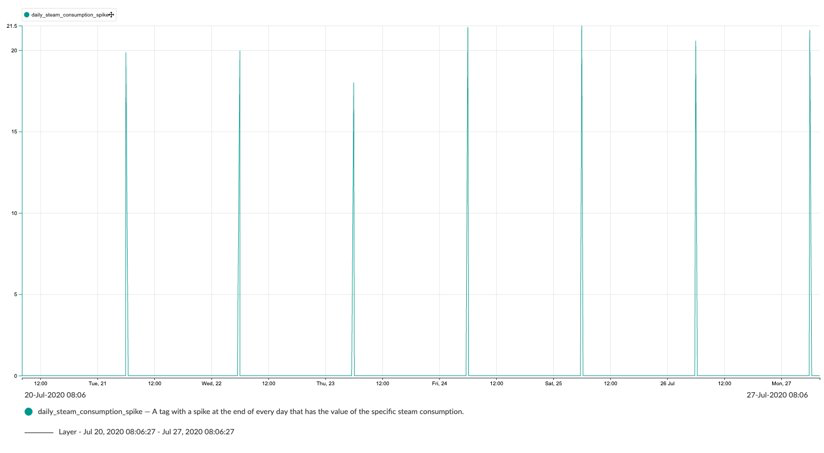
This use case shows how to report the daily specific consumption of a resource and make a comparison between them on a daily basis. At this point we have no way of comparing or keeping track of the specific consumption of a resource. If we would have a tag for this it would be a big help in terms of process and resources optimization, as well as bring economic value. The daily specific consumption will be reported as spikes at the end of each day. As a starting point we have a tag containing our specific consumption of the last 24h. By being able to have an overview of the spikes of all days we can optimize our process.
Challenge
1. Get a spike at the end of each day with the 24h of total consumption.
2. Get the value of different days to compare them.
Solution
- Creating daily consumption spikes
The daily consumption spikes tag is created by using the formula tagbuilder, we use an if statement where the check is day1=day2 with day 1 current time tag (day) and day 2 1m delayed time tag (day) when it is true it gives back 0 and when it is false (=23h59) it gives the specific consumption of the last day.
- Comparing consumption of different days
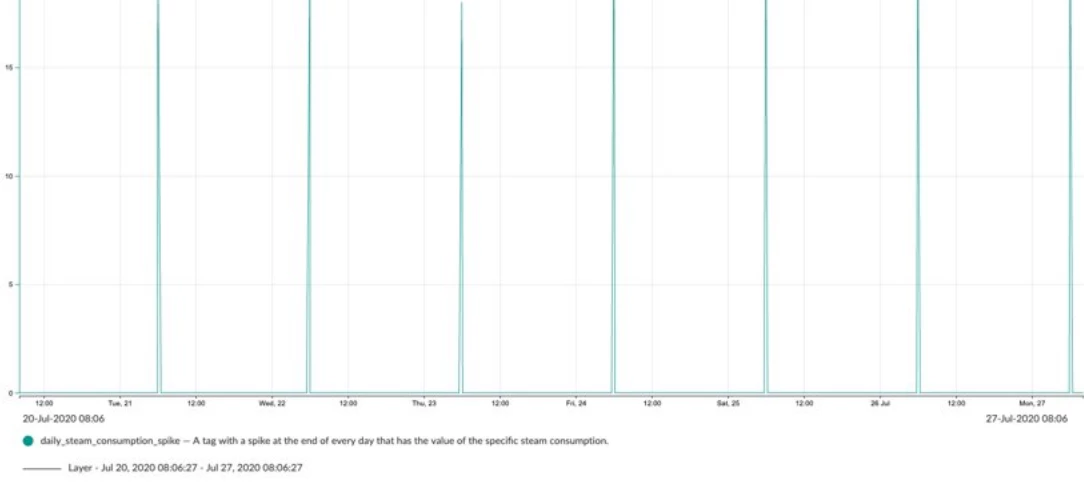
The most straightforward way of making the comparison of the specific consumption is by creating a view containing the spikes of the wanted period. This way a visual comparison can be made to see how the specific consumption of resources evolves over time.
Results and value
Keeping better track of consumption enables us to track our usage more closely, reducing the likelihood of overconsumption and fostering a more sustainable approach. This proactive management not only prevents waste but also streamlines resource allocation, ultimately leading to more efficient processes and reduced environmental impact. By optimizing consumption habits from the outset, individuals can contribute to a more responsible and mindful utilization of resources.