

📌 Background
In any industrial process, there are typically periods of optimal (good) and sub-optimal (bad) performance. Identifying and comparing these periods helps in understanding the differences and optimizing operations. By analyzing the variations between good and bad periods, process engineers can uncover key factors affecting efficiency and quality.
⚠️ Challenge
One of the main challenges in process optimization is recognizing the factors that differentiate a good period from a bad one. Some common difficulties include:
-
🔎 Identifying relevant time periods or batches in continuous and batch processes.
-
📊 Establishing objective quality metrics to categorize periods.
-
🔄 Effectively comparing periods visually and numerically to extract actionable insights.
🛠 Solution
TrendMiner provides a structured approach to compare good and bad process periods through the following steps:
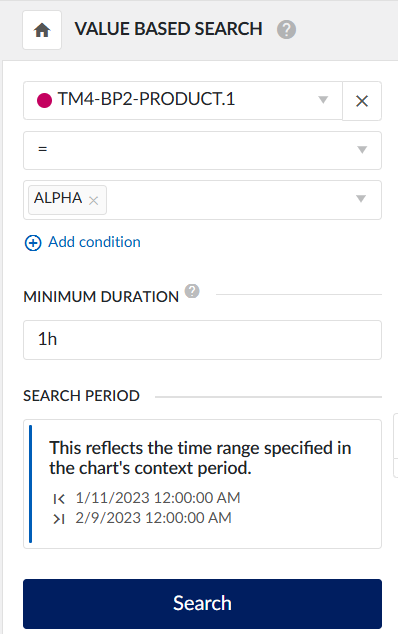
✅ 1. Feature Search
-
Use the value-based search function to find operating periods or batches.
-
For batch processes, an on-off tag can be used to detect different production cycles.
-
In continuous processes, exclude periods with downtime values to focus on operational timeframes.
-
🔹 A relevant time period can also be defined by selecting the production of a specific product to analyze its performance over time.
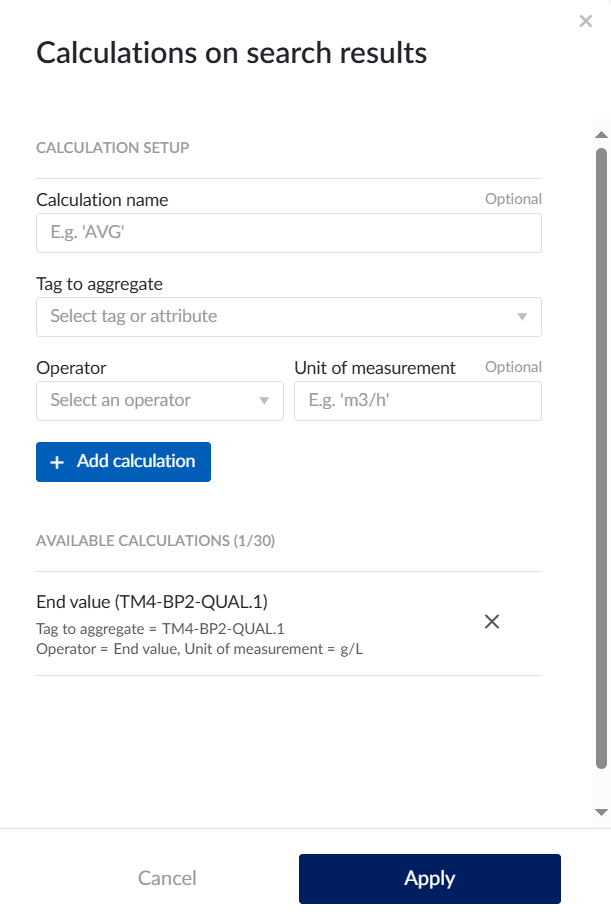
📊 2. Calculations on Search Results
-
Each identified period represents a batch or an operational phase.
-
To differentiate good from bad periods, use the “Add calculations” function to compute relevant quality metrics (e.g., total flow, maximum concentration, efficiency rate).
-
🔹 A suitable parameter could also be the quality of a specific product, helping to evaluate performance based on product-specific characteristics.
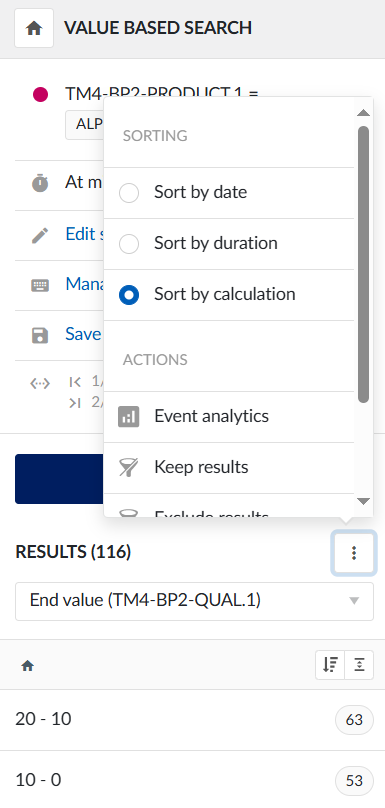
📌 3. Sorting Search Results
-
Once the quality metric is calculated, sort the results by clicking on the three dots menu and selecting “Sort by calculation”.
-
This will rank periods from best to worst based on the selected metric, making it easier to identify optimal and sub-optimal phases.
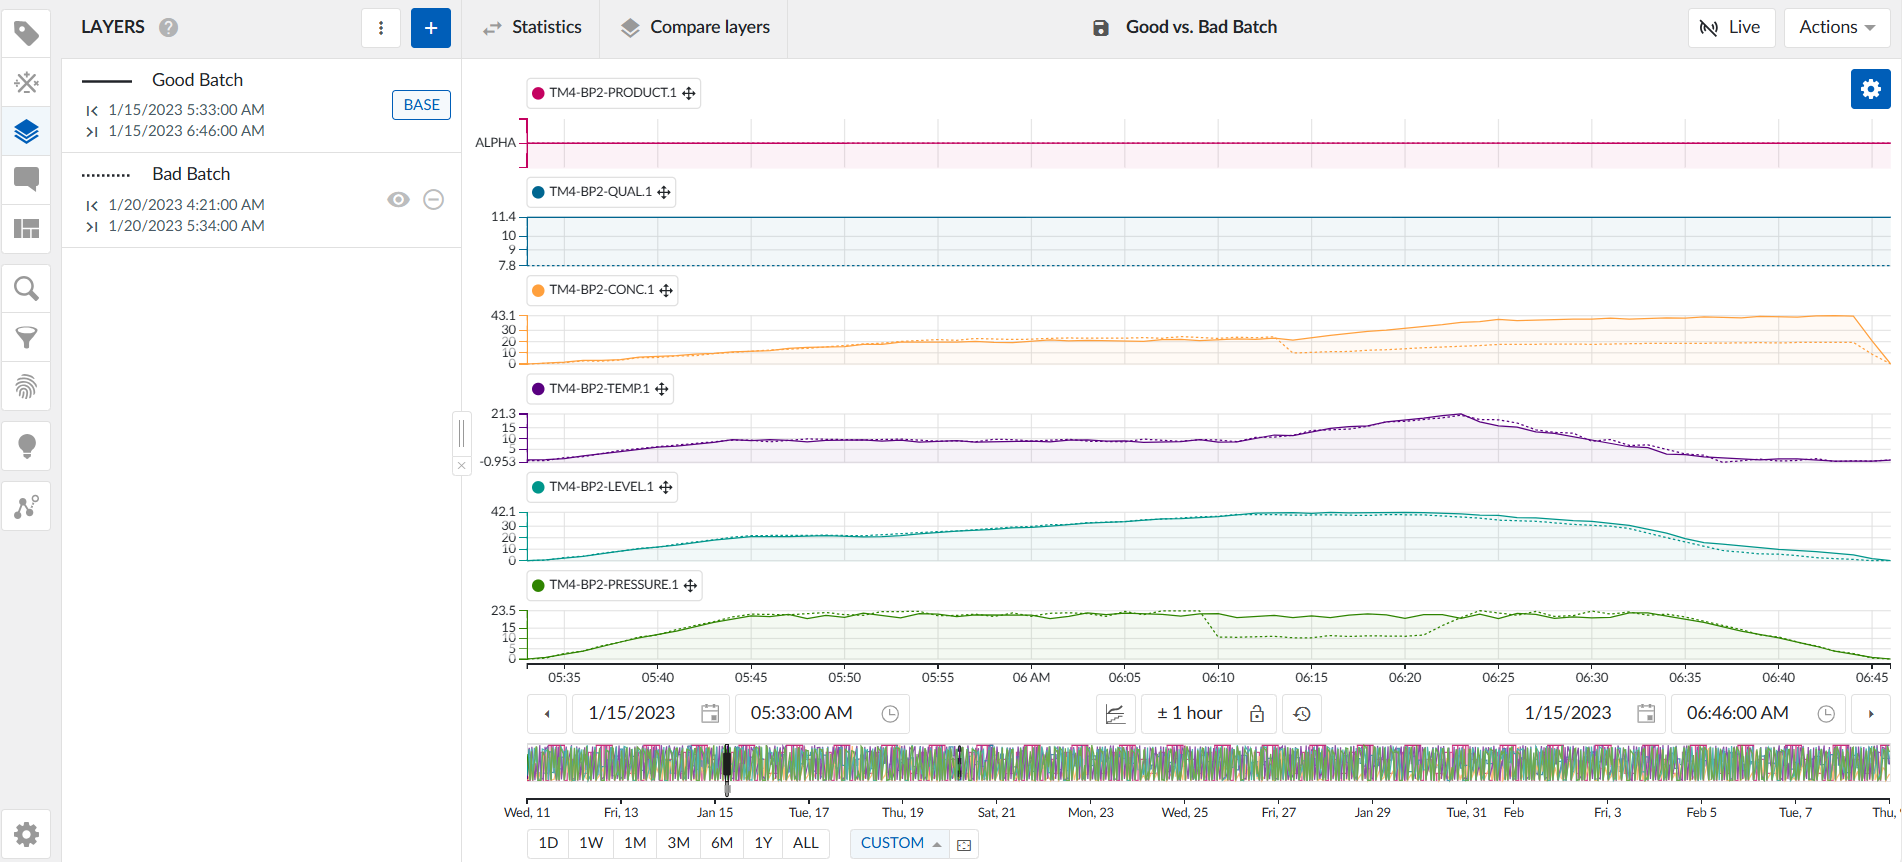
📈 4. Adding Layers to the Focus Chart
-
After identifying the best and worst periods, use “Set as base layer” for the optimal period.
-
Click “Add layer” to overlay the sub-optimal period for direct visual comparison.
-
Multiple good and bad periods can be layered, and descriptive names can be assigned to each in the Layer menu to maintain clarity in comparisons.
-
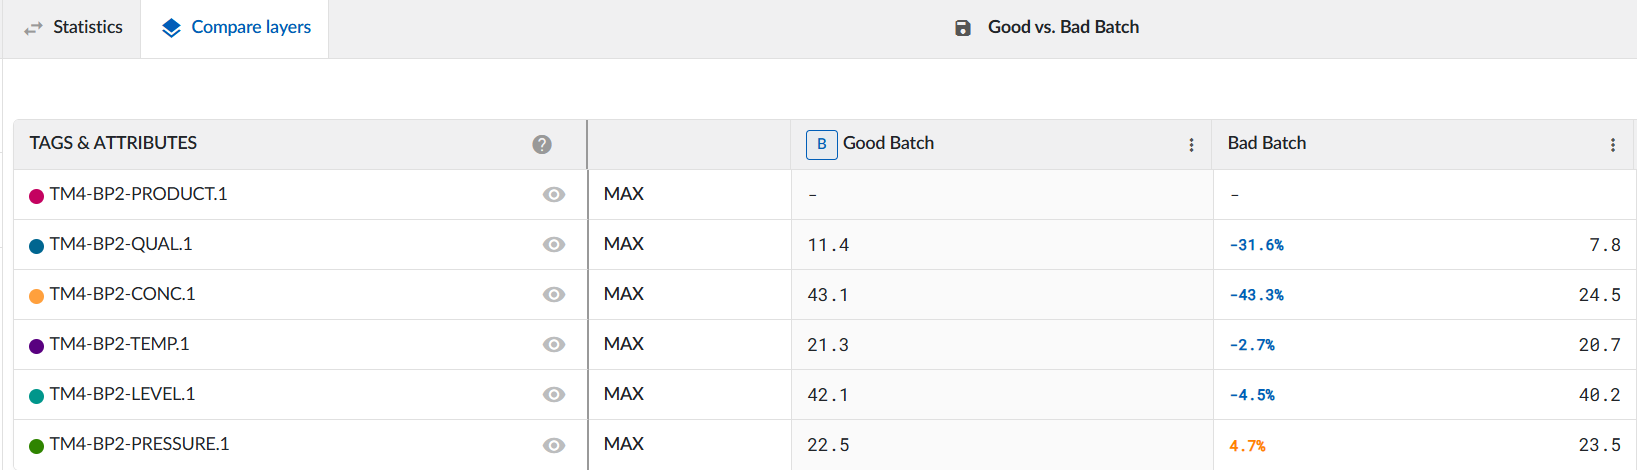
The Compare Layers feature provides an aggregated comparison of statistical properties (e.g., average, minimum, maximum values) for all relevant tags.
🎯 Value
By systematically comparing good and bad periods, you can:
-
✅ Gain a clear understanding of what differentiates optimal and sub-optimal performance.
-
🔍 Identify process parameters that contribute to inefficiencies.
-
📊 Optimize operational strategies based on data-driven insights.
-
🔄 Improve overall process stability and product quality.
This structured approach allows teams to move from intuition-based troubleshooting to a data-driven optimization strategy, ensuring long-term process improvements. 🚀
📌 Additional Insight: For further optimization, you can also create a fingerprint for the best-performing batches (Golden Batch Fingerprint). This allows for continuous monitoring and automatic detection of deviations, helping to ensure consistent quality and process stability over time. You can find more exciting information on this in the community article “Reducing product loss with golden batch fingerprint monitoring”. ✅📊
💡 Have you used this method in your process analysis? Share your experiences and insights below! 👇😊