

Background
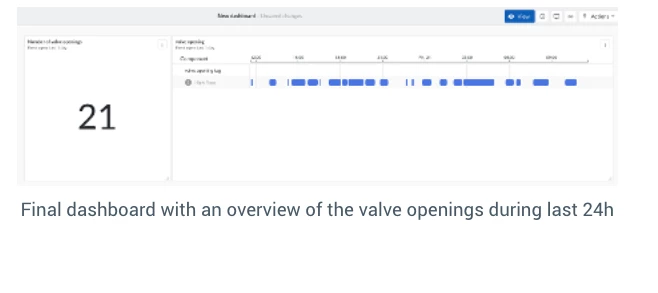
This use case shows how to create a dashboard that shows an overview of the number of valve openings and the current valve state. In the past this used to be a non-automated procedure, requiring a lot of manual work to count the amount The objective of this dashboard is to streamline and automate the monitoring of valve operations, reducing manual effort and enhancing real-time visibility.
Solution
The solution includes the following steps:
- Value based search: Create a value based search to identify all the valve opening events you want to display on your dashboard. Save this search for later use.
- Contextualisation of Events: Select “Add as Context Item” for the identified events.
- Fill in the context item details such as Component (valve opening tag), Type (High Flow), and Description (Valve open).
- Monitor Setup: Go to the “Monitoring” tab and enable a new monitor. Use the saved valve opening search and set it to create a context item for each event. Attach the context item to the valve opening tag and save the monitor.
- ContextHub View Creation: Open ContextHub and create a new view. Add filters, such as Component = valve opening tag, and set the timeframe (e.g., last 1 day) with live mode enabled. Save the ContextHub view.
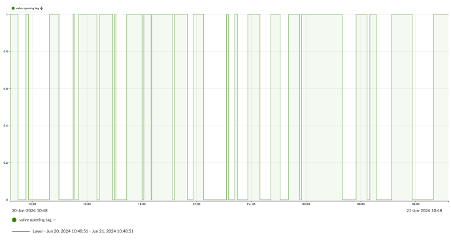
- Dashboard Integration: Open or create a new dashboard in DashHub. Add a new tile linked to the saved ContextHub view, which counts the number of valve openings per shift. Additionally, a TrendHub view or other forms of the ContextHub view can be added for extra overview.
Results and Value:
The implementation of this valve opening counter dashboard yields several notable results and delivers significant value:
- Significant time savings: By automatically counting the valve openings a lot of manual work is eliminated, thus resulting in a significant time saving.
- Enhanced visibility: Now there is an automated and reliable method for tracking valve operations, easily accessible through a centralized dashboard.
- Improved decision-making: Real-time data on valve openings supports more informed decision-making, optimising the production process.
