On a daily basis, a process expert evaluates key process parameters. In TrendMiner, a process expert can easily populate a dashboard with the preferred parameters making your most important process parameters available with one click of a button.
As an example, we are going to visualize the general status of a heat exchanger on a dashboard for the last 24 hours to immediately follow up on important process changes.
Workflow
- Saving important trends in the work organizer
- Creating a TrendHub view tile on a dashboard in DashHub
- Creating a traffic light tile on a dashboard
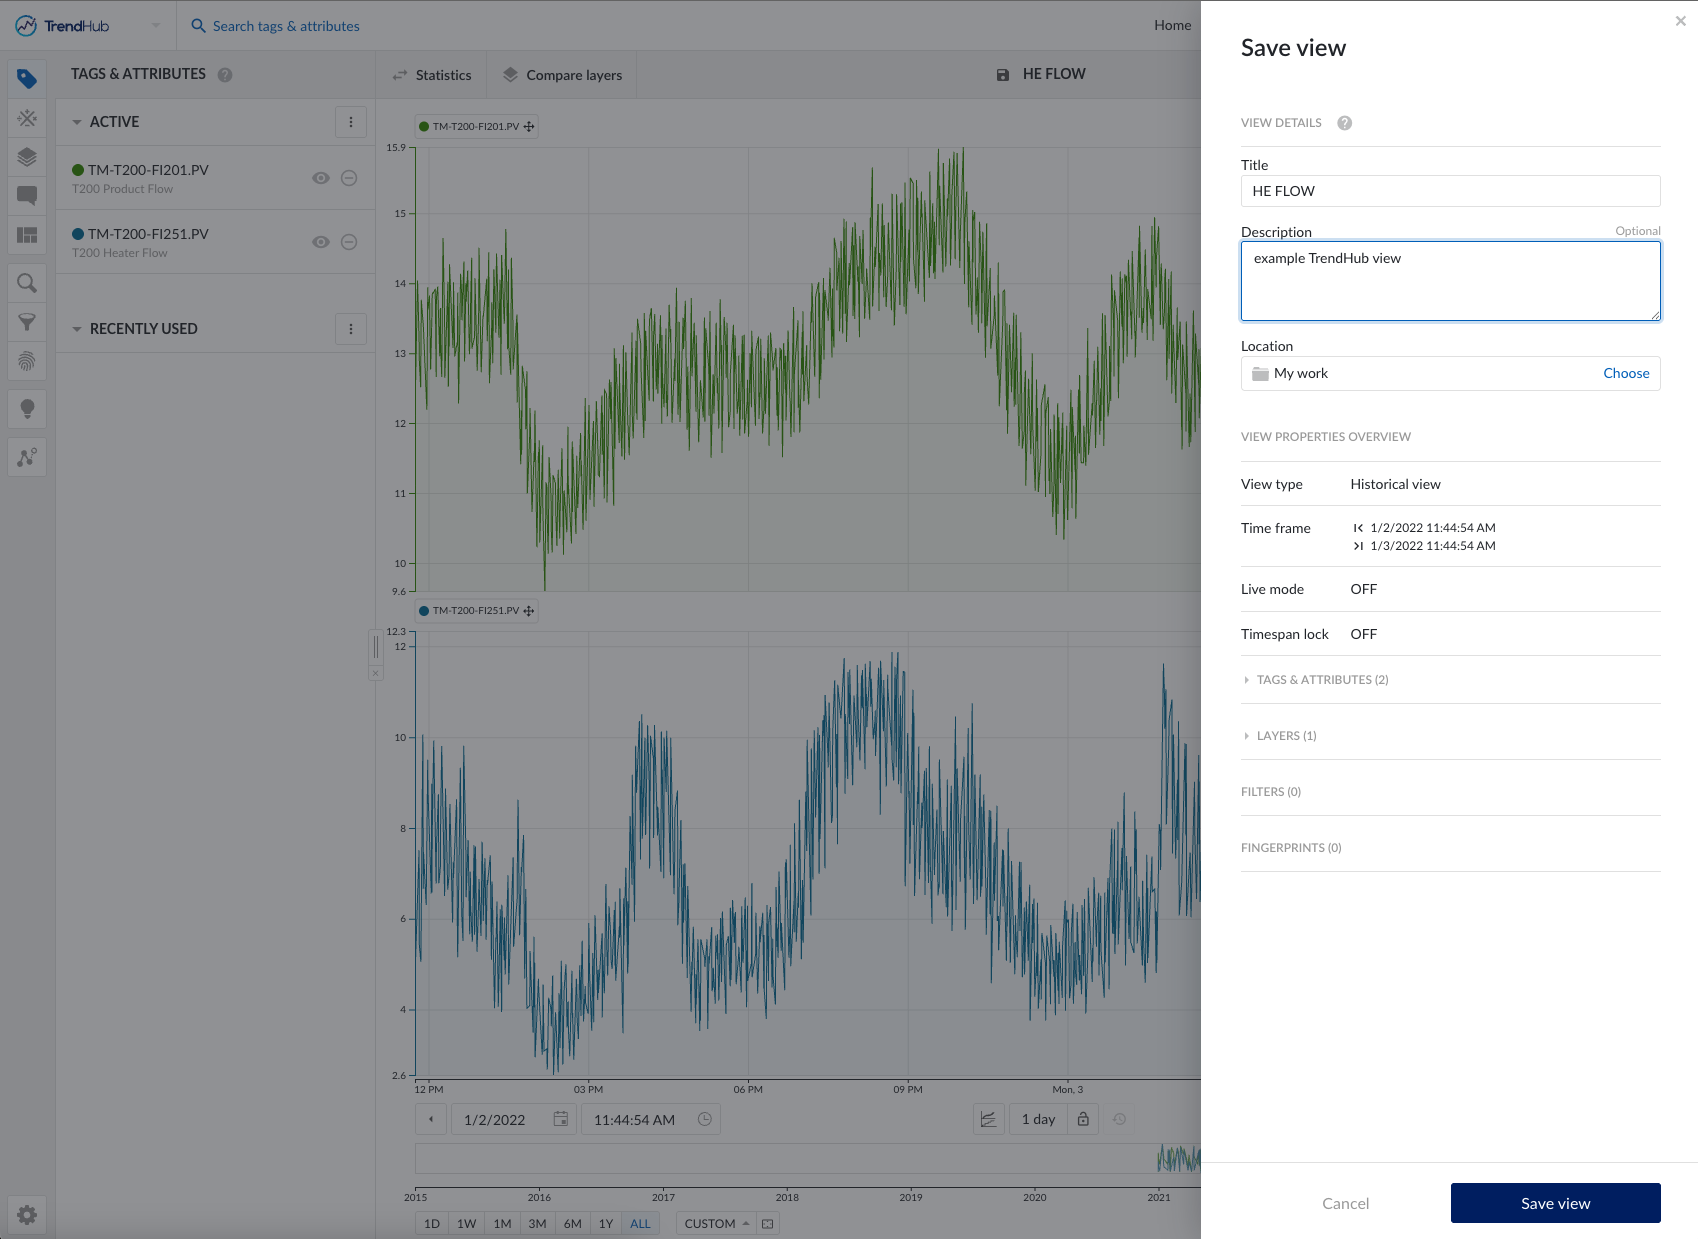
Saving important trends in the work organizer
Firstly, we need to save the correct views we want to put on our dashboard. This can be done in TrendHub where we can save the view that is visualized.
For our case we are going to:
- Load the tags related to the heat exchanger: TM-T200.*
- Visualize the outlet temperature of the product, and the inlet and outlet temperature of the heating medium.
- Put the focus chart on 24 hours, fix the timespan, and put the view on live mode.
- Save the view in your work organizer.
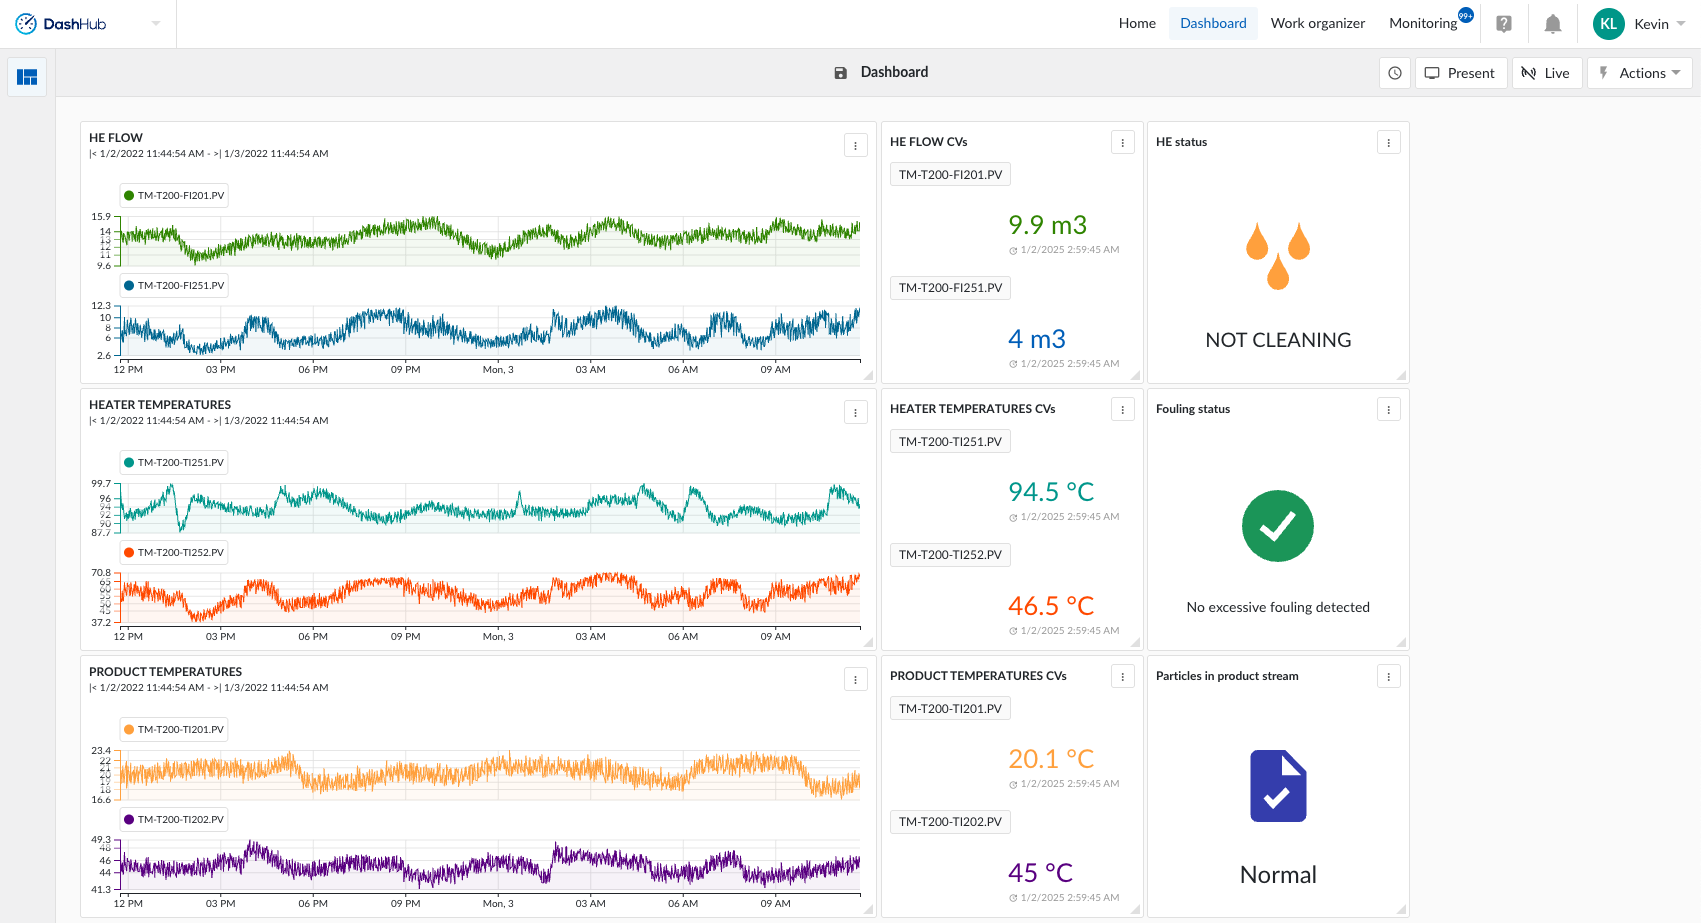
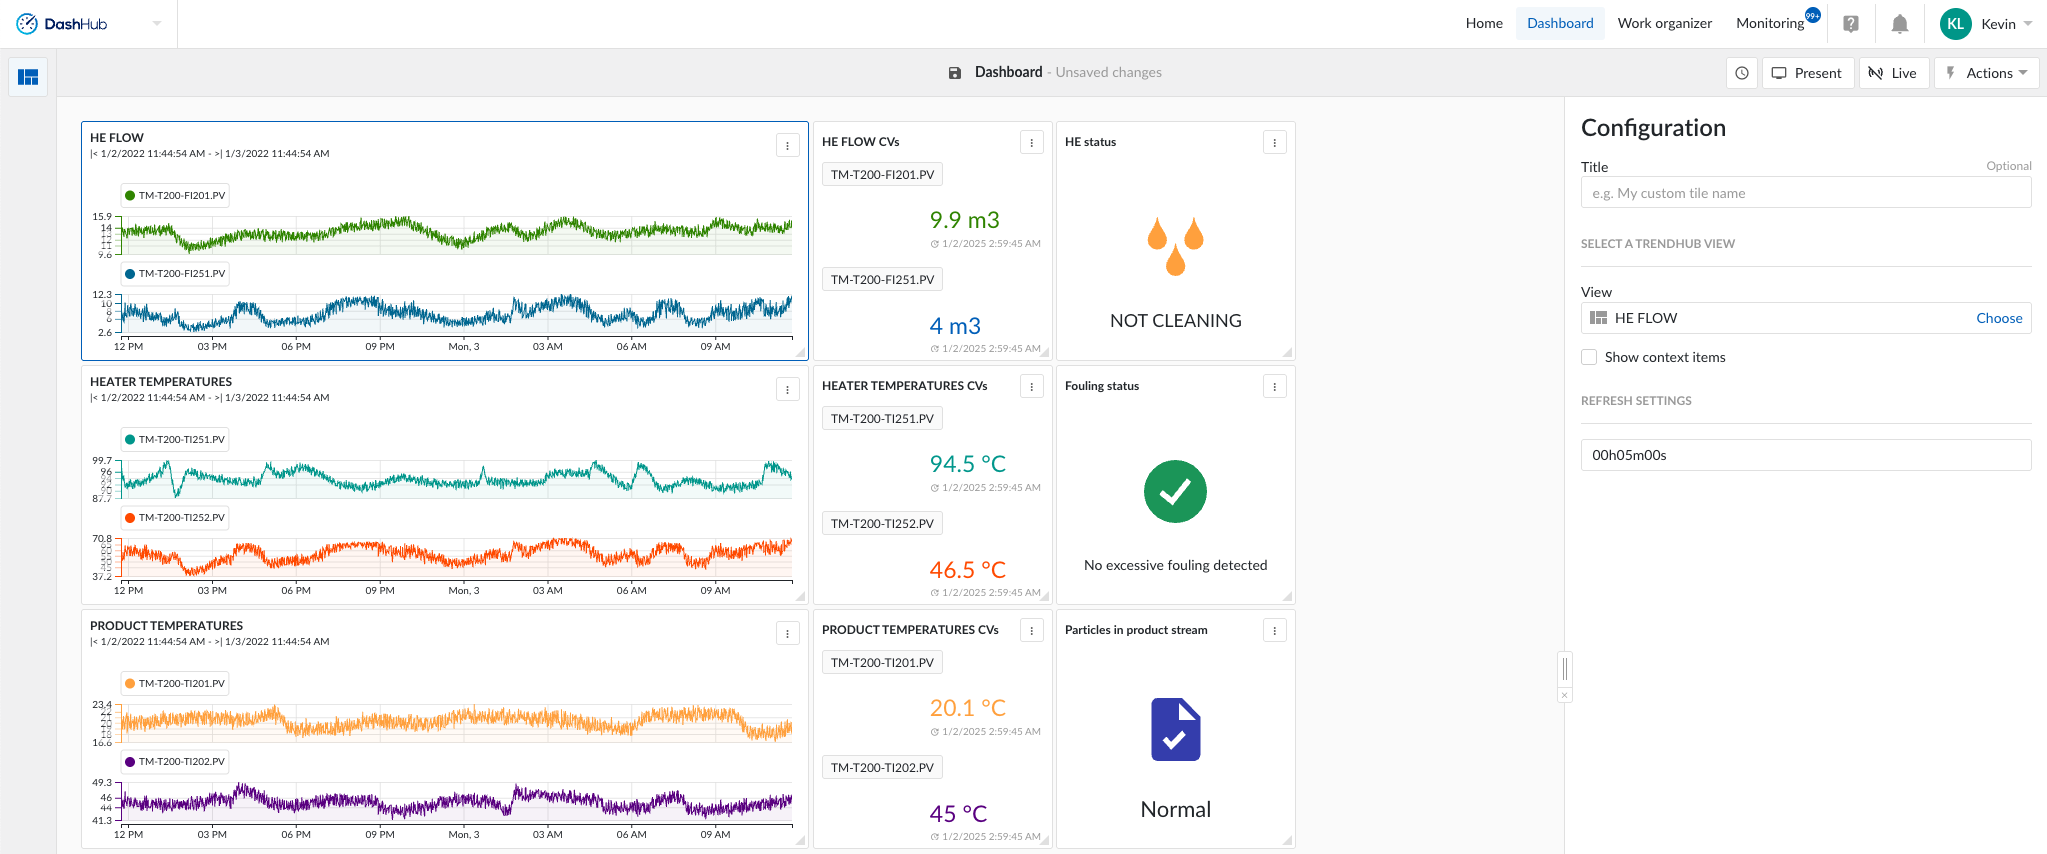
Creating a TrendHub view tile on a dashboard in DashHub
In DashHub, we can make tiles of the views we saved in TrendHub.
For our case, we are going to add the freshly made view to our dashboard. This can be done by adding a tile named TrendHub view.
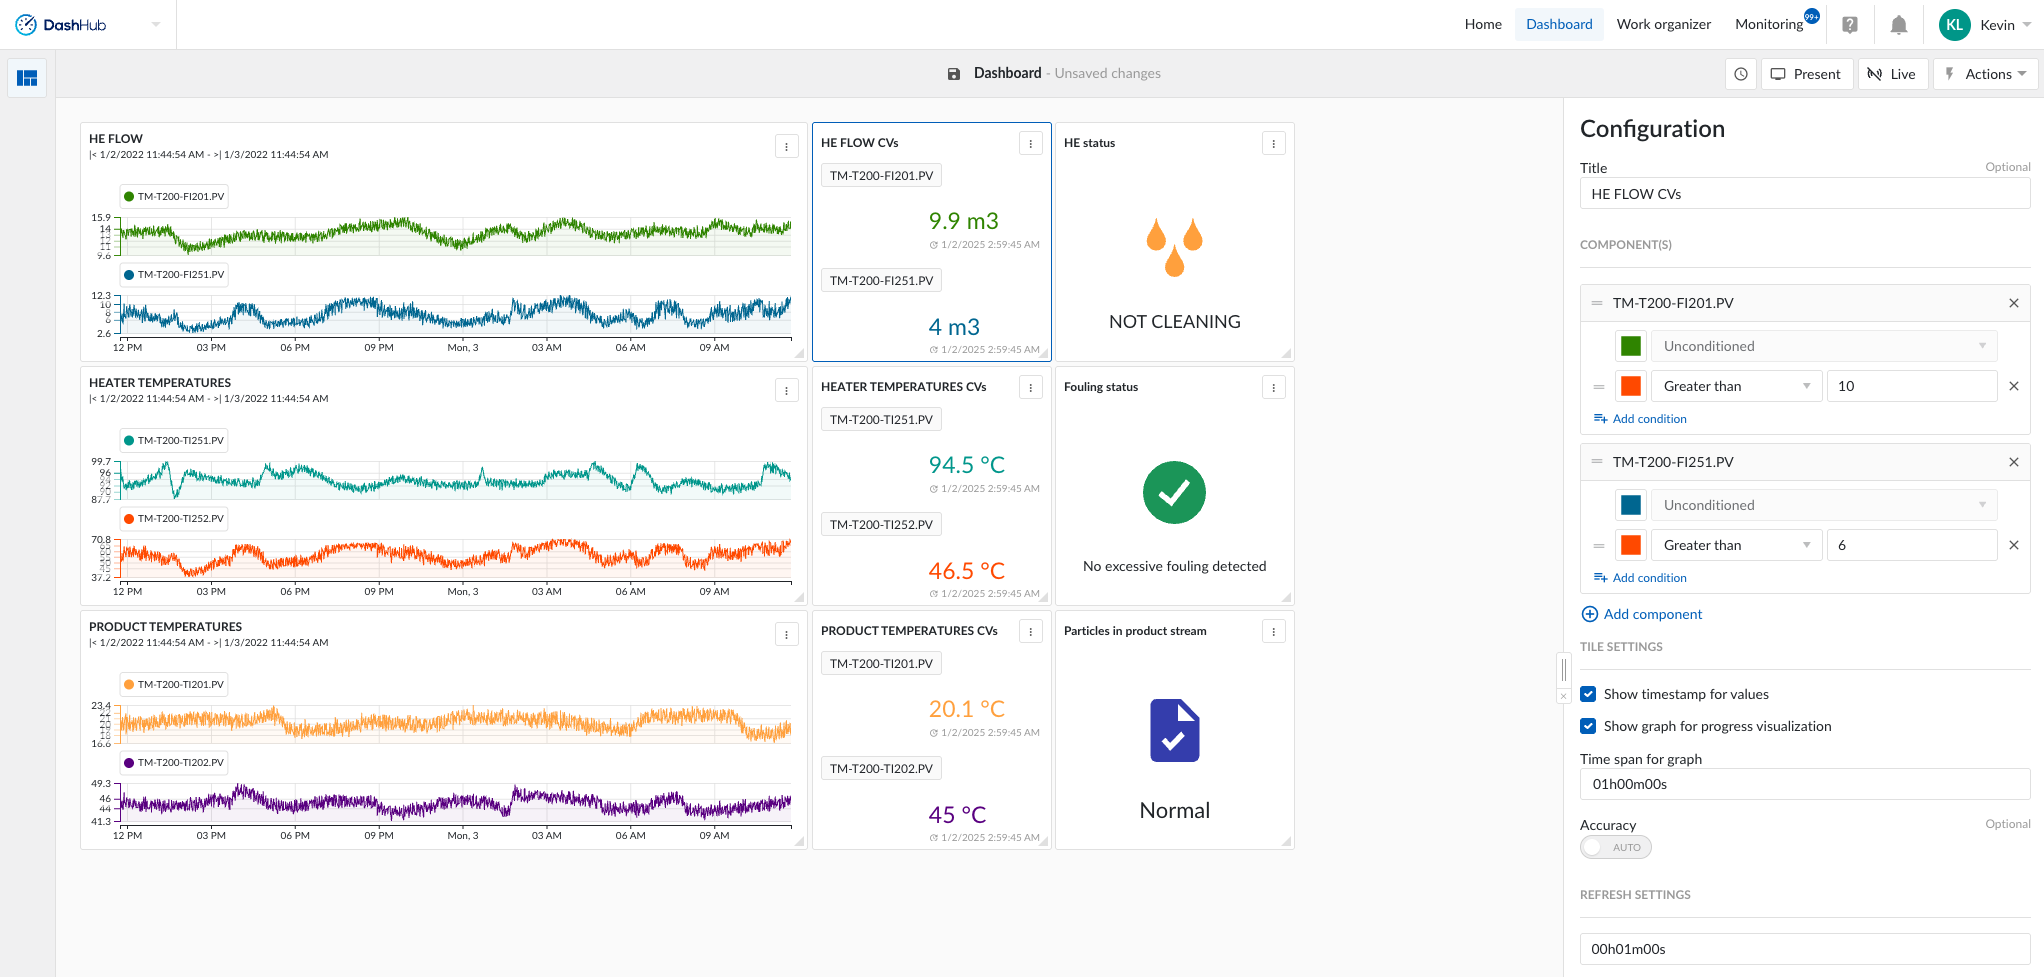
Creating a traffic light tile on a dashboard
In DashHub, we can make a current value tile where we can add the current values of our wanted tags using conditional formatting.
For this specific case we are going to take the same tags as the first step, but we will add a condition that the values must turn red when passing a specific limit.