





Tips and tricks for using the functionalities to get the best results
Recently active
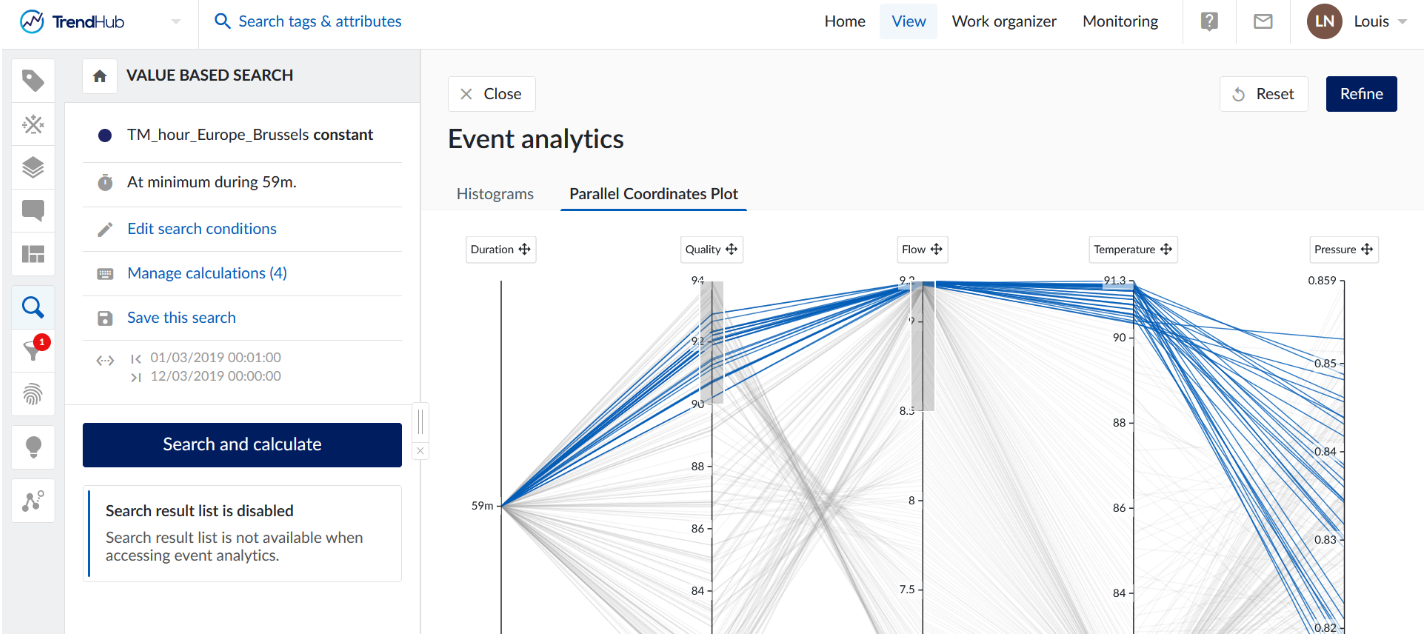
BackgroundOften times, we find ourselves wanting to know when a certain tag changes state. For example, if we have a batch process, I’d like to know when I transition from one phase to another in the process. Or for a multi-product line, I would like to know when we switch from manufacturing product A to product B. Not only would we like to know when these state changes occur, but also it would be useful to analyze the data per state or segment. Consider the batch process example again - it would be nice to know the duration of each phase. Or even, what is the maximum temperature at each phase of the batch process?In TrendMiner, we can quickly answer these questions by conducting a constant Value Based Search (VBS). When selecting constant in a VBS, we ask TrendMiner to identify every change of state or level. I say level too because constant VBS can apply to analog tags in addition to string and discrete tags. Below I will detail the steps to create a constant VBS. Step 1 - Create the
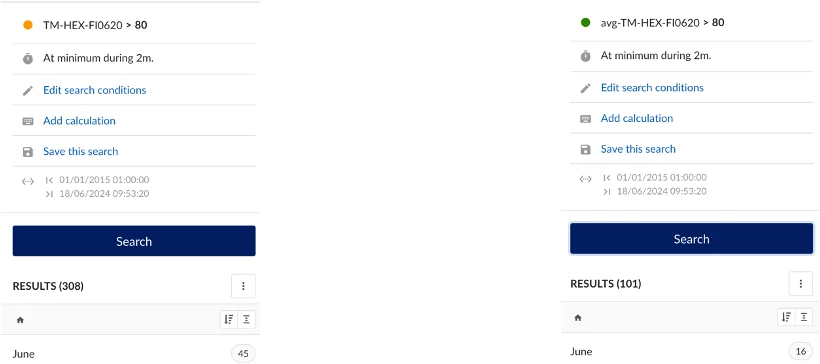
We all love the monitor feature in TrendMiner, however sometimes it can also be annoying when the monitor is triggered too many times and creates an email spam. In this article we will discuss how you can prevent an endless stream of TrendMiner monitor alert (emails) and just get an alert when a real event occurs.1. Use search results as indication for number of alertsA TrendMiner search is often the backbone of a monitor and thus we can use the number of search results as indication to the amount of monitor alerts we will get within the search period. For example, if we perform a search with a context bar period of 6 months and get 15 results, then we know that when we apply a monitor with this search we will get 15 monitor alerts within 6 months.2. Finetune your value based searchWhen you use a value based search the first thing you can tune to optimize your monitor is the minimal duration setting of your value base. In this example we want to know for when our flow out of our pump i
In this article, we present 4 of our least used but valuable features which you can use to your advantage. We also show some concrete examples. 1 - Operating Area Search Empowers users to intuitively identify optimal and suboptimal operating conditions through a visual interface. Helps users detect process irregularities early by analyzing correlations between parameters. Provides preventive maintenance warnings using the operating area search in a combination with monitors. In the example shown below, the power a conveyor belt is consuming is plotted versus the specific power consumption, which takes into account the mass the conveyor belt is transporting. The scatter plot itself shows that there is an optimal point of operation looking only at energy consumption. Now, this area is selected as area of good operation and is used in the operating area search to look for periods when this correlation is changing, indicating a change in the operating conditions of the belt which me
Already have an account? Login
No account yet? Create an account
Enter your E-mail address. We'll send you an e-mail with instructions to reset your password.