













Discover our learning resources and share your experiences...
Recently active
📣 If you missed our March 24th webinar, Optimizing Batch Processing Time and Increasing Daily Production with TrendMiner, the recording is now available and well worth your time. The session featured a compelling real-world from Mallard Creek Polymers, a specialty latex manufacturer, showing how their team used TrendMiner to reduce stripper cycle times by 10-20% and directly increase daily production output.Even better, an analysis that could have taken an engineer hours or days to complete, now takes about ten minutes to repeat.Find the webinar recording here 🔊
1. Overview To embed a TrendMiner dashboard into SharePoint Online using an iframe, two systems must allow the embed: TrendMiner – via Content Security Policy (CSP) frame-ancestors settings SharePoint Online – via HTML Field Security (allowed iframe domains) Both sides must be correctly configured for the embed to work. 2. Prerequisites A working TrendMiner environment (e.g. https://demo.trendminer.cloud) Access to TrendMiner ConfigHub (TrendMiner admin) SharePoint Site Collection Administrator rights 3. Step 1 – Allow SharePoint in TrendMiner (CSP / ConfigHub)TrendMiner uses CSP headers (specifically frame-ancestors) to control which domains are allowed to embed its pages. In TrendMiner, go to ConfigHub → URL Embedding. Add the domain(s) that will host the SharePoint page, for example: https://contoso.sharepoint.com Use only base domains, without paths or wildcards in the path. Valid examples https://example.com https://example.com/ https://*.example.com (matches
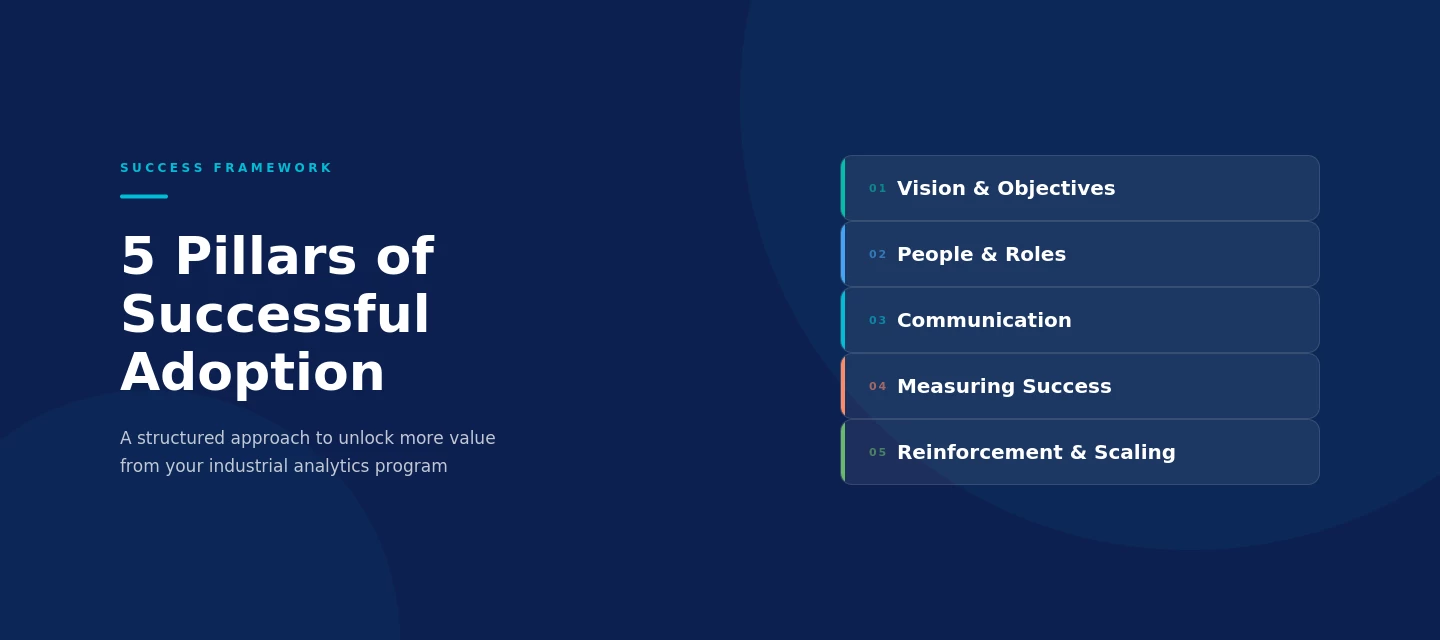
Hello,Our second TrendMiner Success Series Strategy webinar's recording is now available! In this session, we introduced a practical framework built around five pillars that drive successful analytics programs: vision and objectives, people and roles, communication, measuring success, and reinforcement and scaling. For each pillar, we shared best practices from the most successful TrendMiner customers.Watch the recording: https://vimeo.com/1177390498?share=copy&fl=sv&fe=ci👉 We also created a self assessment tool to help you to understand your current maturity level. By answering 25 questions across 5 key pillars you can get your maturity profile, a visual diamond chart, and tailored recommendations in about 5 minutes. Got questions about this webinar? Let us know in the comments below! 👇
Hello,If you missed our first TrendMiner Success Series Admin webinar, or just want to revisit, the recording is now avaliable!In this session, we covered how to make upgrades a smooth, predictable process, including technical best practices and a thorough walkthrough of the new Upgrade Manager. Got questions about this webinar? Let’s chat in the comments! 👇
This tutorial guides you through pulling time series tag data from TrendMiner into Power BI or Excel using Power Query. It follows the same structure and authentication pattern as the TrendMiner ContextHub article, replacing the context item endpoint with the tag index data endpoint.We will cover the following steps:Finding the Time Series UUID of your tag. Setting up parameters to make the queries dynamic. Writing queries for API interaction. Configuring the output table. Step 1: Find Your Tag's Time Series UUIDThe API identifies tags by a UUID (Universally Unique Identifier), not by the tag name. You need to look this up once per tag. The easiest way is directly from the browser while using TrendMiner.How to Find the UUIDOpen TrendMiner in your browser (Chrome recommended). Open the Developer Tools by pressing F12, or right-click anywhere on the page and choose Inspect. Click the Network tab at the top of the Developer Tools panel. In the TrendHub, search for your tag in the “Search
TrendMiner’s PlantIntegrations can be installed as WebHost (IIS) or AppHost (self‑hosted). AppHost is a lightweight, simpler alternative that is easier to install, maintain and upgrade. While WebHost currently still provides more flexibility and security features. There is a difference in available features before version 2026.R1.0 and after 2026.R1.0 which is explained below. Deployment features before version 2026.R1.0: These are the most important differences between the two hosting options:Feature WebHost (IIS) AppHost (Self‑hosted) Installation IIS setup Simple exe, self‑contained Port configuration Flexible Fixed to 8001 Security TLS/HTTPS, Basic Auth Relies on network/proxy security Multiple instances X Single instance (fixed port) Best for Complex environments needing full control Lightweight setups or quick deployments Summary: AppHost is currently ideal for small or lightweight setups, quick deployment, and simpler maintenance. WebHost is curr
You may notice that CPU and memory usage on a TrendMiner VM often stays low — sometimes below 25%. This raises the question: why do we have minimum recommend X GB RAM and X vCPU?Understanding Resource AllocationTrendMiner is a microservices-based application, where each component runs in its own pod within Kubernetes. Each pod has: Request: Minimum guaranteed CPU and memory. Limit: Maximum resources it can use under load. Kubernetes schedules (create & run) pods based on requests, not current usage. Even if a pod is idle most of the time, the VM must have enough capacity for all pods’ requests simultaneously. Visualizing the TrendMiner VMBelow is a simplified view of a TrendMiner VM hosting multiple microservices pods: Each pod acts like a mini-VM running a single microservice. The TrendMiner VM acts like the hypervisor, guaranteeing resources for all pods at all times.Why Not Scale Down?Even if your TrendMiner VM doesn’t look busy, reducing CPU or memory can cause problems: Pod
If you’ve attended one of our VILT TrendMiner trainings, you’ve probably seen a popular workaround: creating a daily aggregation tag that looks discrete (a clean stepwise plot) and updates once per day at midnight. You may have also seen Natasha’s post where she discusses how to build the stepped daily tag.This is a simple but powerful technique when you want a tag that reports something like: Daily average Daily total Daily max/min Daily standard deviation Any other 24-hour aggregation you want to visualize as a “daily value” In training, we typically build this so the tag updates at midnight. But recently a user asked a great follow-up: can we build a similar tag that steps at a certain hour of the day instead of midnight?Good news! You can do this with a small modification to the same workaround. In this post, I’ll walk through this modified approach that lets you step your daily aggregation at the hour to your liking. Step the daily aggregation at 7:00 AM (or any hour)In th
Collaboration is at the heart of successful industrial analytics. Over the past year, TrendMiner has transformed how teams share and manage their work, evolving from simple read-only sharing to a comprehensive collaboration suite. This article walks you through these improvements and shows you how to leverage them for more effective teamwork. The Journey: From Simple to Sophisticated Before 2025.R2: Read-Only SharingInitially, TrendMiner allowed users to share individual work items with read-only access. While this enabled knowledge sharing, it had limitations: recipients could view analyses but couldn't contribute or modify them, making true collaboration difficult for teams working across shifts or locations.2025.R2: Write PermissionsThe August 2025 release marked a significant milestone by introducing Write Permissions. Users could now grant colleagues write access to work items, enabling multiple team members to actively collaborate on the same analysis. This was particularly valu
Hello! 👋The recording of our February 2026 live training Data Preprocessing: Preparing Your Data for Comparable Analysis is now available! 🎉With this training you can learn practical data preprocessing techniques to ensure reliable, comparable analyses and enable effective troubleshooting. Topics include preparing comparable data sets, using filters and the Tag Builder for root cause analysis, reducing noise and outliers, and filtering data by time ranges or conditions. Recordings:🇩🇪 German🇬🇧 English Slides:GermanEnglish If you have any questions, you can write them in the comments below 😊
This Functional Tips & Tricks post was inspired by a Community question from Yves - the question can be found here. Creating a Time Proxy Tag with Custom Calculations In TrendMiner, scatter plots and regression tools require numeric X- and Y-axes. While most process tags (temperature, pressure, flow, etc.) are already numeric, time itself is not. This creates a challenge when you want to perform a linear regression of a tag versus time.To solve this, we create a time proxy tag: a numeric tag that increases as time progresses over a defined window. Once this tag exists, it can be used on the X-axis of a scatter plot against any process tag on the Y-axis, enabling linear regression and trend analysis. Why a Time Tag Is Required TrendMiner’s scatter plots do not allow timestamps directly on the X-axis. Instead, both axes must be numeric tags. Therefore, to analyze temperature vs time, we must first convert time into a numeric variable.This numeric time tag: increments as time advances
TrendMiner’s new webhook implementation allows users to alert an external system such as SAP, Microsoft Teams and potentially other platforms when certain events happen (i.e. when a TrendMiner monitor is triggered).Beyond sending custom messages, webhooks can also initiate automated workflows or processes in external systems, such as creating work orders, submitting maintenance requests, or triggering other actions.The example below shows how a TrendMiner monitor can detect the start of a new batch and automatically post notifications to a Microsoft Teams group, both at batch start and upon batch completion.If you are interested in learning more and are interested in this new webhook integration available in 2025.R3 or newer, reach out to your CSM and/or Account Manager.Step 1: Define a Context Item Type (for example, Epoxy Resin Batch). Step 2: Create & save a value-based search that reliably detects when a batch starts and ends.Step 3: Configure a TrendMiner Monitor to automatica
When you add a link in the DashHub text tile, by default it will open up in a new tab. If we were to look into the actual html content that is saved in the tile when we create a link via the editor, it will look something like this:<p><a href="https://cs.trendminer.net/dashhub/#/dashboard/599f8acf-690e-4034-8811-d596ac826d25?mode=presentation" target="_blank">test</a></p>This represents a link with the text 'test', which links to another dashboard. The target="_blank" means it will open up in a new tab.If we want the link to open up in the same tab, this target would need to be replaced "_self", or be left out entirely. Unfortunately, the text tile editor does not allow us choose the target, or edit the html directly.A trick I learned from a user recently though, is that a URL copied from certain other places, will have the target omitted, thus opening in the same tab. This is true for browser bookmark links, for example. A quick workaround I now use to have a l
TrendMiner is built on a modern, container-based platform that runs on Kubernetes. As a result, the application relies on dynamically assigned IP addresses rather than a single fixed address. Below a short explanation on Kubernetes and the required IP-ranges. A Kubernetes-based platformKubernetes is responsible for starting, stopping, and managing the different services that make up TrendMiner.In a Kubernetes environment, services run as containers that can be restarted, replaced, or moved as part of normal operation, for example during upgrades. Because of this dynamic behavior, individual container IP addresses are not fixed and TrendMiner requires multiple IP-ranges. Required IP-rangesWhen you install TrendMiner, by default the following IP ranges are used: 10.42.0.0/24 10.42.1.0/24 10.41.0.0/24 These IP ranges should not be used by other applications on the same network. They are used locally within the platform and do not need to be externally routable. If any of these ranges
Design conditions often look great on paper but once a process is running in real life, the true optimal conditions can be very different. This gap makes it harder to understand the process and to make confident, data-driven decisions based on controlled variables.To truly understand a process—and improve it—we need to analyse data under normal operating conditions.Whether you’re working with:an active batch (batch process), or a running system (continuous process),you can start by searching the relevant operating periods and then adding calculations on top of that search. By selecting the operator average for each tag, we establish a strong baseline: the most common, real-world values of our variables. 💡 This is where Event Analytics shines.With event analytics, you can:Visualise distributions of operating conditions across variables in parallel (parallel coordinate plots) Quickly identify patterns and typical behaviour Apply refinements to remove outliers or exclude conditions that
TrendMiner continuously keeps indexed tags up-to-date to ensure reliable access to time-series data. This is done using different update cycles: Every 2 minutes for tags used in monitors. (monitor cycle) Every hour for actively used tags. (forward indexing cycle) Never for tags that haven’t received data for over a year which are called dormant tags (introduced in version 2025.R2.0) in version 2025.R3.0, tags that haven’t been actively used in the past 7 days automatically switch to a daily update cycle. This is the new reduced indexing policy.What are the advantages of the reduced indexing policy? Reduces unnecessary polling on inactive tags which lowers load on external data sources Improves TrendMiner resource efficiency Allows the platform to prioritize actively used tags Administrators can monitor and manage these tags via the Index Overview menu, using filters for update policy and delayed status.This policy is especially impactful in environments with large tag volumes,
It can occur that we wish to know the flowrate of a certain material stream, but that the only measurement we have available is the weight or level of an intermediary vessel. This is especially applicable to the processing of solids, where measuring a flow directly is challenging. In this example, let's then work with the concept of deriving a mass flow from a total weight.In essence, the mass flow is nothing more that then change (delta) of the weight of our vessel, multiplied by a constant value (to obtain the result in the desired units). As a starting point, we could for example take the weight in kg of our vessel 5 minutes ago, subtract the current weight, divided the result by 300 (the number of seconds in 5 minutes), to obtain a mass flow in kg/s:Note that the choice of the interval duration (here 5m) should depend on how noisy our weight measurement is. The longer we take the interval, the smoother our flow tag will become, at the cost of increasing the lag with which changes i
As we approach the end of the year, it is the perfect moment to reflect on some of your company’s successes around data analytics, recognize the ongoing challenges, and define a few meaningful goals for the year ahead.To support you in this planning, consider setting up time with your Customer Success Manager. We’d be happy to help you define meaningful goals and identify areas of TrendMiner that you and your teams could benefit from using at a deeper level. Here are some examples:Update your dashboards - The latest versions of TrendMiner have a lot of new functionalities that will certainly give a new look to your dashboards and can help put more relevant information in front of operators, engineers and managers that closely follow key processes in the plant. Connect to more data sources - With an always expanding data landscape, having access to the right data and the right time can really boost your process troubleshooting capabilities. We’d be happy to talk to you about the possibi
If you are using TrendMiner APIs to access context items (for example to pull them into PowerBI), it makes sense to set up a client user for this purpose. In fact, it is recommended to use a distinct client for every TrendMiner automation you set up. These clients can be configured by a system administrator in ConfigHub. After setting up authentication via your new client id + secret, you may notice that you cannot access some context items. This is because they are attached to assets to which the client does not have any access rights. These asset permissions can be granted by an application administrator in ContextHub. There is an issue, however: the user search UI does not retrieve client users, and so there seems to be no way to grant permissions to our client user. Thankfully, such a limitation does not exist in the back end. Through a series of API calls, we can configure our client to have the required permissions. In this example I use the built-in API console (accessible by a
This page explains how to execute a TrendMiner upgrade using one the two scripts attached to this post. There are a few causes which can prevent an upgrade from getting started due to an incomplete upload:The upgrade file can reach a size of more then 10 GB which is fully loaded into the browser memory when upgrading through Edge manager. Some devices do not have enough RAM memory to completely load the file in memory. Some network devices can block the upload of large files through a browser. If the upload is taking a long time, it is possible you get logged out of Edge manager while the upload is in progress.The upgrade process will be structurally improved in version 2025.R4.0, but since the above issues can occur in all previous versions, this script was created.The alternative method to upgrade TrendMiner is explained below:Upgrading from a Windows device:Download the Windows_upgrade_script.zip file attached to this post. Unzip the file on the device from which you want to execute
Hi,This session shows how TrendMiner helps engineers at Bayer troubleshoot faster, understand process behaviors better, and make smarter decisions across the plant, all explained through real examples shared by Mazie Foret.One highlight was how TrendMiner helped solve a cooling difference that had confused the team for over 20 years.Bayer’s team also uses TrendMiner for other monitoring tasks like: Meter reliability Energy management Centrifuge overflow generation Emissions reporting A cool fact: One of these monitors was actually set up by Mazie’s intern, which shows how simple and user-friendly TrendMiner really is.Curious to learn more? Check out the full recording!
Hi everyone,In this session, Matthew Brantl ( @Matt) shared insights into how Nestlé Health Science optimizes their production processes using TrendMiner. Here are some of the key highlights he discussed: CIP optimization Detecting fouling in critical heat exchangers Verifying tank load cells Using ContextHub and DashHub for monitoring and visualization Check out the full recording to dive deeper into these use cases👇
Hi everyone,In this session, Bita Fillipi @bitafillipi from BASF shared how they use TrendMiner dashboards to monitor boiler efficiency, optimize fuel usage, and reduce CO₂ emissions.Even small adjustments in boiler operation can lead to significant fuel savings, lower emissions, and costs reductions.Watch the full recording below and see how TrendMiner makes a real impact! 👇
We’re excited to announce that one of the most requested dashboard features is finally here: Gauge Tiles are now available in TrendMiner’s 2025.R3 release.Gauge tiles provide a simple, intuitive way to monitor KPIs and process values at a glance. Whether you're tracking a critical parameter in your unit or creating a clean, executive-level overview, gauge tiles make it easier to visualize where your values stand. Gauge tile display modes:Gauge tiles come with four built-in display styles to fit different dashboard layouts and preferences: Angular Speedometer Linear Horizontal Linear Vertical You’ll see all four showcased in the screenshot included below. Dashboard with angular (conc and temp), speedometer (flow), linear horizontal (coating), and linear vertical (level) gauge tiles.Configuration and setup:To configure a gauge tile, the only required inputs are the minimum and maximum values. From there, you can tailor it to your needs with several optional settings: Target value
Hello! 👋The recording of our November 2025 live training Daily Production & Automatic Reporting is now available! 🎉With this training, you will learn how to optimize your production monitoring and reporting by tracking daily production variables in multiple formats and automatically generating shift reports. This will help you streamline your reporting process, ensure accurate data capture, and keep your team informed with minimal effort.Recordings:GermanEnglishHandoutsGermanEnglishWe hope you found this training session informative and beneficial! Your feedback is valuable to us, so let us know your thoughts or questions in the comments. 🙂
Already have an account? Login
No account yet? Create an account
Enter your E-mail address. We'll send you an e-mail with instructions to reset your password.