








Share your own use case or explore our use case repository
Recently active
BackgroundThis use case is centered on finding the median value of a collection of tags. In TrendMiner, it is simple to calculate the mean or average value of a set of tags. This can be done in our formula tag builder. In some cases, however, the median value proves to be more useful of a central statistic than the mean. For example, consider a furnace where there are multiple thermocouples measuring the same point temperature. If one of these thermocouples were to malfunction and read a very high or very low value, the mean value will be skewed high or low, respectively. When outliers exist in the data, the median value proves to be a useful central statistic. ChallengeThere is no built-in function in formula tag builder for calculating the median value of a collection of tags. A simple, manual formula can be created to find the median for a collection of two or three tags; however, the manual formula grows exponentially when additional tags are added. Writing a formula to calculate t
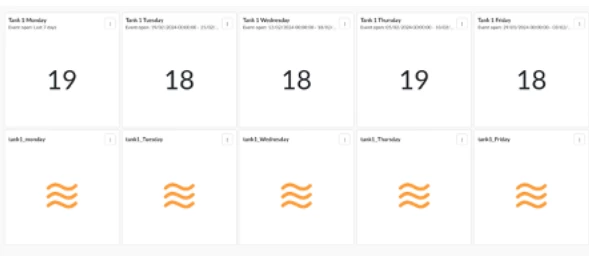
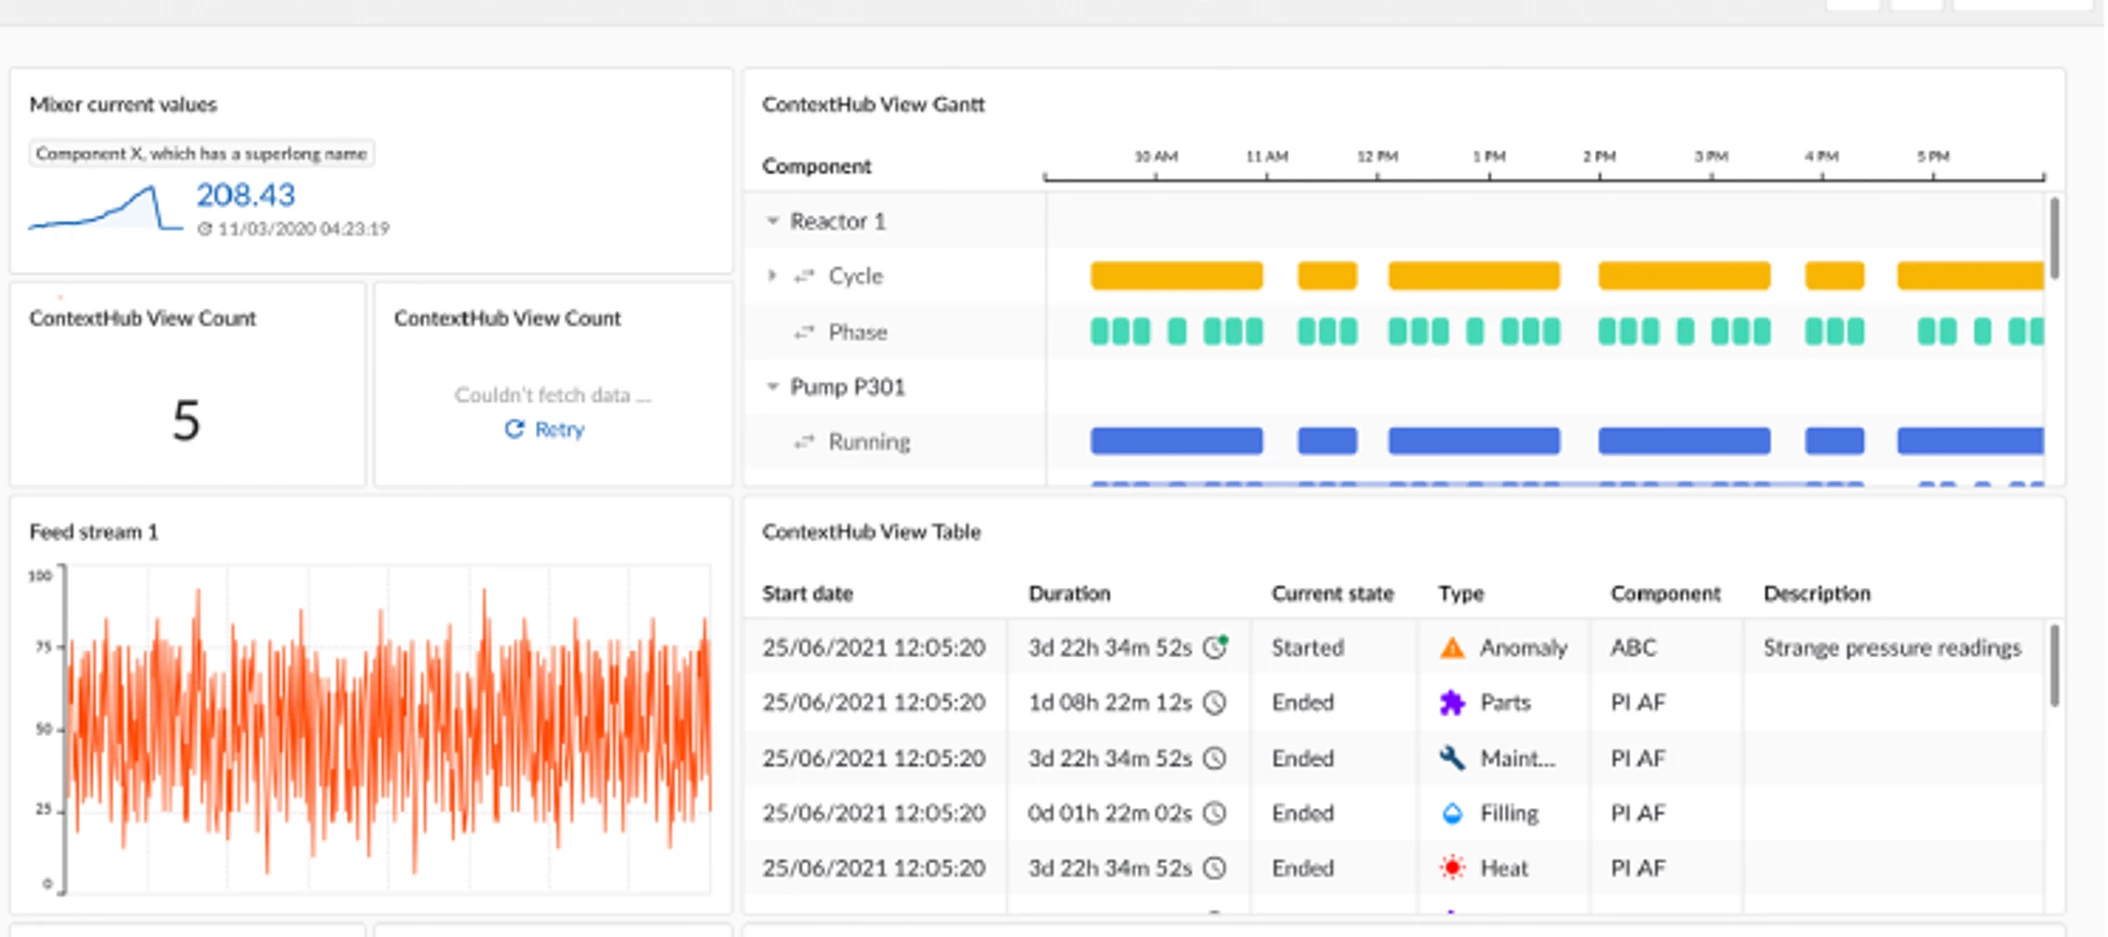
BackgroundThis use case shows how to create a dashboard that shows the number of events per day of the week. This can be emptying/filling of a tank or number of produced batches, or any event indicated by a tag in TrendMiner. Having such an overview can help you gain better insights in your process operations.SolutionThe solution includes the following steps:Value based search: Create a value based search to identify the events you want to count on your dashboard. Based on the search results create context items as stated in step 2. Also save the search to enable a monitor based on it for future context item creation. Context Item Creation: Each time an event happens, a context item is created to record the event via the search results or the monitor. This context item captures pertinent details such as the timestamp of the event and the day of the week as a keyword. Keyword Tagging: The day of the week is tagged as a keyword for every context item, facilitating easy categorization and
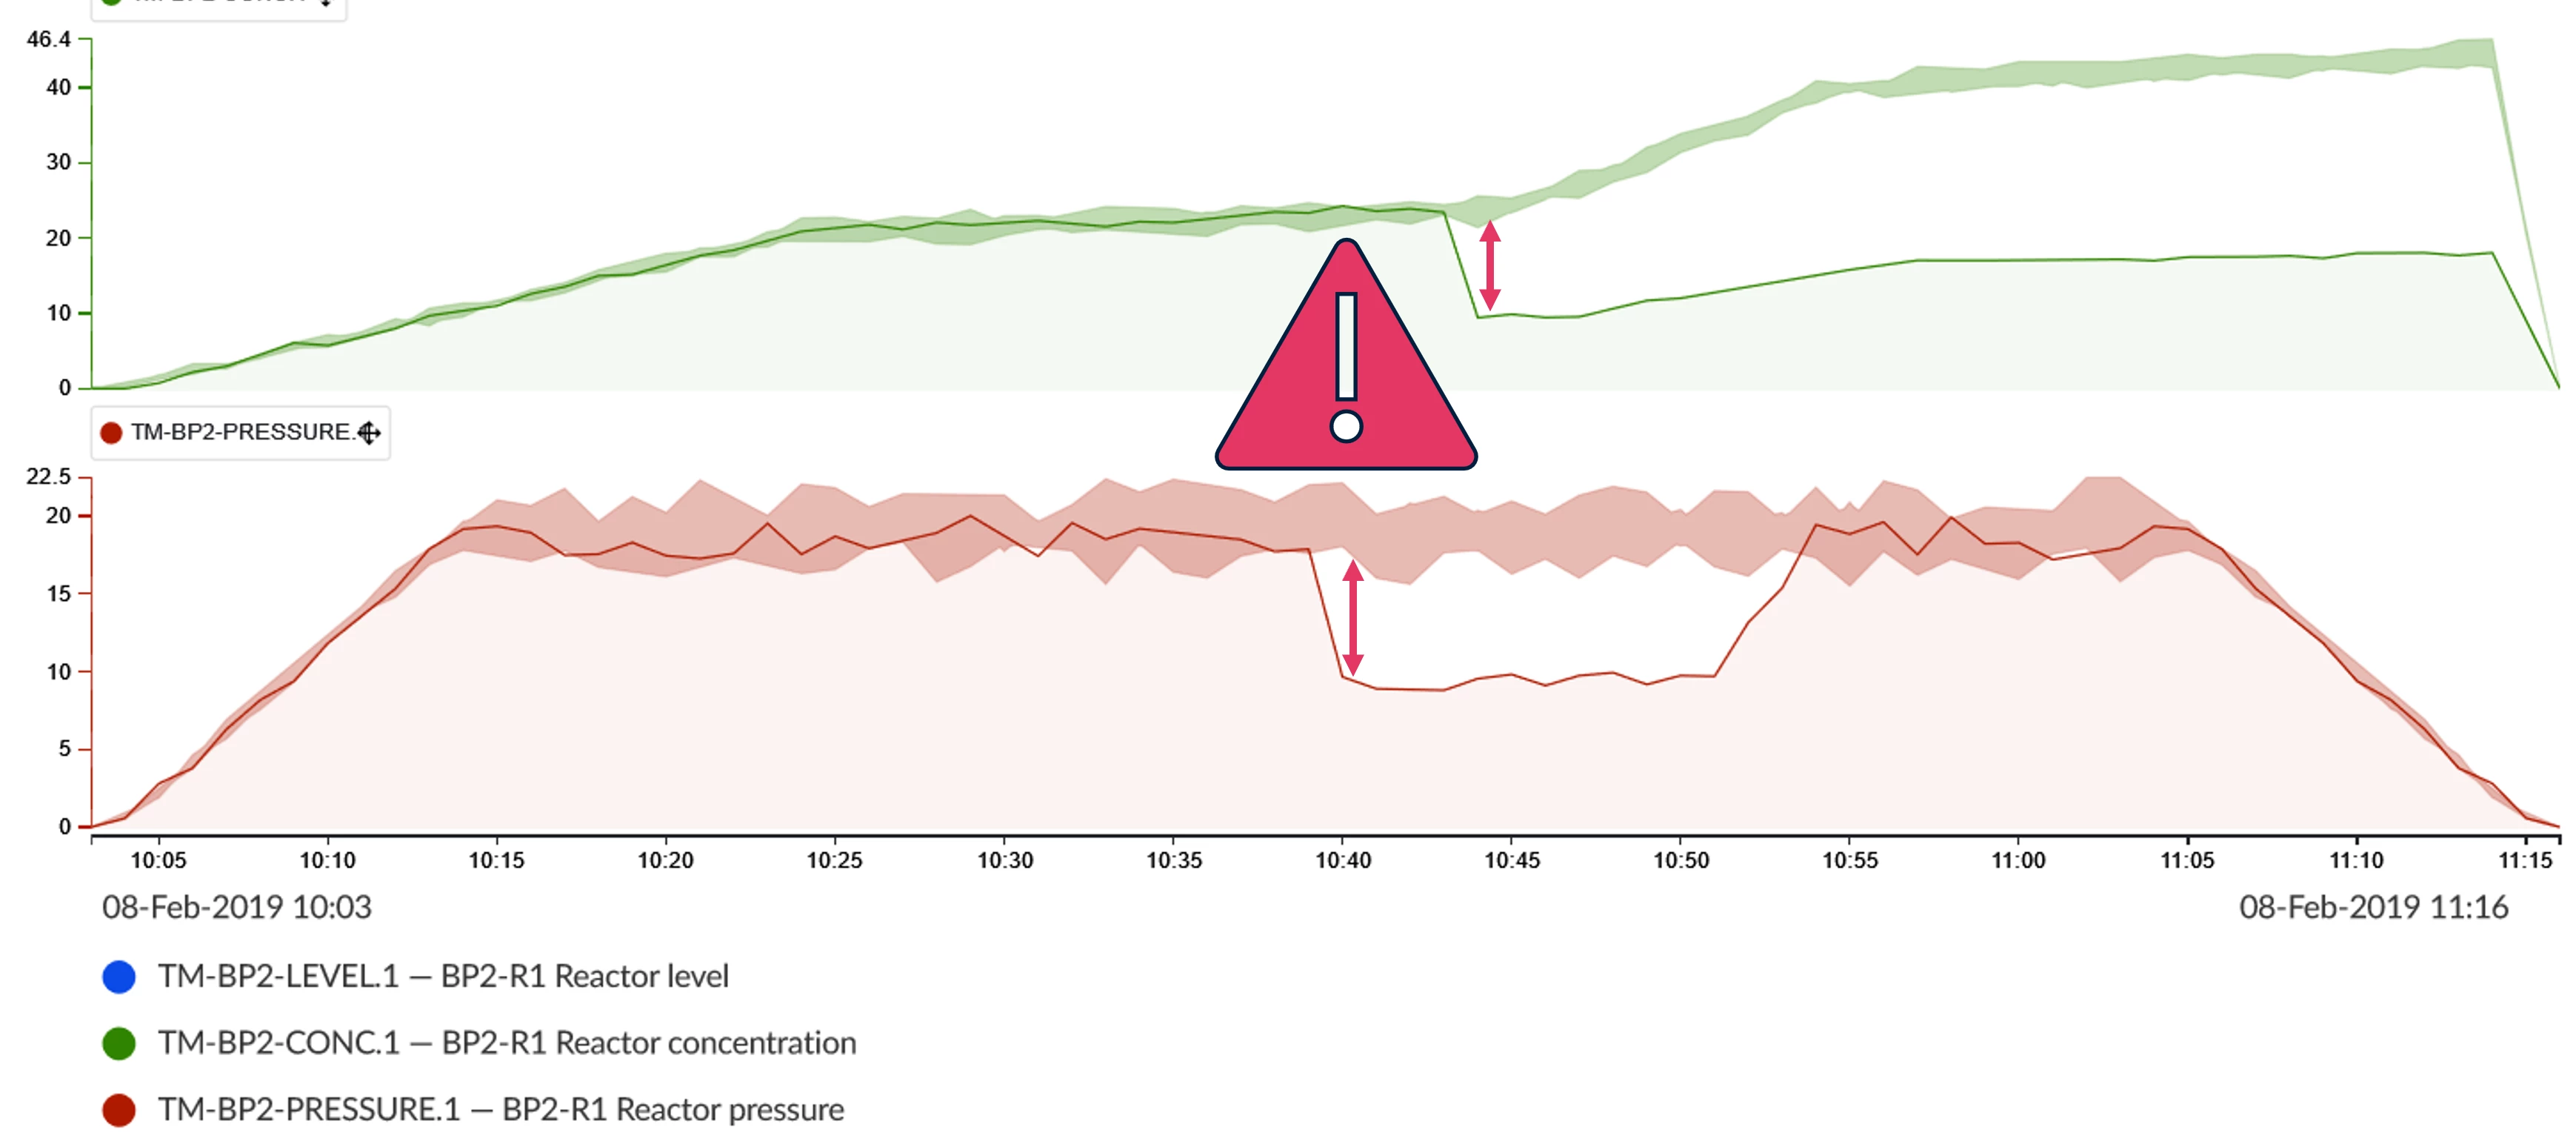
BackgroundIn our batch process, ensuring optimal operating conditions is critical for maintaining production, product quality and worker safety. Monitoring various process parameters such as low average temperature, constant pressure, high end- concentration and low energy consumption in real-time is essential to maintain consistency and quality across batches. ChallengeOur challenge was to implement a comprehensive system for monitoring operating conditions in a batch process with 7 regularly changing recipes. Over the past month, we have experienced problems with parameters deviating from optimal process conditions, resulting in poor product quality. We needed a solution that would accurately monitor the trend profiles at each step of the process and alert operators when these deviations occurred. The alert should provide actionable insight for operators and supervisors to optimize production processes and minimize product loss. Solution1. Visualizing the trendsA list of tags was add
BackgroundIn the chemical industry, calculating e.g. hourly consumption rates of critical resources such as energy, steam, electricity, and others is important. Accurate calculations enable efficient resource utilization and optimal process control. Continuous monitoring of these consumption rates allows for early detection of potential bottlenecks and facilitates proactive measures to enhance efficiency. ChallengeConsumption can be calculated both as rolling hourly averages and as fixed hourly values. Subsequently, the derived consumption values serve as the foundation for resource utilization monitoring, identifying efficiency potentials, and implementing targeted measures for process optimization. SolutionCalculating rolling hourly averagesThe rolling hourly average consumption is calculated using aggregation in the tag builder menu. We select our tag of interest, choose the average as the operator, set the direction to backward, and specify a one-hour aggregation window. With the
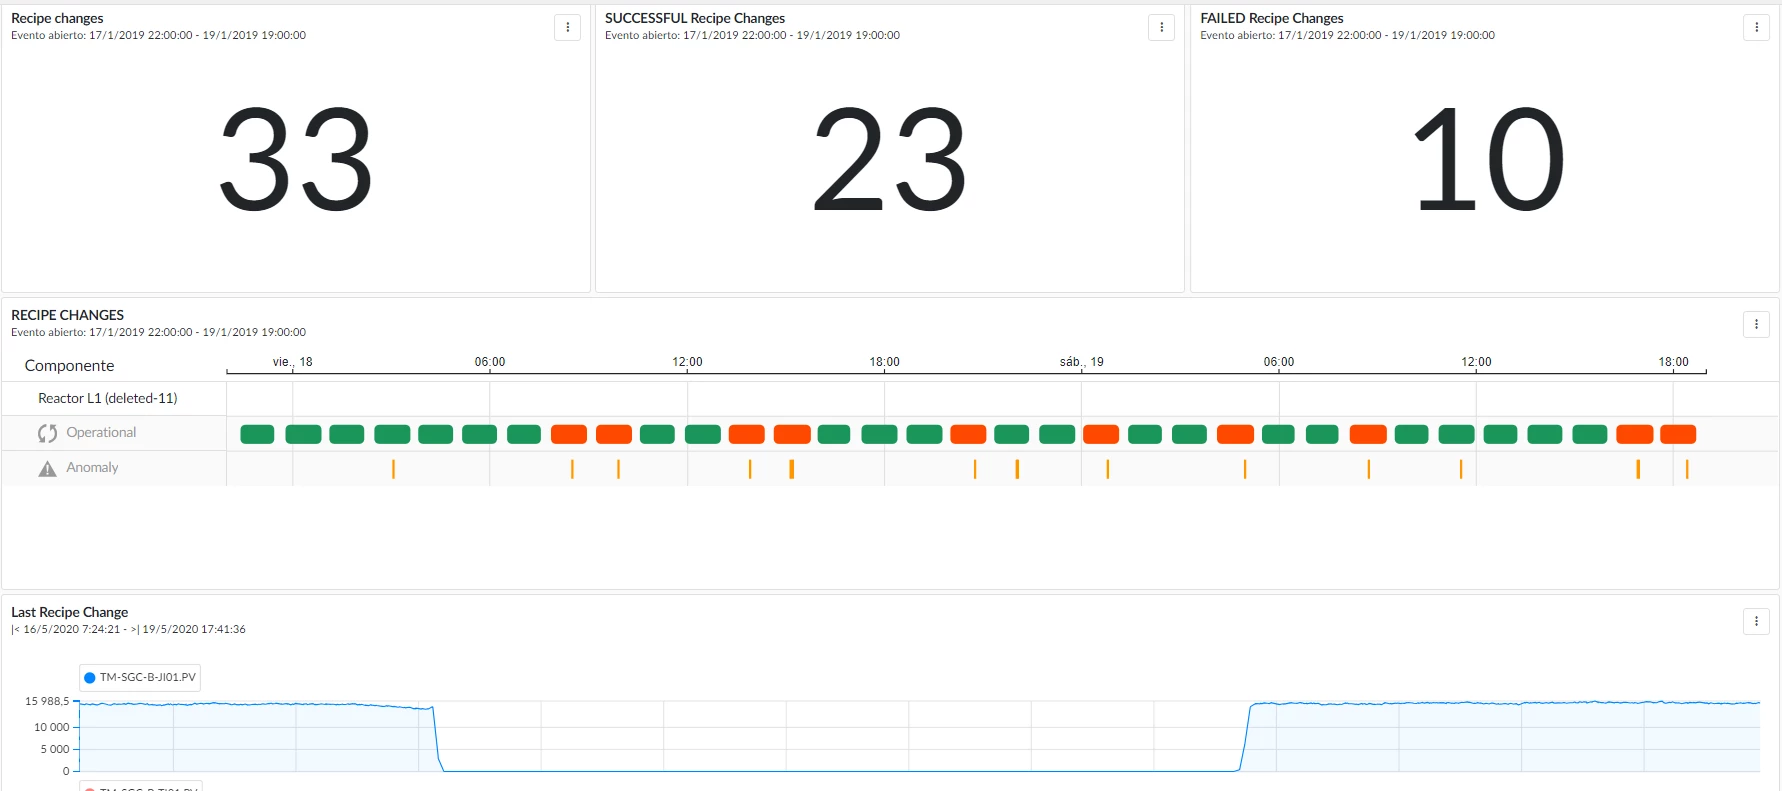
BackgroundThe final product dosing process relies on a tank with rotors, maintaining a constant level and rotors speed during production, but level drops significantly when changing products. This drop in tank weight slightly reduces dosage, potentially leading to customer complaints about low product weight.Operators manually increase rotor speed during tank emptying to compensate, but monitoring this action is crucial. ChallengeAutomatically keep track of the number of times and dates when emptying happens and whether or not the speed of the rotors was increased, for traceability purposes. Create a daily dashboard to be used during operating meetings Only emptying events of more than 15mins are relevant. SolutionCreate aggregations: Range of the rotors and Max of the tank level in the last 20m. Value Based Search for good and bad emptying periods of at least 15m: max level>60 & current level<50 + (rotors range>0/range=0). This search will find periods where the tank used
BackgroundSoft sensors, also known as inferentials, play a crucial role in industrial processes by predicting important lab values or other slow-sampled variables. In many manufacturing environments, the process involves monitoring various parameters that are critical for quality control or process optimization. However, some of these parameters, such as lab values, are slow to sample due to the time required for testing. This delay can hinder real-time decision-making and potentially lead to inefficiencies or quality issues. Soft sensors offer a solution to this challenge by using fast-sampled inputs as inputs to a machine learning model. This model can then predict the slow-sampled variables, providing real-time insights without the need to wait for hours for the next lab sample to be tested. Operators can monitor these predictions and make timely adjustments to the process, optimizing operations and ensuring quality standards are met. ChallengeOur primary challenge is to develop a
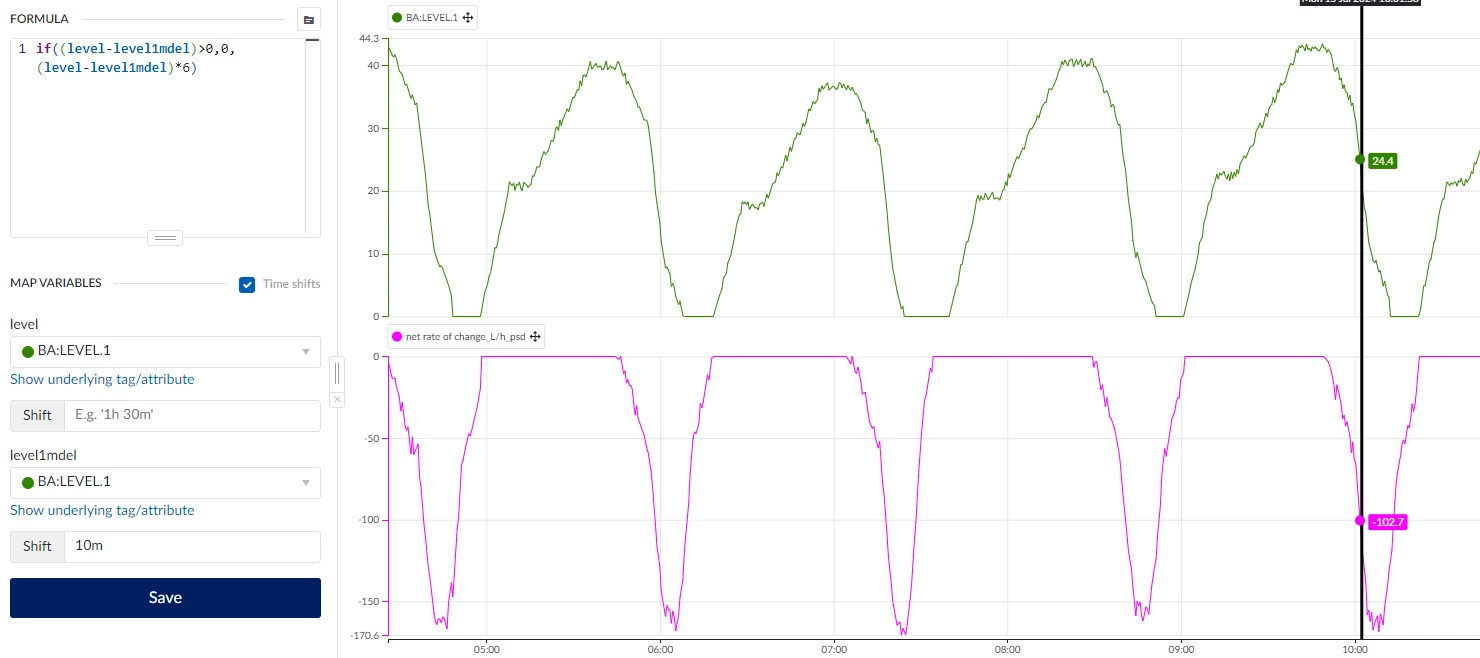
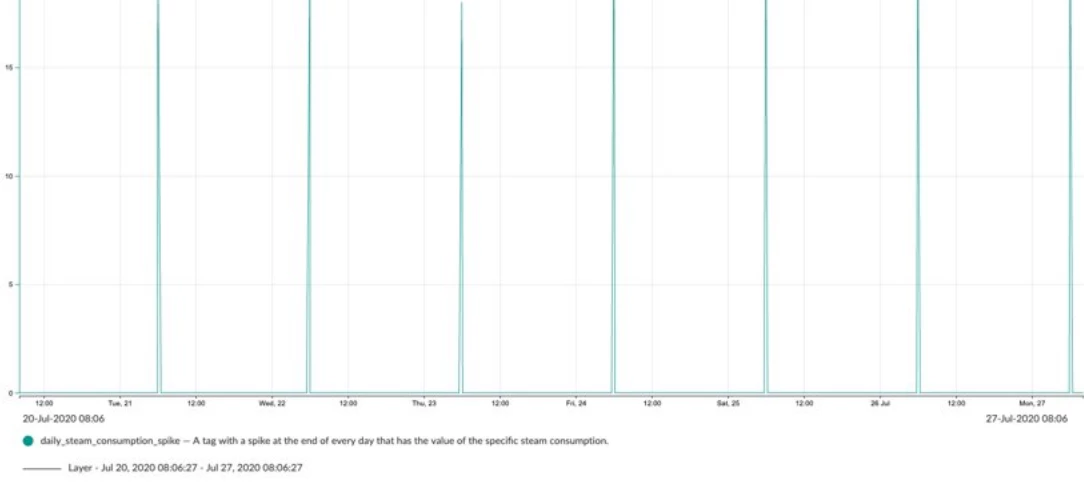
BackgroundThis use case shows how to report the daily specific consumption of a resource and make a comparison between them on a daily basis. At this point we have no way of comparing or keeping track of the specific consumption of a resource. If we would have a tag for this it would be a big help in terms of process and resources optimization, as well as bring economic value. The daily specific consumption will be reported as spikes at the end of each day. As a starting point we have a tag containing our specific consumption of the last 24h. By being able to have an overview of the spikes of all days we can optimize our process. Challenge1. Get a spike at the end of each day with the 24h of total consumption.2. Get the value of different days to compare them. SolutionCreating daily consumption spikesThe daily consumption spikes tag is created by using the formula tagbuilder, we use an if statement where the check is day1=day2 with day 1 current time tag (day) and day 2 1m delayed time
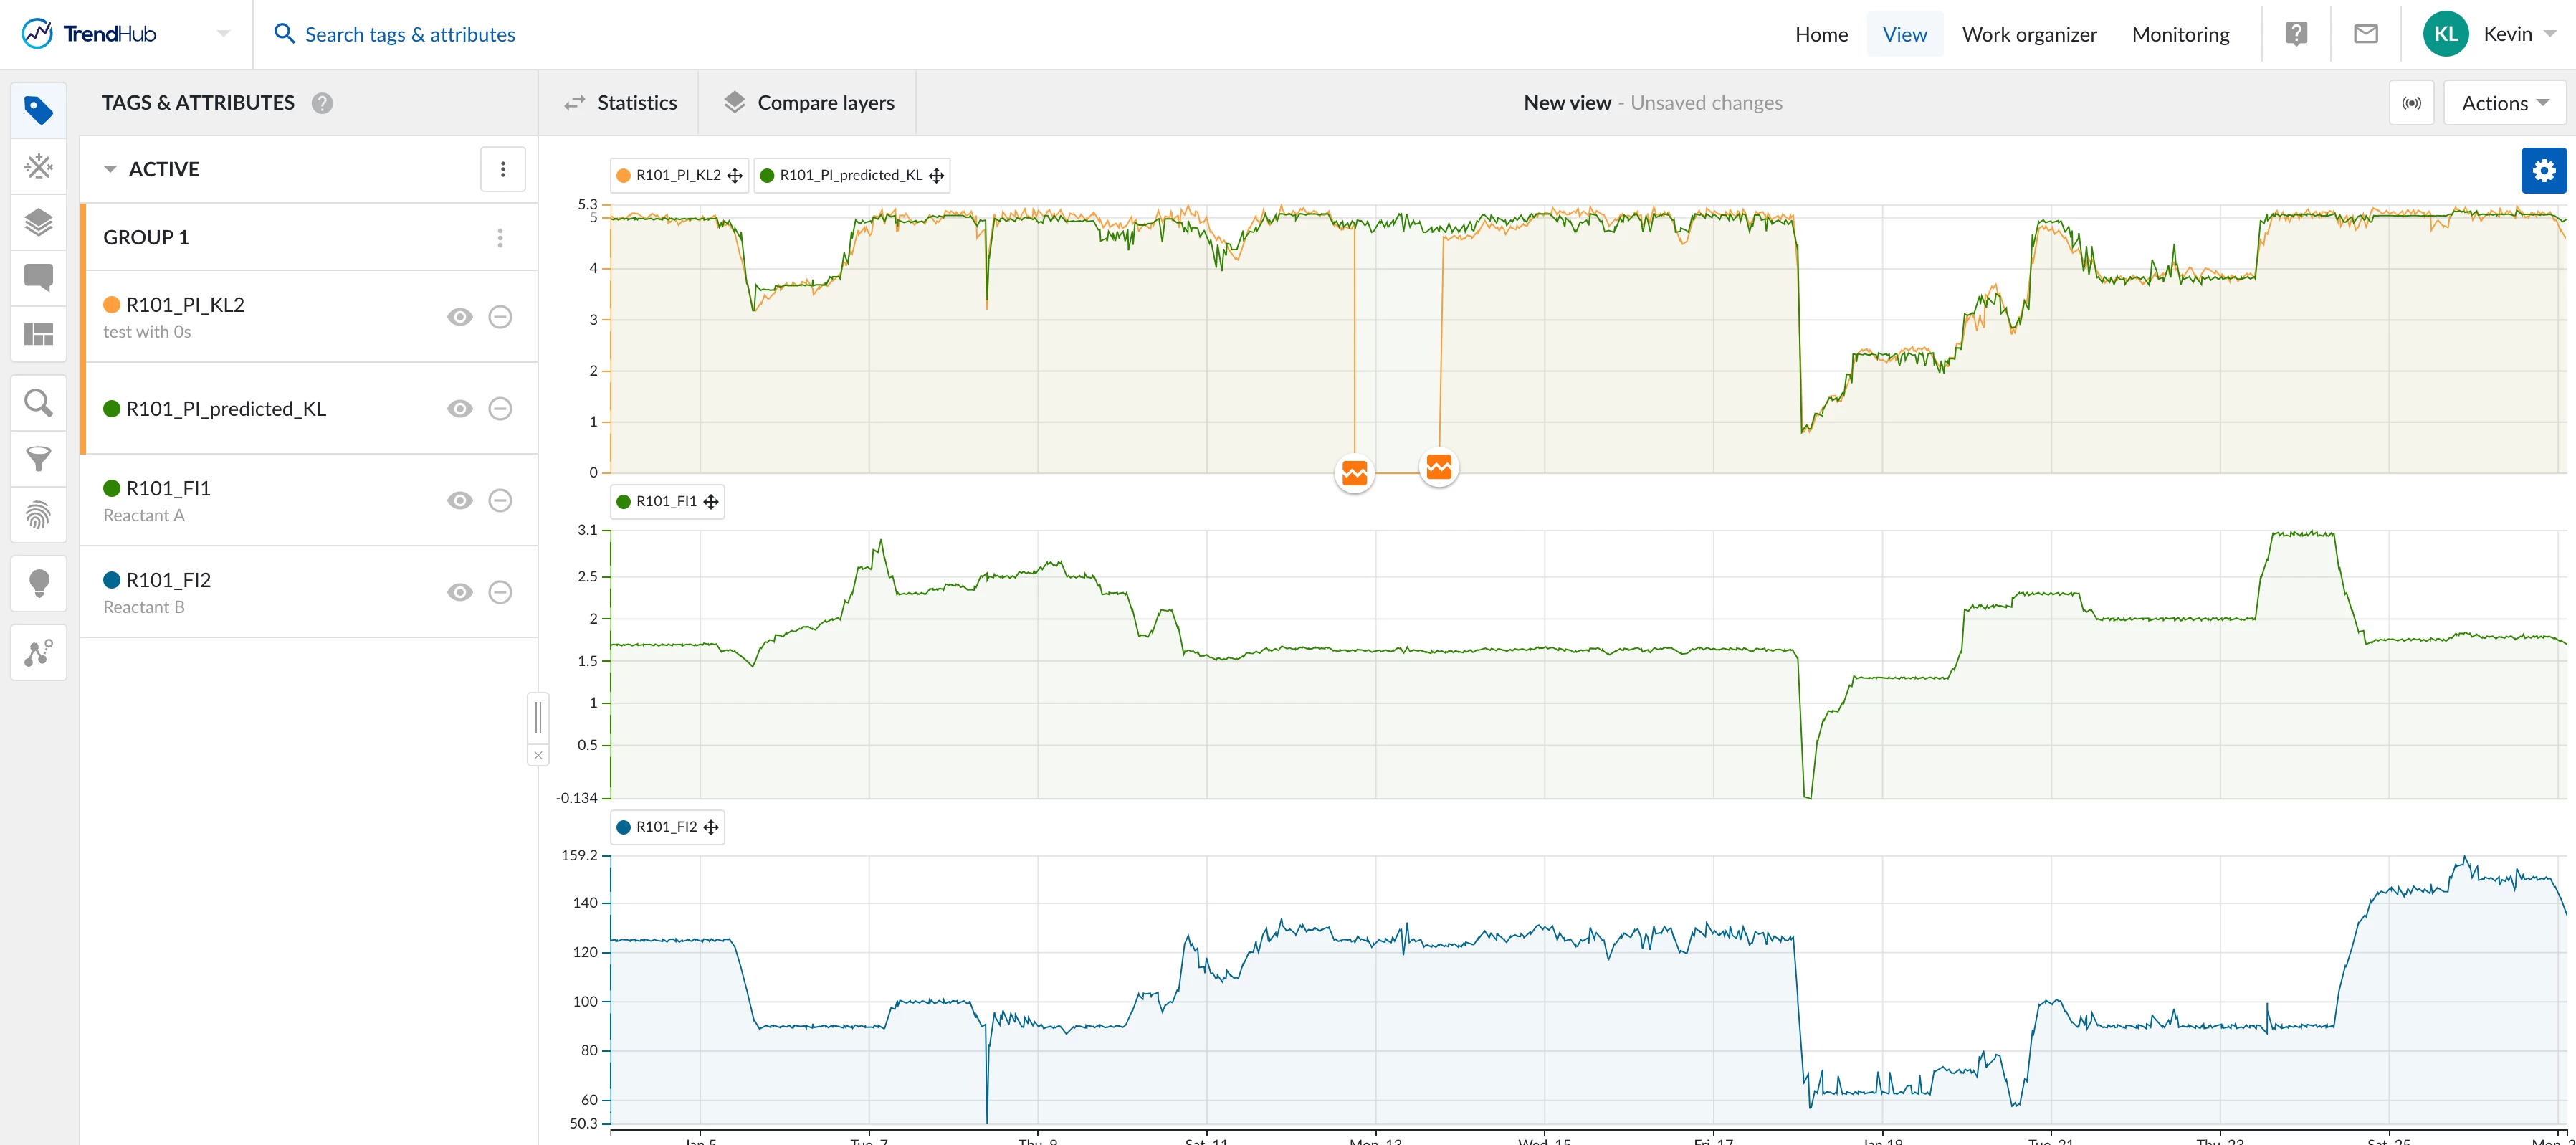
BackgroundIn any industry, It is not uncommon for plant managers to have questions about the status and efficiency of manufacturing units. There can be several hundred or even thousand tags for a single process depending on its complexity. Creating a dashboard allows users to centralize the trends for those tags in a digestible format. ChallengeOftentimes, production questions from management can be time-consuming and even intimidating to address. When a plant manager inquired about the status of a unit in the morning, a dashboard was created to ease their concerns within hours. SolutionIdentify relevant tags Consider what KPIs and parameters are important to management. Some examples are: flow rates for high-cost reactants extrusion rates (if applicable) expensive or shared utilities quality data production rates safety valve positions flaring All of these have financial, environmental, or safety implications.Create views and monitors Create TrendHub views and group r
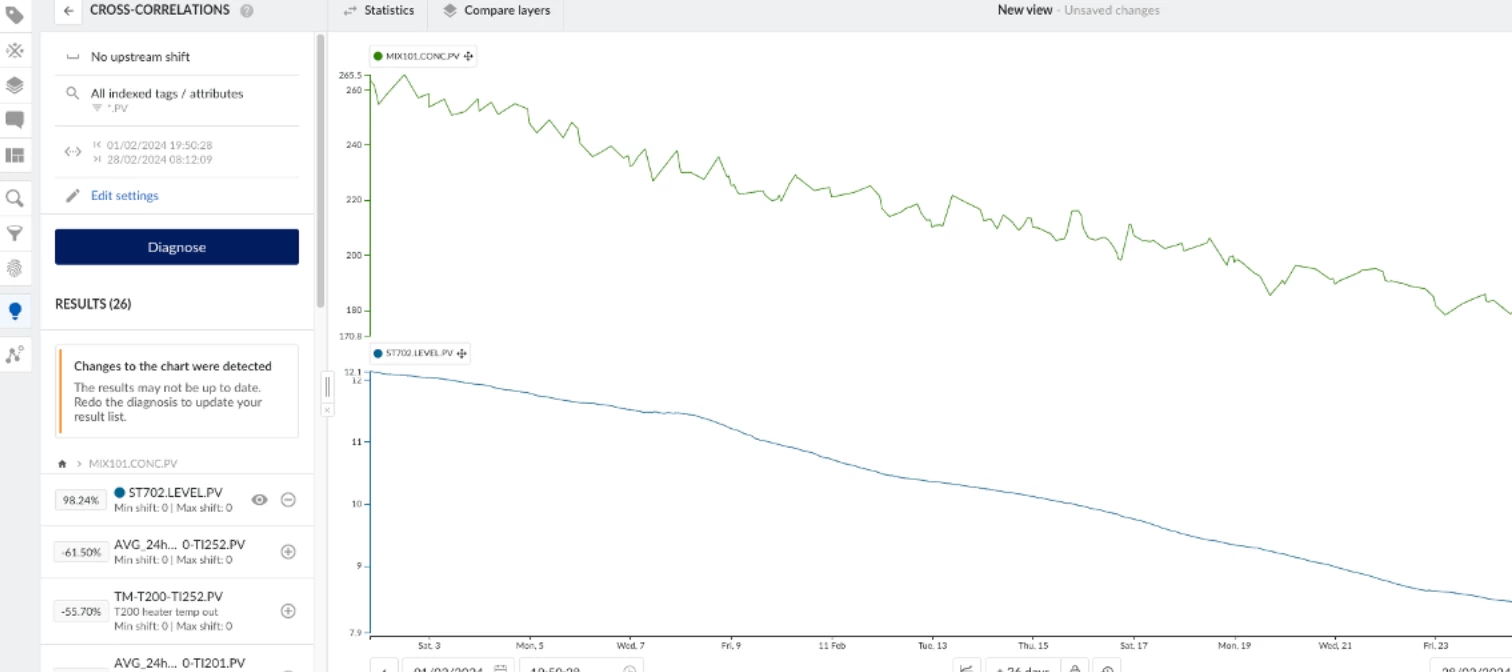
BackgroundThis use case is centered on a mixing tank, where the streams of two distinct products are joined. The intermediate products are continuously added to the mixing tank until it reaches a certain level. At that point, a sample is taken for analysis, and the tank is emptied into a larger storage tank. ChallengeOver the span of a few weeks, there have been crystallization issues with one of the two products. This undesired crystallization interferes with sensors leading to unreliable measurements, which can lead to quality issues as the mixture is processed further.We needed to find the root cause of these crystallization issues. SolutionVisualizing the problem The composition of the samples from the mixing tank was displayed in TrendMiner. Here we could clearly see the concentration of the solvent product decreasing, which is an obvious cause of the other product crystallizing. The question thus becomes: why are we receiving less solvent from our production process? Hypothesis
To continue to inspire you, the TrendMiner team will regularly add new (general) use cases to this Community. At the same time, we invite all TrendMiner users to share your own use cases.Why share your use case?By sharing your own use case, you …… showcase your TrendMiner knowledge to the wider analytics community 👑… may receive feedback and ideas to further expand your case and generate even more value for your company 💸… inspire other users to make the most out of TrendMiner 📈… help the TrendMiner team understand how our product helps you and further develop it towards your needs 💪How to share your use case?To share your use case, create a new topic in the Use Cases category of this Community. Pick Conversation as the topic type. Feel free to use the template below to include all relevant information.NoteMake sure you are registered and logged into the Community first. Create your account or log in via the LOGIN button top right or the links in the previous sentence. BackgroundP
While we will be sharing use cases in this Community category on a regular basis, our TrendMiner website also contains many use case one-pagers and videos to draw inspiration from, filterable by topic, industry, role and analytics maturity. Check them out via https://www.trendminer.com/use-cases.
Already have an account? Login
No account yet? Create an account
Enter your E-mail address. We'll send you an e-mail with instructions to reset your password.