











Discover our learning resources and share your experiences...
Recently active
Hi 👋🏻Here you can find Kuraray’s presentation at TrendLab 2025 Americas.In this session, Kyle Tillman shares his perspective on how he uses TrendMiner at Kuraray. He also talks about how TrendMiner can support different roles, including field technicians, board technicians and shift supervisors.The presentation gives a clear view of how TrendMiner fits into daily work and how it helps teams make better, faster decisions.The recording 👇
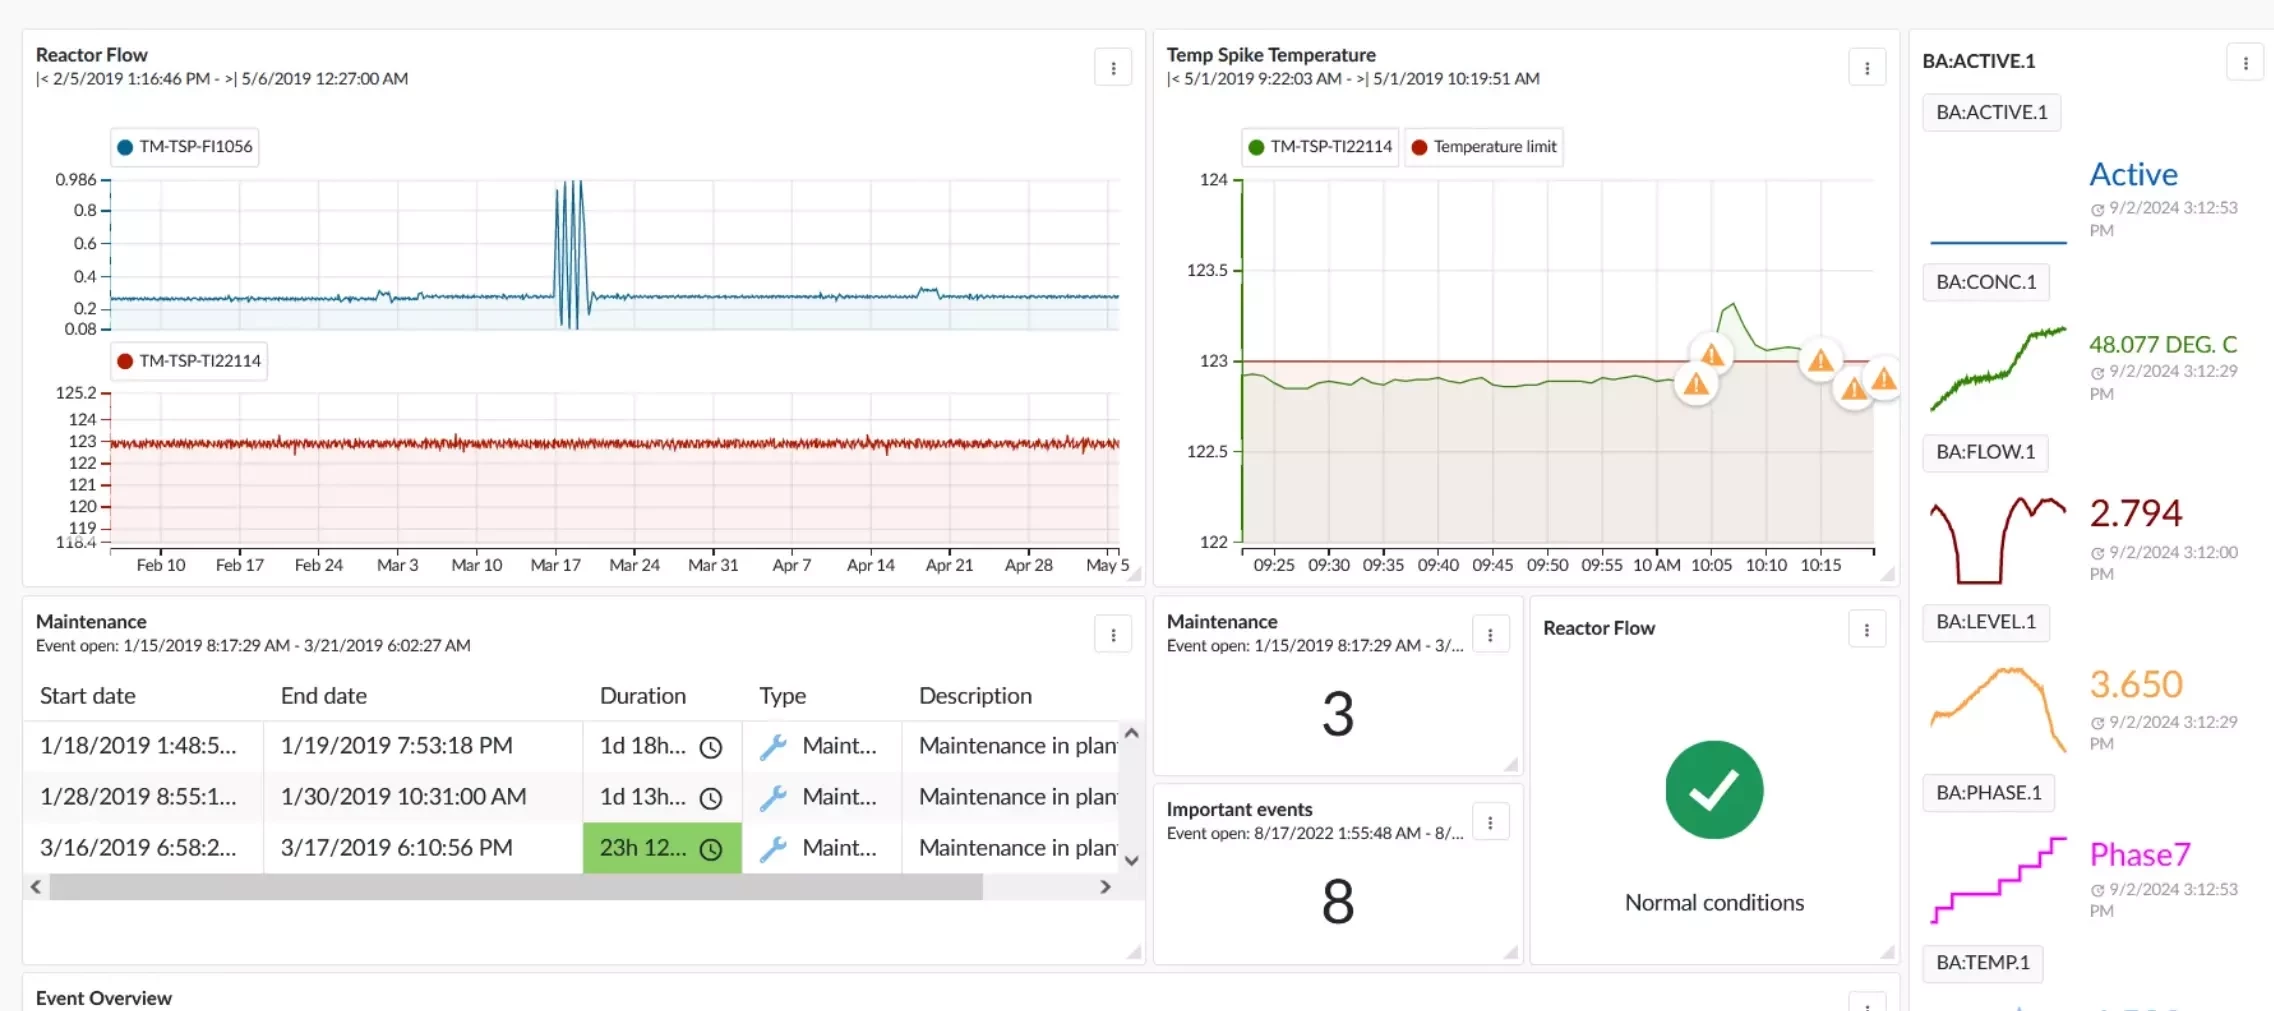
This article comes from a surging trend we see here at TrendMiner: Successful TrendMiner customers have adopted DashHub and dashboards across different teams and departments. Why? Dashboards bring together the work done by key users in the TrendMiner platform, ranging from root cause analysis to operations monitoring and reporting.The end goal is to utilize the knowledge from process experts, combine it with process data into helicopter views that drive process improvements. Have you adopted DashHub in your daily operations and/or reporting workflow? If so, we’d be happy to hear about it in the comments! If you’re not quite there yet, this overview of previous community posts can help you get started: Create an asset overview dashboard: https://community.trendminer.com/use-cases-46/keep-plant-managers-informed-with-a-unit-overview-dashboard-105 Dashboard building blocks: How many times did X happen in a selected timeframe?: https://community.trendminer.com/use-cases-46/daily-counte
When creating a CSR (certificate signing request) in TrendMiner it is important to always include a SAN (subject alternative name). What is a SAN?It is a field in an SSL certificate that allows a single certificate to secure multiple domain names, subdomains, or IP addresses. This is useful for protecting various websites on a single IP address or for securing a main domain along with its variants. Why is it mandatory to fill in a SAN?Browsers used to rely on the CN (common name), but this has led to security vulnerabilities.That is why standards have been updated to require browsers to use the SAN extension.All modern browsers ignore the CN and strictly validate hostnames via SAN.If you leave SAN empty, your CA will issue a certificate without valid hostnames, and TrendMiner will appear as “Not secure” even with a signed certificate. Where can I fill in the SAN during creation of a CSR?When creating a SAN in Edge manager, the SAN can be filled in at the bottom of the Certificate Signi
Hi everyone,You can now watch the recording of the TrendMiner 2025.R3.0 release webinar!This release helps make quicker decisions, analyze data with more detail, and see process health more clearly.📑 TrendMiner 2025.R3.0 Webinar SlidesFor more detailed information, you can read the Release Notes.🎥 Recording:
Scatter Plots have long been one of TrendMiner’s most powerful tools to visualize relationships between process parameters. In recent releases, this functionality has been significantly enhanced — making it easier than ever to uncover correlations, compare time periods, and analyze performance in detail.Let’s take a closer look at what’s new and how you can apply these features in practice using a heat exchanger example. 1. From Trends to Scatter PlotsWhen analyzing process data in TrendHub, you can easily switch the visualization type under “Select chart type” — directly below the focus chart. From there, you can change the default Stacked trend view to Trend or Scatter.In the Multi scatter view, all visible tags from your active tag list are plotted against each other. Each combination generates a scatter plot, accompanied by histograms and a regression line (initially linear), including its regression coefficient.This multi-dimensional view is ideal for identifying correlations be
Following up on my last post “High Energy Costs Driving New Use Cases for TrendMiner”, I’m excited to share our latest content updates focused on utility and cleanroom performance optimization. In industrial environments, utilities and facility systems - power, heating/cooling, water, air, and waste management - are the backbone of production and can represent up to 10% of total product costs. Key challenges:⚙️ Maximizing asset reliability and avoiding costly downtime🌱 Optimizing energy use for sustainable production🧼 Preventing fouling and improving maintenance efficiency📊 Reporting on sustainability and emissions performance How TrendMiner helps:🔹 Data-driven energy optimization for more sustainable operations🔹 Predictive insights to prevent unplanned downtime🔹 Continuous monitoring & reporting for compliance and transparency Curious how our customers achieve these results?👉 Explore our new page: “Industrial Analytics for Utilities & Facility Optimization”and discover
Hello everyone! 👋In this TrendLab 2025 Europe presentation, our VP of Customer Success Frederick Motte and Ben Schulze (@Ben) from Bayer share their experience working together on data integration. They explain how they brought additional data sets into TrendMiner and how this collaboration helped create real value.🎬 Watch this session to hear why context data matters, how they approached connectivity and implementation, what worked well, the lessons they learned, and the results and next steps of this journey.
Daily production tracking isn't just a routine: it's the backbone of efficiency, quality, and transparency in manufacturing. But are you making the most of TrendMiner’s powerful features? Whether you are a TrendMiner veteran or just starting out, a few small habits can make a big difference in how you track performance and communicate across shifts. Start Your Day with a Clear ViewImagine starting your workday or shift with a dashboard that shows you exactly what you need: no more hunting for numbers or flipping between screens. TrendMiner dashboards let you visualize your most important metrics (throughput, yield, downtime, quality, and more) at a glance.Use tiles to compare production in the last few days, monitor targets vs. actuals, and spot trends before they become issues. Set up a dashboard tailored to your role —operator, engineer, or manager— and see how much time you save each day! Ensure a Smooth Shift HandoverEver come in for your shift and wonder, „What happened last nigh
Hello,In this TrendLab 2025 Europe presentation, Ruud Timmermans (@ruudtim) from Nobian describes his journey managing TrendMiner from the IT side.He talked about the balance between upgrades, governance, and user engagement.Ruud’s story is packed with honest and practical lessons that many of you can relate to.🎬 Watch his presentation to hear what worked, what didn’t, and what he’d do differently.
One of my favorite uses for the multi-layer scatter plots is to check performance before and after asset maintenance. Not only is it interesting to compare how much the situation improved by maintenance, you can also see at a glance whether your maintenance is always equally successful, and whether you are performing it at a consistent level of degraded performance.This scatter plot shows the correlation between product throughput (x-axis) and specific energy consumption (y-axis) for 1 day periods just before and after 3 maintenance events. I picked the same color for the layer just before and after each maintenance event, so I can see what layers belong together. What we can indeed see from this plot is that the specific energy consumption decreases after maintenance, always returning to approximately the same level. This indicates maintenance was done successfully each time. We should also notice though that we clearly do not perform maintenance at the same level of performance degra
Here’s an inspiring session from TrendLab 2025 Europe 🎬In this presentation, Matthijs Geerse (@MatthijsG) from Huntsman shares how their team uses TrendMiner for process health monitoring, from defining what a “healthy process state” means to creating different dashboards that help operators, engineers, and experts collaborate better.💡 You’ll discover: How Huntsman structured health monitoring across teams Real TrendMiner use cases from their sites How they apply Event Analytics and Parallel Coordinates How their monitoring approach evolved with TrendMiner’s data-driven capabilities 👉 Watch the full presentation here:
Introduction At TrendLab, we talked about the added value of contextual information. This topic generated a lot of interest and follow-up discussion, which is why I’m taking the opportunity here to share some additional information to help you on the way. We’ll focus on ODBC here, but the steps and queries for JDBC will be very similar.When setting up a Generic ODBC data source in TrendMiner for the Event capability, you'll need to configure multiple queries to properly integrate your event data. In this post, we’ll demonstrate all required query structures for connecting to databases like SQL Server, Oracle, or other ODBC-compatible sources.Note that the queries may need small adjustments to work with your specific data source. E.g. to only select 10 rows in MySQL, you’d use “LIMIT 10”, whereas Oracle uses a different syntax, e.g. “Rownum<=10”. Sometimes the syntax may even slightly vary between database versions. Therefore we always recommend checking the documentation of your spe
To optimize performance and reduce unnecessary load on data sources, TrendMiner automatically detects and manages dormant tags starting from version 2025.R2.0. What are dormant tags?A tag becomes dormant when it has not received any new data for more than one year — meaning the End of Data timestamp is over 12 months old.When this happens, TrendMiner will stop attempting to index the tag, and its update cycle will display “Never.”This mechanism ensures that resources are not wasted on polling inactive or obsolete signals, keeping your system efficient. How are dormant tags detected and managed?Dormant tags are identified automatically once per day by a background process.When plotting a dormant tag in the focus chart, indexing will be retriggered and the tag will resume its normal indexing status. Administrators can also manually resume forward indexing of these tags by clicking the play button in the index manager. If the indexing call did not receive any new data, the tag will automa
When disk usage exceeds certain thresholds, administrators are notified through the appliance’s monitoring configuration within the Edge Portal.Below are the two most common disk email alert scenarios, along with explanations and recommended actions. Case 1: Disk Alert for ‘/mnt/data’ Description:A warning alert is triggered when the /mnt/data mount — which stores most of TrendMiner’s critical application data such as indexes, packages, logs, and databases — exceeds 80% usage.For email alert example, you might receive an message indicating that only 19.98% (19,127 MiB) of space remains available as shown below.Recommended Action:Follow Disk space extention guide to extend storage. Expanding storage ensures TrendMiner can continue to write data and perform indexing operations without interruption. Case 2: Disk Alert for Root Directory ‘/’ Description:A warning alert is also raised when the root directory (/), which holds the server’s system-critical files — including boot files, binarie
Time and again, one of the key benefits TrendMiner users share is the ability to receive alerts via email, text, or simply historize them for later review and easy analysis. But when you're in the field, away from your desk, dealing with an issue, those conventional alerts can be siloed and hard to track as a team. In one of my recent conversations with a group of users, they shared they were sending alerts directly to Microsoft Teams. This is a neat collaborative approach that perfectly aligns with TrendMiner's focus on making collaboration easier and brings your notifications right where your team is. Here are the simple steps you can take to set up this integration: 🛠️ Setting Up TrendMiner Alerts to TeamsSet up a dedicated Teams channel for the project or area of interest. (See here for how to create a channel in Teams.) Obtain the channel email address: Select "More Options" next to the channel's name, and then select "Get email address." Copy the email address. Configure a mon
Have you ever struggled to find the right tag while using TrendMiner?When the historian’s tag names are full of digits and cryptic codes, it can be tough to know which sensor or process you’re actually looking at. That confusion can slow down your analysis and make it harder to trust your findings. That’s where the Digital Twin Manager comes in. 🧠 With this tool, application administrators can build an asset framework — a clear, folder-like structure that organises every piece of process equipment in a logical, user-friendly way.Here’s how it helps: 🗂️ Organise your assets by creating nodes (folders) for each equipment. 🏷️ Add and rename tags to use meaningful names and descriptions. 🔍 Simplify searches — instead of typing complex codes, just browse the framework to find what you need. Asset Framework of a Combined Cycle No more confusion. No more wasted time figuring out which sensor is which.Just faster insights and smarter decisions. Digital Twin Manager = Time saved + Produ
Hi everyone,You can now watch the recording of the TrendMiner 2025.R2.0 release webinar!This release introduces smarter collaboration, improved usability, and stronger performance across the board. 📑 Slides: TrendMiner 2025.R2.0 Webinar Slides🎥 Recording: Let us know your thoughts in the comments below! 🚀
📌 BackgroundIn many chemical plants, reactors contain catalyst beds that gradually lose activity and need to be replaced on a routine basis. Because catalyst life can vary significantly, it is difficult to predict exactly when a failure will occur.A premature catalyst failure would have a major impact on production, supply chain, and maintenance. Therefore, it is critical to plan preventative maintenance well in advance – at least a few weeks prior to failure – to avoid costly unplanned downtime and production losses. 🎯 ChallengeWith TrendMiner, a workflow can be set up to monitor and predict catalyst performance: Searching on Process Values The first step is to use value-based searches to identify when process values reach certain limits. These searches can be saved and later used as the basis for monitors. In this way, early indicators, warning levels, and critical conditions can be defined, all providing valuable insights into catalyst performance. Event analytics can of course a
Did you know you could add certain content from outside of TrendMiner to your dashboards? The external content tile allows you to add additional information to your dashboards that doesn’t necessary originate from your process data. Many often include training videos, images, and Visio block flow diagrams, stored on SharePoint pages, to give better context to those interpreting dashboards shared across teams or shown on control room displays.@EdwardB recently shared some interesting sources that allow embedding weather related widgets to DashHub. For this, you can try these twosources: https://widget.airnow.gov/ and https://embed.windy.com/Do you have other interesting applications you’d like to share with the community? Comment below!
Sometimes when upgrading TrendMiner, it looks like nothing is happening after clicking Start Upgrade or after the file upload has completed.Below are the most common reasons why the upgrade might not start — and how to fix them: 1. Corrupted Upgrade PackageIn some cases, the upgrade package can get corrupted during download.It will appear to upload successfully, but the upgrade never starts.You can verify the integrity of your package by following this article:If the checksum doesn’t match, re-download the file before trying again. 2. Wrong Upgrade Package (pre-2024.R3.1 versions)For older TrendMiner versions, there are two different upgrade packages: MLHub Non-MLHub If you upload the wrong package type, the upload completes but the upgrade won’t start.Make sure to select the package that matches your license type (Basic or MLHub).💡 Starting from version 2024.R3.1, there’s only one unified upgrade package — no more confusion! 3. Network InterferenceIf you’re running the upgrade from
In this article we'll dive into a worklow to create a multivariate parallel coordinates plot that can be filtered by time and calculations. In this specific image, we're looking at the hourly averages of measurements (Power, in and outgoing: flow, temperature, pressure) of a Sales Gas Compressor unit Workflow 1. Import time-tags as DISCRETE (I'm attaching the .csv file for Europe - Brussels, let us know if you need another timezone in the comments!). This action only needs to be done once. Once imported, the tags will be available for all users. 2. Pick the desired Context period on the bottom of the focus chart in TrendHub 3. Add the relevant tags to your process and the imported [t]HOUR, [t]DAY, [t]MONTH and [t]YEAR tags from step 1. 4. Do a Value based search to look for the condition when the hour-tag was constant: 5. Add Calculations that relate to the process you'd like to understand better. Typically, having the average of all other relevant tags should be a good starting point
Hello! 👋The recording of our September 2025 live training DashHub – Create a Control Center of your Process is now available! 🎉DashHub is your central control center where you can keep track of multiple aspects of your process. Learn how to create a personalized dashboard to count specific events, analyze their distribution over time, monitor the current values of your key process variables, and visualize their correlations. In addition, you can enrich your dashboard by embedding external content for example, a process flow diagram that provides extra insights and enables an even more comprehensive view of your plant.Recordings:🇩🇪 German🇬🇧 English Have any questions? Write them in the comments below 😊
Sometimes TrendMiner Support may ask you for a HAR file (HTTP Archive). This file records the network traffic in your browser while you reproduce an issue. It helps us investigate any network-related issues.Below you can find an explanation on how to generate the HAR file depending on which browser you are using.Chrome/Edge Press F12 or ctrl + shift + I (Windows) or cmd + option + I (Mac) to open Developer Tools. Click on the record button on the top left (red circle) in the below example screenshot (record network log). Make sure the ‘Preserve log’ (blue rectangle) option is enabled. Recreate the issue in TrendMiner. Click on the download button (green circle) Mozilla Firefox Open Firefox. Press F12 or ctrl + shift + E to open the Network Monitor. Click the trash/bin icon to clear any old entries. Reproduce the issue in TrendMiner. Right-click anywhere in the list → Save All As HAR. Once the HAR file has been exported, it can be uploaded through a ticket or e-mail.
💡 Did you know you’re already saving money every time you use TrendMiner?When most people think of TrendMiner, they think about the insights and optimisations it enables for specific use cases. But here’s something many overlook: the software itself is already delivering value from day one. 🔎 How?Every search, every analysis, and every dashboard created in TrendMiner saves time compared to traditional methods. Less time spent digging for data = more time focusing on decisions that matter. 📊 Turning time into numbersWe’ve started calculating what this means in real terms: 🖥️ Every TrendMiner session saves you time that would’ve been spent digging through data the old way. On average, that’s about €40 saved per session (based on ~5% of an engineer’s yearly salary). 🛎 Set up a few monitors? That’s another €1,000 saved by reducing alarm costs and staying on top of your variables. 📊 And those dashboards packed with decision-making info? They can be worth up to €3,000 in savings. ✨
The old saying “Change is the only constant” couldn’t be more true for the TrendMiner platform. With every release, TrendMiner introduces new functionality—driven by valuable feedback from our end users. Each release brings enhancements and fresh capabilities, but with progress comes a natural challenge: the knowledge gap. Users may not always be fully aware of the latest features, or how to best apply them for maximum value.Here are three ways organizations can ensure their teams stay current and continue to extract the most value from TrendMiner:Continuous Learning Build a culture of ongoing learning by incorporating regular knowledge sessions into your team’s cadence. Focus each session on one or two features, ensuring that the team not only learns about them but also understands how to apply them in daily work. Feedback and Knowledge Sharing Sessions Your CSM is one of your strongest advisors. Schedule quarterly sessions with them so they can hear direct feedback from end users. T
Already have an account? Login
No account yet? Create an account
Enter your E-mail address. We'll send you an e-mail with instructions to reset your password.