





















Discover our learning resources and share your experiences...
Recently active
My colleague @Charlotte recently shared a great post highlighting various ways to use the TrendMiner Home page. Since then, one of my customers identified a specific use-case that I would like to share here with you:Standardizing Tag Naming Conventions (e.g., Aggregations) in TrendMinerThe Home page can be used to communicate your organization’s preferred naming conventions for newly created tags. Following a consistent naming standard helps ensure that tag names are easily recognizable, making it clear to everyone what type of aggregation each tag represents. Using consistent naming conventions for new tags can have a significant impact as it allows users to easily reuse work already done by others.
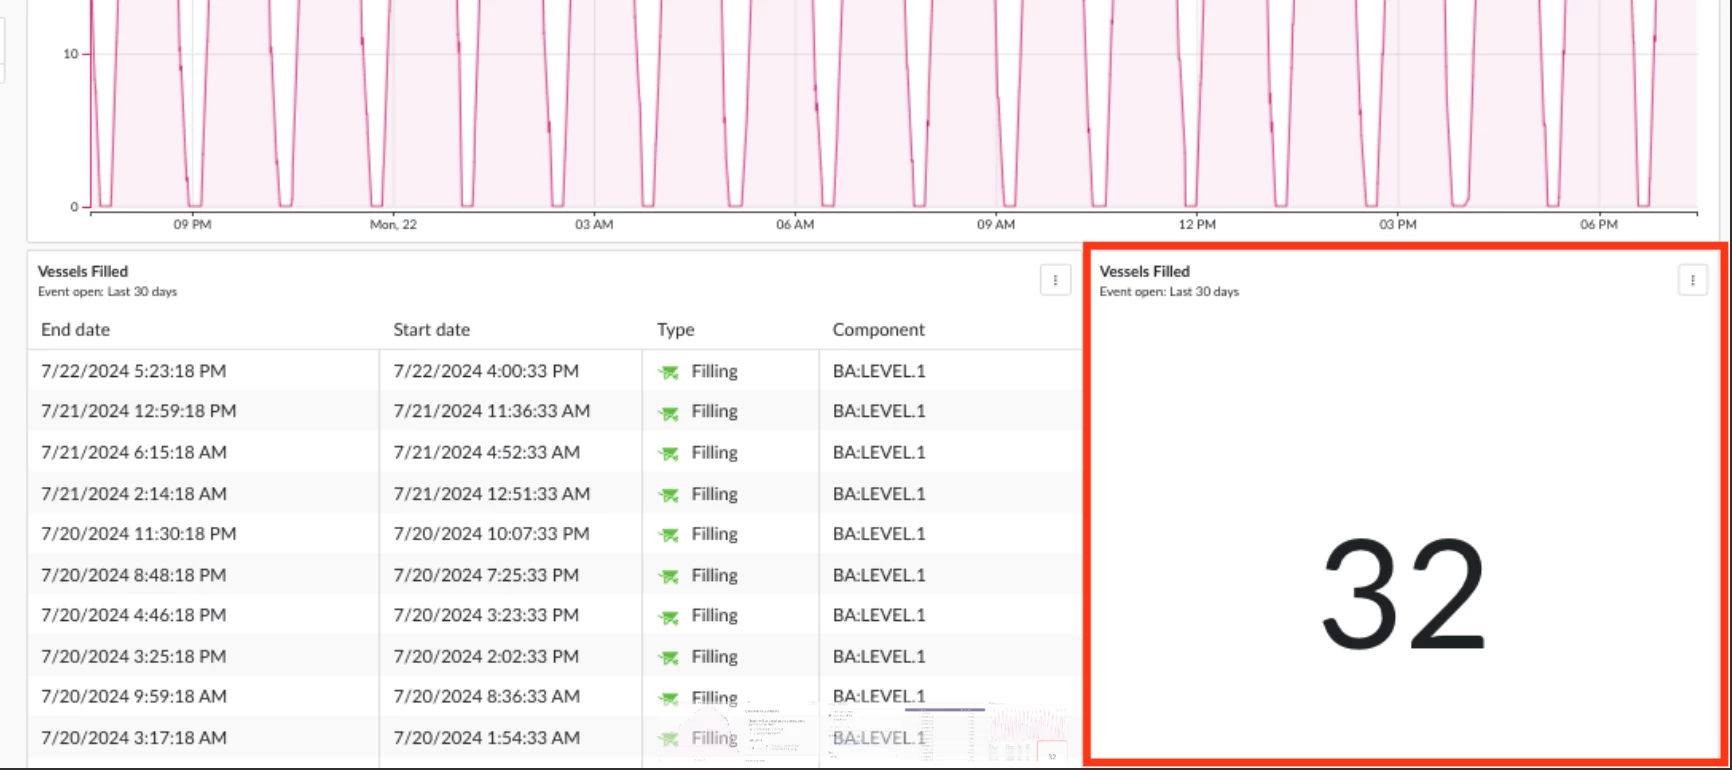
Background Manufacturing plants often rely on both railcars and trucks to ship their products to distributors, retailers, or directly to customers. The choice between these transportation methods depends on various factors such as the nature of the goods, cost, distance, and delivery time requirements. Railcars are typically used for bulk shipments of heavy and large quantities of goods, such as raw materials, chemicals, and pellets, due to their capacity to transport large volumes efficiently over long distances. Conversely, trucks offer greater flexibility and are ideal for shorter distances and time-sensitive deliveries, providing door-to-door service and easier access to various destinations. This combination of transportation methods allows manufacturing plants to optimize their logistics and ensure timely and cost-effective distribution of their products. Method #1 can be reviewed here. Although that method yields accurate results, it may not always capture events of varying du
If you notice a discrepancy for a specific tag between the data in the historian and in TrendMiner, one of the first troubleshooting steps is to reindex the tag.Reindexing will remove all existing index data for the tag and fetch fresh data directly from the historian.To do this you can follow the steps outlined below: Make sure your account has the Application Administrator role: TrendMiner Admin Roles Open the Index Manager Index Manager & Performance Overview Search for the tag Enter the tag name in the search box. Choose your preferred option. (see screenshot) Bin icon: Deletes the complete index for the tag. The tag will be reindexed automatically the next time it is used. Circular arrows: Deletes and immediately reindexes the tag, without waiting for it to be used.
BackgroundInterpreting time-series data at a glance can be challenging, especially when process experts need a quick update on what’s happening in their plant. Instead of scanning raw trends directly, it’s often more effective to use a dashboard that highlights key incidents and events. With TrendMiner, dashboards can be configured to automatically track setpoints, rapid process changes, error codes, and much more, providing immediate insights without the need for manual data review. As an example, we will set up a productivity tracking system to monitor sulfur production in a sulfur recovery plant.Sulfur recovery plant dashboard. Workflow1. Set up monitoring on interesting sensor data2. Create a new ContextHub view with corresponding filters3. Add a Gantt-chart tile on a dashboard.4. Configure new Context Types (Optional; Admin rights)--------------------------------------------------------------------------------------------------------------------------------------------1. Set up mo
BackgroundTrendMiner provides a set of Time/Date Tags by default with installation. These tags deliver time and date information directly from the system – independent of any process data – and are available for all time zones: TM_hour_* – Hour of the day TM_day-* – Day of the month TM_month_* – Month TM_year_* – Year Time/Date Tags in TrendMinerTime/Date Tags for all time zones in TrendMinerThey allow for precise configuration of searches, calculations, or monitors tied to specific moments or recurring time patterns – think daily reports at a fixed time or tracking values at the beginning of each month.For full details, see the User Guide. 🎓 Deep Dive & Training ResourceWant to go further? Check out these advanced trainings for practical, hands-on examples: Mastering Tag Types in TrendMiner – Tips, Tricks & Hands-On Exercises (Exercise 3) Event Analytics in Action: Gain Deeper Process Insights (Exercise 2) 🌟 Community Inspiration – Related PostsHere are great examp
We're seeing a clear shift:🛠️ Customers are now applying TrendMiner not just for production, but increasingly for utilities like steam, cooling water, HVAC, and especially cleanrooms. Why Cleanroom Monitoring?💡 Cleanrooms can account for up to 50–75% of total facility energy demand💨 Inefficient operations & redundancies: air systems often run at full power - even when not needed⚠️ Energy peaks are detected too late📋 Compliance pressure (GMP, ISO, FDA) Key Challenges: Tons of data, but too few insights• 🐌 Root-cause analyses remain time-consuming• 🚫 Limited live monitoring & alerting• 🧱 Data silos block collaboration Smarter Monitoring with TrendMiner💡 No-code time-series analytics: data-driven decision-making cuts analysis time from days to minutes📈 Analyze years of historical data in seconds to spot trends and inefficiencies🔍 Real-time insights into asset performance and critical parameters like airflow, temperature, pressure, and particle count⚠️ Detect anomalies &a
Why is a disaster recovery checklist necessary?Even on a stable system, the following risks always exist: Failed upgrades Corrupt virtual machines Hardware crashes Human error Preparing for these scenarios now will save significant time and stress later. Recovery essentials:VM Snapshot Best to set up a daily or weekly snapshot schedule. Always take an extra snapshot before any major configuration change or upgrade. Snapshot includes full system state (OS, TrendMiner, configurations, etc.) Easiest way to recover. Remote Full Backup (Documentation full back-up) Best to set up a daily or weekly remote back-up schedule. Stored on cloud or local S3 storage. Includes database, index data, and basic system configuration. Also easy to recover from disaster. Local Database Backup (Documentation database back-up) Always take this before a major configuration change or upgrade. Download outside of the VM. Does not include index data, system configuration, PMML models, etc.
I am making this post to create some more awareness about the upcoming Solution Training at TrendLab 2025.In this workshop aimed towards more experienced TrendMiner users, you will learn to use TrendMiner as a platform for building custom solution packages. Throughout the training, you will follow our solutions approach to set up Overall Equipment Effectiveness (OEE) KPI reporting on one of your own batch or continuous processes. Our team of TrendMiner experts will then guide you through the steps of:Capturing production events (batches, operating periods, …) with a monitor in TrendMiner, and collecting them as context items in a ContextHub view Setting up a Python function that loads the context items from this ContextHub view, and writes loss data to their context fields Capturing regular periods (weeks, months, etc.) as context items with another monitor Setting up a second Python function which calculates the availability, productivity, quality and OEE parameters for these regular
In this example we will embed an interactive HTML page located in a Google S3 bucket into a TrendMiner Dashboard tile. 1. Get Your HTML File Ready:Make sure the HTML file (example.html) is self-contained: Don’t use any server-side code like PHP Keep all JavaScript and CSS either inline or linked via relative paths (no external dependencies that require a web server) 2. Upload to a Google Cloud Storage Bucket:You can do this directly in the Google Cloud Console: Choose an existing bucket or create a new one Upload your example.html file 3. Make the File Public (for testing or sharing):Once uploaded: Click the bucket Go to the Permissions tab Click “Add principal” Add AllUsers as principal Apply the Environment and Storage Object Viewer role Save Important to note here is that this will make the dynamic HTML available to anyone. For sensitive data, a more secure solution should be used. You can for example host the dynamic HTML on an internal server only accessible thr
Do you have a timeseries connection to an Aveva PI historian? Are you connecting to the PI data archive using TrendMiner’s ‘PI data archive (PI AF SDK)’ provider?If that case it could be worth checking if you have connection pooling enabled. What is connection pooling?When connection pooling is disabled, each TrendMiner data request will create a new connection to the historian. When the data is received the connection is closed again. When connection pooling is enabled a connection will be set up and multiple requests will be sent over that same connection. Why should I enabled connection pooling?Setting up a new connection causes some overhead, and hence delay in the data responses. Since TrendMiner does a lot of data requests (up to 5k requests per minute or more) the overhead of setting up this connection can be significant. Enabling connection pooling reduces this overhead significantly and therefor can lead to high performance improvements in fetching tag data (used for indexing
Produced batches often need to meet specific quality criteria depending on the product grade. In TrendMiner, dashboards can be used to monitor the different types of batches produced. For example, batches can be categorized by parameters such as product grade or quality. This provides a clear, real-time overview of how many batches of each category were produced over a user-defined time period. As an example, we’ll use lab quality data from a polymer production process. The plant produces three different product grades, and quality is evaluated based on viscosity measurements. WorkflowCreate a new ContextHub view Add a ContextHub counter tile Repeat for multiple trackers 1. Create a new ContextHub viewThe content of a ContextHub list can be customized using a variety of filters. Common filter options include time period, fields, tags or assets, types, and keywords. For our specific case, we are going to select:Period filter: Event open in range from 01/01/2018 until 01/01/2020 Field fi
Trying to assign more than 8 vCPUs to your TrendMiner virtual appliance on ESXi and running into a hard limit? You’re not alone—this usually comes down to a few ESXi-specific settings and limitations. Here are the main reasons you might be hitting that cap: ESXi Licensing LimitsIf you’re using the free version of VMware ESXi (vSphere Hypervisor), you’re limited to 8 vCPUs per VM. Upgrading to a paid vSphere license (e.g., Standard or Enterprise Plus) is required to go beyond this limit. VM Hardware CompatibilityThe virtual hardware version of your VM can also restrict the maximum number of vCPUs. Ensure that your VM is configured to use hardware compatibility version 7 or later.You can do this by editing the VM settings or right-clicking the VM and selecting:“Compatibility > Synchronize hardware compatibility with host”More details are available in the VMware documentation. Host CPU CapacityLastly, your physical host must have enough logical cores available. ESXi won’t allow you to
Hello! 👋The recording of our July 2025 live training Event Analytics in Action: Gain Deeper Process Insight is now available! 🎉🎥 Watch now to discover how to:🔹 Analyze batch processes by product type🔹 Identify patterns in continuous operations using the TM_day* tag🔹 Detect key process events🔹 Compare performance across different production days🔹 Turn raw data into actionable insights for optimizationRecordings:🇩🇪 German🇬🇧 EnglishSlides:🇩🇪 German🇬🇧 EnglishHave any questions? Write them in the comments below 😊
📌 BackgroundIn batch processes in the process industry, quality fluctuations occasionally occur—for example, in the form of low concentration in the end product. These "bad batches" lead to increased waste, uncertainty in process control, and additional analysis effort. Often, it is unclear what exactly causes these deviations. 📌 ObjectiveThis article demonstrates how TrendMiner’s Event Analytics can be used to identify the root causes of poor batch quality. Value-based search, calculated KPIs, and graphical evaluations are employed. 🎯 ChallengeHow can all relevant batches of a product type be systematically identified, meaningful KPIs calculated, and differences between good and poor-quality batches visualized using Event Analytics? 🛠️ Solution1. Load tagsFirst, load all relevant process data (e.g., pressure, temperature, concentration, fill level, dosing behavior) into TrendHub. Example of a TrendHub view 2. Define time intervalLimit the time window to the relevant period to foc
Looking to get more out of TrendMiner in the second half of the year? Here are some key goals our most successful customers have set for themselves, along with concrete steps you can take now to get them moving... ✅ Drive Adoption & Engagement Survey your user base – Run a quick poll or informal interviews to uncover training needs, knowledge gaps, and barriers to wider use. Make sure to act on their feedback! Promote TrendMiner Coaches – Identify 2-3 power users and empower them to support others with a toolkit including templates, tips, and mini training sessions. Create internal buzz – Share wins, dashboards, and success stories in team meetings or internal channels to keep TrendMiner top of mind. 📊 Automate Routine Reporting List your top 3 manual reports – Ask your teams which reports are eating up time. Then work on automating them through TrendMiner views, searches, context items and dashboards. Embed reports where work happens – Link dashboards in shift handover too
Hey Admins,We’ve got a question for you:Will you be joining us (and the support team!) at TrendLab 2025?🗓 We’re hosting two TrendLab events, so you can pick the one that suits you best: TrendLab Europe: 📍 Cologne, Germany 📅 Day 1: 30th September – hands-on admin training TrendLab Americas: 📍 Houston, USA 📅 Day 1: 8th October – hands-on admin training Both events are the perfect opportunity to level up your admin skills, explore best practices, and get direct answers from our experts. Live and in person.🎟 Early Bird alert:Book before 31 July to enjoy 25% off.👉 Europe: Grab your Early Bird tickets👉 Americas: Grab your Early Bird ticketsWant to see the full program or find more details?📚 Check it out on the TrendMiner Community.We hope to see you there, because nothing beats meeting our awesome admins face-to-face.Cheers,The TrendMiner Team
❓What Are Custom Calculations?Custom Calculations in TrendMiner empower advanced users to define new tags using Python scripts, enabling analytics and data transformations beyond what’s available through standard formulas or aggregations. This feature is powerful for creating custom KPIs or logic that’s specific to your plant or workflow. 🗂️ Repo Structure OverviewThe TrendMinerCS/custom-calculations repo is your go-to resource for getting started with Custom Calculations. It includes: A Jupyter notebook with a detailed explanation of the workings of custom calculations and the TrendMiner sdk. A detailed README outlining the possibilities with examples and screenshot. Example Python scripts for common calculation scenarios. Templates to help you quickly build your own scripts. Clearly organized folders so you can browse by use-case or script type. Browsing this repo is the fastest way to kickstart your own Custom Calculations and learn best practices directly from TrendMiner a
When rolling out an advanced analytics platform like TrendMiner, teams often focus intensely on technical implementation while unintentionally neglecting the human side of adoption. Those unspoken concerns and undiscussed challenges among users can silently undermine your entire initiative, eroding potential ROI and slowing adoption to a crawl. By proactively engaging in difficult but necessary conversations, organizations can accelerate adoption, strengthen alignment, and foster a true culture of continuous improvement.Here are three compelling reasons to embrace tough conversations with all stakeholders - from pioneers to end users: Prevent Costly Late-Stage Resistance Unaddressed concerns grow into passive resistance with measurable business impact Teams naturally revert to familiar methods when their struggles go unheard Early dialogue protects your investment by addressing issues before they become roadblocks Surface Hidden Barriers to Success Frontline teams pos
BackgroundThis use case shows how to create a dashboard that shows an overview of the number of valve openings and the current valve state. In the past this used to be a non-automated procedure, requiring a lot of manual work to count the amount The objective of this dashboard is to streamline and automate the monitoring of valve operations, reducing manual effort and enhancing real-time visibility.Example of a valve opening tagSolutionThe solution includes the following steps:Value based search: Create a value based search to identify all the valve opening events you want to display on your dashboard. Save this search for later use. Contextualisation of Events: Select “Add as Context Item” for the identified events. Fill in the context item details such as Component (valve opening tag), Type (High Flow), and Description (Valve open). Monitor Setup: Go to the “Monitoring” tab and enable a new monitor. Use the saved valve opening search and set it to create a context item for each event
Have you ever had a situation were you would like to see how your measurement is doing and how close is it of its allowed Upper and Lower limits? Have you ever tried to create a dashboard where you can easily see the status of your equipment and in which zone is it performing?Up until now, in TrendMiner we could create a monitor that tells/notify us whenever a limit is surpassed or reached. Additionally, in a dashboard we could create a monitor tile that will change when this monitor has been triggered. But this only allows 2 status: On/Off, Good/Bad, etc. If we want to have more statuses, we were already limited by the use of only one tile. Monitor tile configured with 2 states. An easy workaround is usually to create a traffic light system, where monitor tiles are used for each different status. For example, in a tank level, in order to have Low, Intermediate and High level, we would need 3 monitor tiles as shown in the picture. Traffic light system with 3 states for a tank level. H
Hello 🖐🏻Here is the recording of Sascha Hartung’s presentation at TrendLab Europe 2024. Synthos, a leading chemical producer specializing in polymer-based products, faced a challenge in managing their data. With production and failure data stored in SAP and Excel across multiple factories, as well as the need to gather maintenance data, their processes were highly manual and time consuming.Their goal was to consolidate these efforts into one platform for all their needs (analysis, asset performance management, reporting, operation management, monitoring, and dashboarding). During their testing phase with TrendMiner, Synthos saw its potential to streamline these tasks efficiently.Sascha Hartung @Sascha from Synthos shares how they’re transforming these manual, siloed processes into an integrated solution using TrendMiner. Watch his presentation for inspiration on how data analytics can revolutionize industrial workflows and make you save time.Enjoy!
I recently joined a training on active listening and it made me realize how often we go through conversations without really paying attention. Sometimes we just nod along while thinking about something else or wait for our turn to talk. Active listening means being fully present and focusing on what the other person is saying. It’s about showing that you care about their words asking questions and not jumping in too quickly with your own thoughts.Whether you're a project manager or not, active listening is a powerful tool anyone can use. It helps build stronger relationships, avoids misunderstandings, and makes conversations more meaningful. When people feel genuinely heard, they’re more likely to open up, collaborate, and work through challenges together. Honestly, it’s a small shift that can make a big difference in both work and everyday life.
Ensuring your datasources are consistently available and performing optimally is key to maintaining a healthy TrendMiner environment. Fortunately, the Connector API provides several endpoints that can help automate health monitoring for your datasources. Below, we explain how you can leverage these API calls to detect connection issues and performance degradation — even with a simple script. Accessing connector API:https://documentation.trendminer.com/en/using-the-connector-api.html Checking if Datasources Are AvailableTo determine if a datasource is down (showing red status in the UI), use the following two-step process: Retrieve all datasource IDs Call: GET /database This returns a list of configured datasources with their IDs. Test each datasource connection For each ID from step 1, call:GET /database/{id}/test This will return whether the datasource is currently healthy or not (basic connectivity check). You can automate this process with a script that runs these calls regularly
Hello! 👋The recording of our May 2025 webinar Statistical Reporting Tricks: Track the Danger of Climate Change is now available! 🎥 Check it out to learn: How to retrieve CO₂ emissions Use the focus chart and statistics table to detect and assess high emission periods Create formulas to define exceeded limits Build value-based searches for high emissions Generate daily emission reports Analyze trends using time tags and advanced calculations Visualize emissions data with a scatter plot Recordings:German English Slides:German EnglishGot any questions? Write them in the comments below 😊Enjoy learning! 🚀
Improve asset availability and energy efficiency with self-service analytics 📌 BackgroundIn many process-driven industries, heat exchangers play a crucial role in maintaining efficient thermal operations. For example, process gases exiting a shell-and-tube heat exchanger are often routed to downstream equipment like baghouse filters, which are subject to strict temperature limits. To prevent safety risks or equipment damage, conservative temperature thresholds are often used—typically set well below actual specification limits.However, over time, systems may experience efficiency losses due to fouling, which can increase outlet temperatures and push operations closer to critical thresholds. Being able to detect and address fouling at an early stage is key to maintaining asset availability and optimizing energy use. ⚙️ ChallengeFouling inside heat exchangers reduces thermal efficiency, leading to higher outlet temperatures and potential process deviations.To ensure safe and optimal ope
Already have an account? Login
No account yet? Create an account
Enter your E-mail address. We'll send you an e-mail with instructions to reset your password.