












Discover our learning resources and share your experiences...
Recently active
Are you a TrendMiner admin and did you receive an email with subject "TrendMiner restart required" containing the following message, then this post might interest you:Dear administrator,The internal cluster certificates of your TrendMiner installation are about to expire within 90 days.Please reboot TrendMiner to refresh the certificates.Kind regards,TrendMiner Why did you get this email?The TrendMiner appliance internally uses certificates to secure the communication between the different microservices. Similar to regular TLS certificates which you upload to secure the communication between the users’ computers and the TrendMiner server, these internal certificates also expire after a while and need to be renewed.In contrast to the TLS certificates which secure client-server traffic and which need to be renewed by the TrendMiner server admin explicitly, the internal cluster certificates are renewed automatically by the server when the server is rebooted.If you received the above email
Knowing how certain settings impact our main KPIs is key in fine-tuning a process to driveproductivity. Such a feat can only be accomplished by actually measuring the relevant KPIs in acomparative study.In this use case, you will see how you can very quickly assess the impact of process conditions on agiven KPI during a selected period. process conditions: equipment on/off, product grade, day of the week... KPI: energy usage, setpoint deviations, total production, ... period of choice: the period you currently have on your focus chartAn example would be assessing the impact our Advanced Process Controller (APC) has on the averagedeviation of our Process Value (PV) from our Setpoint (SP). Is it actually doing its job in reducing theaverage deviation? Step 1 - Defining the KPIAssuming we don't already have a KPI tag, we will need to use a formula to calculate the KPI we want.In the case of APC performance, a typical KPI would be the absolute value of the difference between a process valu
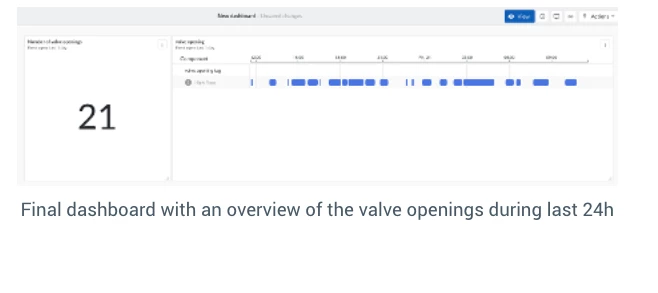
TrendMiner can be used to automatically track the status of our sensor data during a batch process. To prevent losing time continuously having to check process trends, we can make a dashboard telling the user immediately the status of the production process during a period of choice. This can also detect problems, which were missed before and have had a big impact on, for example, product quality. As an example, we will look at the production of an active pharmaceutical ingredient in a batch process. To show the principle, we are going to monitor if a batch is currently running, and subsequently we are going to check whether the temperature does not increase too much during the batch. WorkflowSet up monitoring on timeseries we want to track Create a new ContextHub view with corresponding filters Add a Gantt-chart tile on a dashboard Optional for admins: configure the context item Set up monitoring on timeseries we want to trackFirst step is to track the events we want to have on our da
Hi everyone, Here is the recording of the recent TrendMiner 2025.R1.0 release webinar. With this release, we introduce a more streamlined and intuitive analytics experience and enhance efficiency, clarity, and simplicity to make it easier to extract insights and act on your data. Access the Slides: TrendMiner 2025.R1.0 Release Slides Enjoy watching and don't forget to share your feedback in the comments below! 🚀 Recording:
TrendMiner is always evolving—thanks to your feedback! But with new features regularly rolling out, how can teams make sure those innovations create real impact in their day-to-day work? One reliable method is using the SMART framework. It’s something I’ve applied across both small and large projects, and it’s helped drive consistent results. Here’s how you can do the same. S - SpecificDefine a clear use case. Example: Identify past anomalies for a pump and present them in a simplified table, Gantt chart, and a 30-day count view for the operations team. M - MeasurableEstablish a metric to drive down the number of events over the next year. Example: Reduce the anomalies in the pump by 25% within the next year. A - AttainableThe measurable goal should be achievable taking into consideration the current workload and the available capacity. Example: Have a designated team (or a process expert) to drive the effort in analyzing the data and sharing insights before fully implementing the proj
Background:In many use cases, it’s not just the type of event that matters — its duration can be just as important. While TrendMiner allows you to define a minimum duration when performing a search, sometimes you want to look only for events that fall within a specific time window, for example between 2 and 5 hours.Here's how to do that using two simple approaches. ✅ Option A: Refine Search Results by Duration RangeUse this approach to narrow down results after you’ve run your main search.Steps: Run your event search based on the relevant value or digital criteria. In the search panel, click "Event Analytics". Set the minimum duration to 2 hours and the maximum duration to 5 hours. Your results list will now only show events that occurred within this defined time frame. 🔍 Tip: Perfect for quickly filtering without modifying your original search setup. Search for events with a duration of 2 hours to 5 hours 🚫 Option B: Exclude Longer Events Using a Static FilterThis method help
As your team explores the full potential of TrendMiner, collaboration is essential for a successful rollout and continued growth. One effective way to stay aligned is by creating a dedicated Microsoft Teams group.Why create a Teams group?✅ Share Use Cases – Celebrate wins and share solved problems, creative workflows, and helpful insights.✅ Centralize Tips & Guides – Keep quick tutorials and helpful hints easily accessible for everyone.✅ Measure Engagement – Track group activity (visits, messages, interactions) as an indirect measure of TrendMiner's adoption and utilization across your company.By creating a central hub for all things TrendMiner, your team stays focused, aligned, and continuously improving. Think of it as your internal success tracker — a place to learn, share, and grow.Get in touch with your Microsoft Teams administrator and request a monthly activity report for your TrendMiner group. This report can show how often the group is being accessed, how many members are
We’ve just launched our brand new website featuring the best customer success stories! 🚀Discover how companies across industries are using TrendMiner to drive insights, improve efficiency, and make smarter decisions. 👉 Explore the stories here: https://www.trendminer.com/customer-success-storiesLet us know which story inspires you most - or share your own!
On a daily basis, a process expert evaluates key process parameters. In TrendMiner, a process expert can easily populate a dashboard with the preferred parameters making your most important process parameters available with one click of a button. As an example, we are going to visualize the general status of a heat exchanger on a dashboard for the last 24 hours to immediately follow up on important process changes. WorkflowSaving important trends in the work organizer Creating a TrendHub view tile on a dashboard in DashHub Creating a traffic light tile on a dashboard Saving important trends in the work organizerFirstly, we need to save the correct views we want to put on our dashboard. This can be done in TrendHub where we can save the view that is visualized.For our case we are going to:Load the tags related to the heat exchanger: TM-T200.* Visualize the outlet temperature of the product, and the inlet and outlet temperature of the heating medium. Put the focus chart on 24 hours, fix
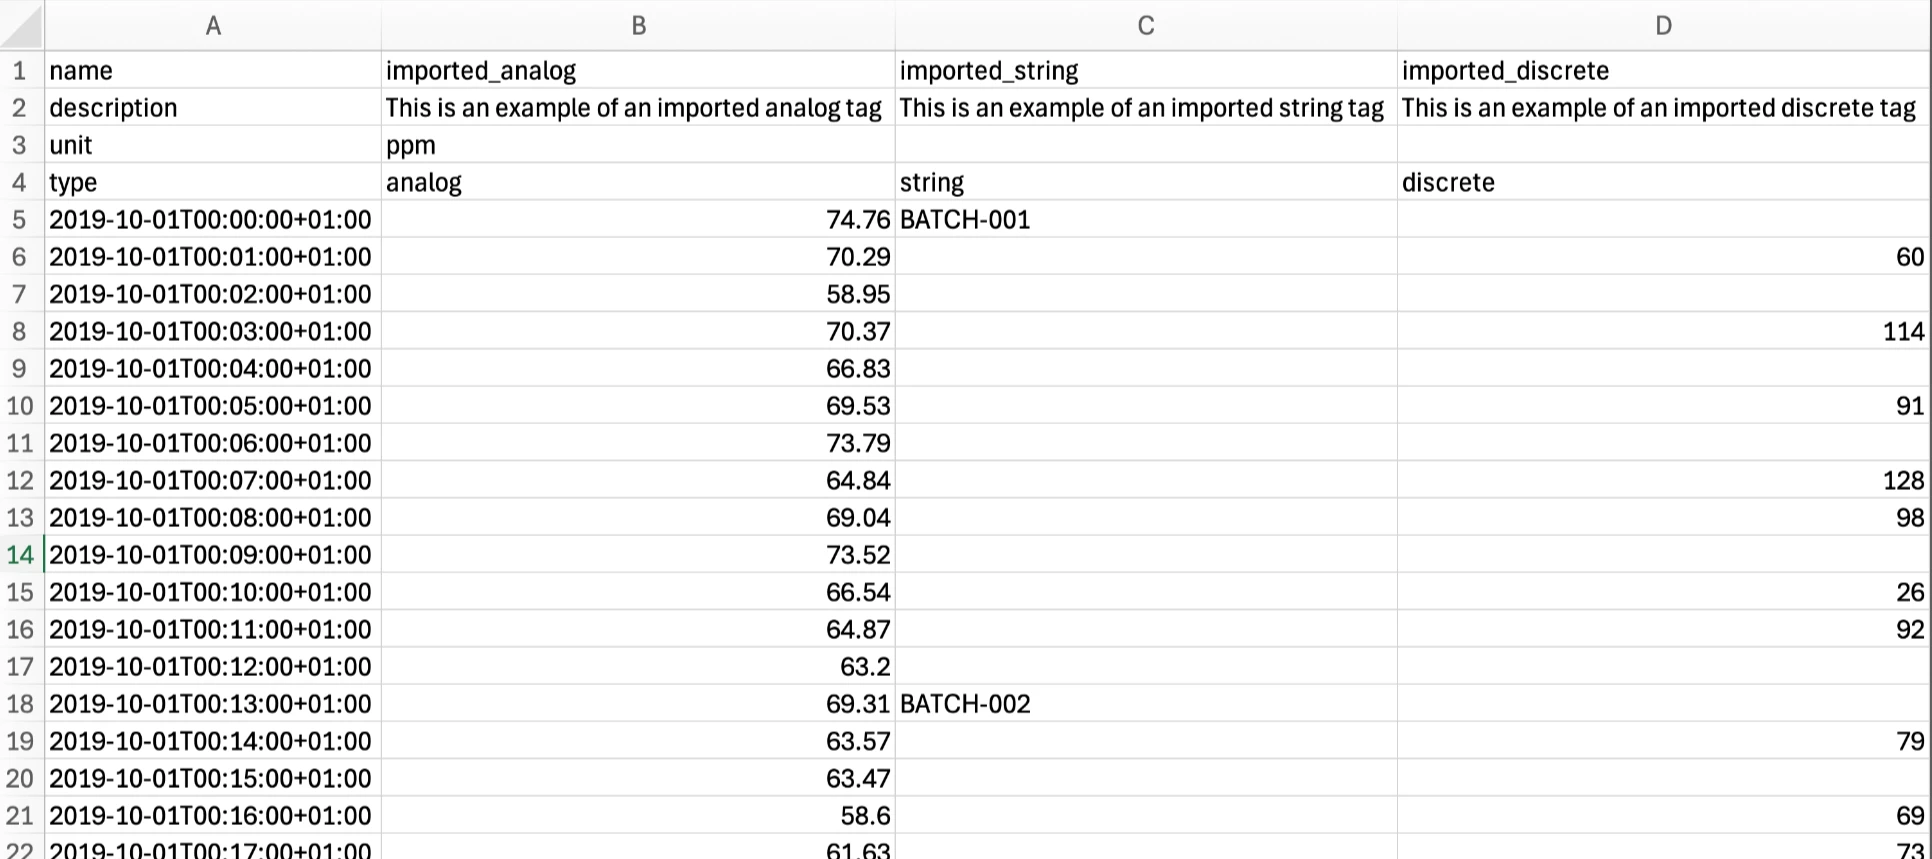
Ever wanted to include data from external sources in your TrendMiner analysis?The Tag Builder Data Import functionality allows you to do just that! This post will equip you with some helpful tips and tricks to ensure a smooth data import experience.Getting StartedSupported File Format: Only CSV (comma-separated values) files are supported for data import. Make sure your data is formatted correctly before proceeding. File Requirements: File Extension: Ensure your file has the proper .csv extension. Encoding: Use UTF-8 encoding for your CSV file. File Size: The maximum file size supported is 45 MB. Data FormattingFirst Row: List the tag names you want to appear in TrendMiner in this row (Column 2 onwards). These names must be unique. Second Row: Descriptions for each tag can be added in this row, but are optional (Column 2 onwards). Third Row: Specify the units of measurement for each tag in this row, but are optional (Column 2 onwards). Fourth Row: Define the tag type (analog, discret
💡 Extending the concept of hourly averages to shorter time intervals📎 Related post: Calculations of hourly average consumption values 📌 BackgroundIn process industries, consumption monitoring of resources such as steam, water, electricity, and compressed air is key to ensuring energy efficiency and sustainable operations. While hourly averages provide a solid overview, shorter intervals like 30 minutes can deliver even more granular insights—especially for fast-changing processes or detailed performance analysis.👉 In some cases, half-hourly averages are required for regulatory reporting, for example to comply with environmental or energy-related limits imposed by authorities. Having these values available ensures transparency and compliance. 🎯 ChallengeHow can we calculate average consumption values for fixed 30-minute intervals and distinguish them from rolling values? And how can we ensure the values are visualized cleanly as stepwise changes in the trend? 🛠️ Solution✅ Rolling
In TrendMiner, time tags play a crucial role in process analysis. They allow users to define and segment data based on specific hours, days, weeks, months, quarters, and years, enabling precise time-based calculations. Many key performance indicators (KPIs) rely on time-based reporting, such as: Daily production totals Hourly average flowrates Monthly energy usage Quarterly business metrics Example of HOUR time tags in TrendMiner.TrendMiner time tags for the US Central time zone.Why Time Tags Matter in TrendMinerTime tags can be especially useful when defining formula tags that incorporate a time-based component. For example, you might need to calculate averages over specific time intervals or align production metrics with financial reporting periods. Like any other tag, time tags can also be utilized in value-based searches and monitors.Handling Less Common Time ZonesTrendMiner includes predefined time tags for commonly used time zones, making it easy to apply time-based ana
I just saw a question pop up in the community asking whether TrendMiner has built-in steam equations. While they are not built-in, here’s a way to start using steam equations in TrendMiner...A while back, I implemented the numeric steam table equations found on https://iapws.org/relguide/IF97-Rev.html into TrendMiner Formula Tags. I am posting those here in the hopes it can help some other users too.The attached zip file contains txt files for formulas that can be copy-pasted into a Tag Builder formula for steam table calculations.Formula units are currently in Celsius and bar, so you might need to adjust accordingly. Text search and replace should work to change the input units, for example 'P' -> '(P*1000)' to use tags that are in mbar. To change the output unit you can simply multiply the formula by a constant value.
In this series of posts, we will dive into the building blocks for a personal TrendMiner Coach Success plan. The topic of this third post is Knowledge. Previous posts: Awareness, Desire Question: How do you handle knowledge sharing in your company? Let us know in the comments below! Why focus on making users knowledgeable on TrendMiner?Knowledge on using the TrendMiner platform transforms into the ability for users to gather insights to fuel process improvements. From a change perspective, it’s vital to give users a sense of experience with the TrendMiner platform as it gives them peace of mind. When asking people to change, we ask people to leave previous ways of working behind. This can be scary as it also means people are asked to give up their built-up experience - and comfort - with a promise of benefits after adoption. Definition of KnowledgeThe information, training and education necessary for people to know how to change. Knowledge & enablementWe’ve created awareness and
Is your team making the most out of TrendMiner? As roles shift, objectives evolve, and technology advances, relying on outdated insights can lead to missed opportunities. A simple yet effective way to stay ahead is by conducting a survey to assess how your organization is using TrendMiner and the value users are getting from it. Why Conduct a Survey?Unbiased and Anonymous Feedback – Some users may feel uncomfortable sharing opinions openly. A survey provides a safe space for honest insights. Identify Areas for Improvement – Understanding user experiences helps pinpoint challenges and opportunities for optimization. Collaborate with Your CSM – Discussing survey results with your Customer Success Manager can uncover ways to enhance adoption and maximize TrendMiner’s impact. Key Questions to Include in Your SurveyConsider adding the following questions to gather meaningful insights:Name (optional) How frequently do you use TrendMiner? (Daily, Weekly, Monthly, Only when needed) How satisfi
We need your feedback to make sure our future direction fits the needs and preferences of our customers regarding deployment models, release process, security, and monitoring tooling.What to Expect?The survey covers current deployment models, release update strategies, and security/monitoring tooling. Some sections explore future possibilities like Kubernetes-based deployments, the usage of Cloud Services like EKS or AKS, and the potential evolution of the Virtual Appliance.Target audience:System Administrators & Technical StakeholdersThe survey is mostly multiple choice and should take approximately 10 minutes to complete.Thank you for your time and valuable input!Direct link: https://forms.office.com/e/cNsTs9BcLt
This tutorial will guide you through pulling ContextHub data into Power BI using Power Query. We'll cover the following steps:Setting up parameters to make the queries dynamic. Writing queries for API interaction. Explaining how to configure the entire setup step by step.In this example, we will use a context type filter and a time filter. However, other filters are also available and can be applied similarly. Step 1: Define ParametersTo make the queries dynamic, define the necessary parameters in Power Query Editor. Make sure to change the name to the given name, otherwise the script won’t work.How to Add ParametersOpen Power Query Editor. Go to the Manage Parameters section in the toolbar. Click New Parameter to define a parameter.Required Parameters:ServerURL Name: ServerURL Description: The base URL of your TrendMiner server. Type: Text Current Value: Enter your TrendMiner server URL (e.g., https://myserver.trendminer.com). Item Type List Name: itemTypeList Description: List o
Linearly extrapolating the current trend of a tag to estimate what its value is going to be at some point in the future is the probably the simplest form of predictive analytics, but it can be very effective in some cases.We can implement such a tag by taking the current value of the tag and adding the increase over the last x time. For example, if a tag currently has a value of 10, and the value 5 minutes ago was 8, then we would extrapolate that the value in 5 minutes will be 10 + (10-8) = 12. An obvious requirement is that the tag behaves somewhat linearly within the scope of our use case. Linear extrapolation will always be a simplification of your process. Of course, should you have a more custom formula can predict future values better you should implement that formula instead.After creating the predictive tag we will typically want to monitor on those future values to receive early warnings. Some use cases I have seen solved this way include:Monitor whether a tank will be empty
Hello! 👋The recording of our March 2025 webinar Mastering Tag Types in TrendMiner – Tips, Tricks & Hands-On Exercises is now available!🎥 Check it out to learn:How to create stepped formula tags Explore the power of string tags in formulas Learn how to work efficiently with time tagsRecordings:German EnglishAccess the Slides:German EnglishGot any questions? Write them in the comments below 😊Enjoy learning! 🚀
IntroductionDaily production is a key performance indicator (KPI) in continuous processes, helping process experts track efficiency and performance. However, in many cases, daily production is not readily available as a default variable in data historians. A recent question in the TrendMiner Community addressed this challenge: How to calculate a daily average of a signal with a single result per day?. This article explains four different approaches to calculating daily production in TrendMiner, depending on the user’s needs. 1️⃣ Continuous Rolling Last 24 Hours Production 📌 BackgroundThis method ensures that at any given time, the production of the last 24 hours is always available as a continuously updating value. This is particularly useful for real-time monitoring and trend analysis.🛠 Steps Load the relevant tag related to production. Set the context and focus chart to visualize the required time range. Create a new aggregation: Select the production signal. Use a back
One of the customers I work closely with, always starts meetings with a Safety Moment. It’s a brief discussion about a safety topic to create awareness and encourage safe practices at work. This simple habit stuck with me, and it got me thinking about how safety isn’t just important at work—it matters just as much at home too.Following a similar theme from my previous post in this Community, after meeting with this customer and hearing him talk about doing work around the house and keeping a fire extinguisher 🔥 handy, I couldn’t help but reflect on my own habits. It reminded me of that time when I was doing some cabinetry work and cutting wood with an electric saw 🔌 ✂, and I realized I hadn’t taken the necessary precautions, like wearing safety glasses or checking that my fire extinguisher was where I thought it would be.If you’re in a leadership role, you might be encouraged to promote safety among your team. One very simple practice you can start implementing is having a Safety M
Applying Transformations to Your Tag Data in TrendHub In process data analysis, relationships between variables are often assumed to be linear. However, real-world process relationships can be more complex and often are. For example, the relationship between pressure drop and flowrate is only linear under laminar flow conditions. In turbulent flow, which is more common in industrial processes, the relationship follows a quadratic function, as described by the Darcy-Weisbach equation.Because of these complexities, it is crucial to apply transformations to your data to properly analyze and interpret process relationships. TrendMiner's formula tag builder provides a way to achieve this.Example: Analyzing Pressure Drop Across a Flow PumpIn this example, we analyze the pressure drop across a pump using two tags: Flowmeter Tag (Q) - “TM-HEX-FI0620” Pressure Drop Tag (ΔP) - “TM-HEX-PDI0620” When plotting these tags on a scatterplot, we observe that the relationship is not linear. Instead, i
TrendMiner’s security features, such as mandatory SSL setup and NTP server configuration, ensure secure sessions. However, if there’s a time mismatch between your local machine and the TrendMiner server, it can lead to unexpected logouts. If you're logged out immediately after logging in, it is typically related to an issue with the SSL configuration.Troubleshooting Steps: Are you logged out immediately after logging in? Check SSL: Ensure SSL is enabled and the certificate is valid. An incorrect SSL setup can cause immediate logouts. Does it take at least a few seconds before you're logged out? Verify NTP Server Configuration: TrendMiner relies on an NTP server to synchronize time. If it’s not configured, time discrepancies may occur. An NTP server can be configured in Edge manager. Check Local Machine Time: Make sure your local machine’s time matches the NTP server. You can verify this by comparing it to public time sites like time.is. if the issue persists, please contact your Tr
📌 BackgroundIn any industrial process, there are typically periods of optimal (good) and sub-optimal (bad) performance. Identifying and comparing these periods helps in understanding the differences and optimizing operations. By analyzing the variations between good and bad periods, process engineers can uncover key factors affecting efficiency and quality. ⚠️ ChallengeOne of the main challenges in process optimization is recognizing the factors that differentiate a good period from a bad one. Some common difficulties include: 🔎 Identifying relevant time periods or batches in continuous and batch processes. 📊 Establishing objective quality metrics to categorize periods. 🔄 Effectively comparing periods visually and numerically to extract actionable insights. 🛠 SolutionTrendMiner provides a structured approach to compare good and bad process periods through the following steps:✅ 1. Feature Search Use the value-based search function to find operating periods or batches. For b
The TrendMiner server needs 2 volumes: a root volume (/root) and a data volume (/mnt/data). TrendMiner data (saved work, tag indexes) are all stored on the data volume. When your usage increases your data volume can run full and will need extension. On a single node deployment you can simply increase the volume in the console.On a virtual appliance deployment console access is not available and you need to add a second disk in your hypervisor. For TrendMiner to recognize the additional disk you need to click the ‘extend disk’ button which you can find in Edge Manager diagnostics. Important note: once a disk is extended it is not possible to claim back the disk space! More details and info on this disk extension procedure can also be found in our documentation: https://documentation.trendminer.com/en/disk-space-extension.html
Already have an account? Login
No account yet? Create an account
Enter your E-mail address. We'll send you an e-mail with instructions to reset your password.