







Discover our learning resources and share your experiences...
Recently active
Have you ever noticed how we’re more likely to jump on board with something when we see others doing the same? That’s the Bandwagon Effect in action—a powerful psychological phenomenon where people adopt behaviors, trends, or tools simply because others are doing it. Like everything in life, this has both positive and negative effects, but either way, it’s a proven behavioral insight that we can harness to make your TrendMiner rollout a success. 🚀 What is the Bandwagon Effect?The Bandwagon Effect happens when people feel motivated to join a trend or adopt a behavior because they see their peers doing so. In a workplace setting, this means employees are more likely to engage with new software if they see colleagues embracing it, achieving success, or simply talking about it positively. 💡 Using the Bandwagon Effect for TrendMinerHere’s how you can use this effect to ensure a smooth rollout of TrendMiner:Highlight Success Stories: Share examples of teams or individuals who have already
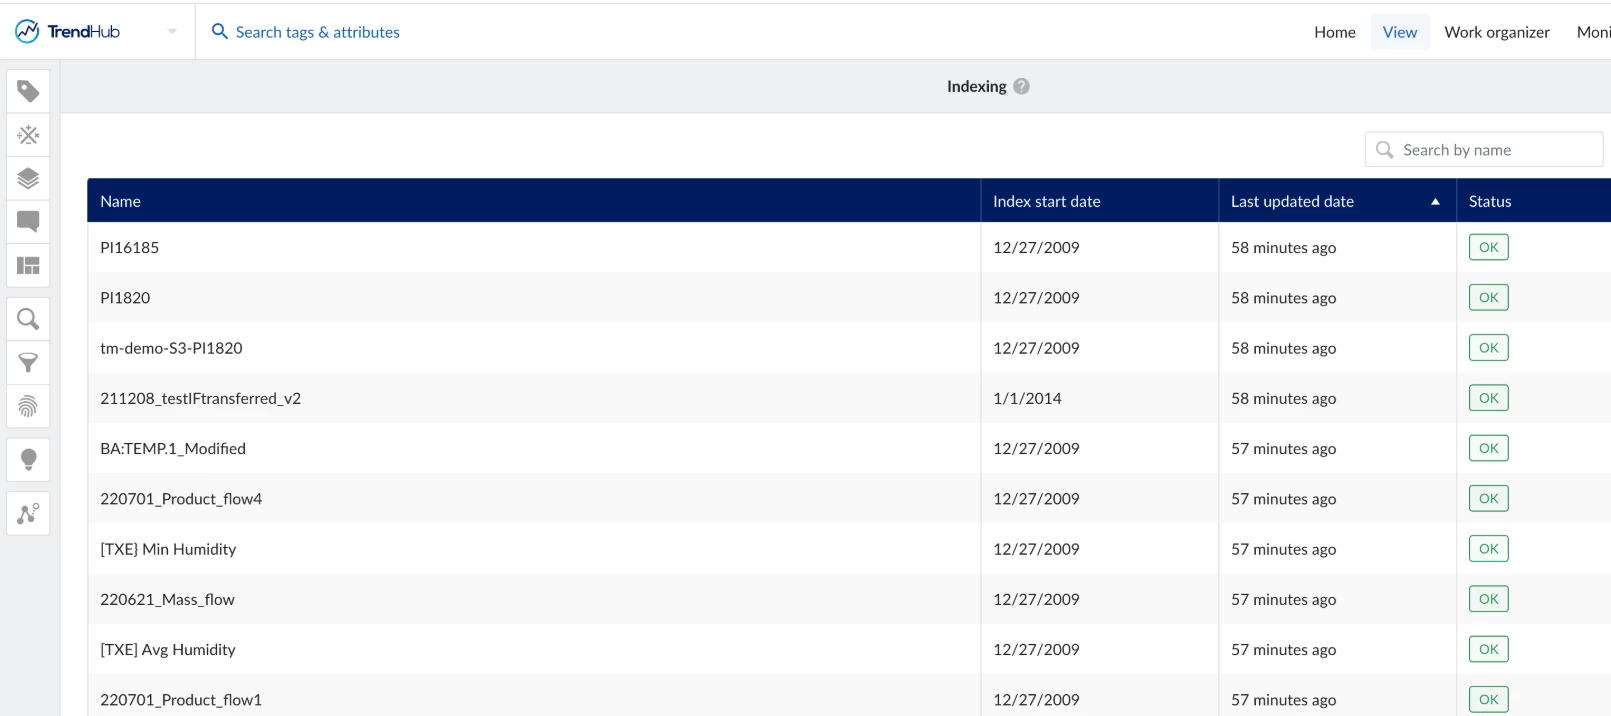
If you’ve added a new tag to an existing data source, but it’s not showing up in TrendMiner, it’s likely because the automated connector sync only happens every 24 hours.Why Tags May Not Appear ImmediatelyTrendMiner refreshes the data source tag cache every 24h from the moment the data source was added, the connector was last manually synced, or the tm-datasource service was restarted. This means that updates to the list of available tags and their metadata (name, description, units and tag type) can take up to a day to take hold organically.Need the tag right away?You can manually refresh the tag cache to make the new tag available immediately:Navigate to ConfigHub > Data Sources. Select the data source where the new tag was added. Click Refresh Tag Cache to pull in the latest tags.Alternatively, you can also sync the connector to ensure the data source is fully synchronized with TrendMiner.This way, your new tag will be available without waiting for the next scheduled sync.
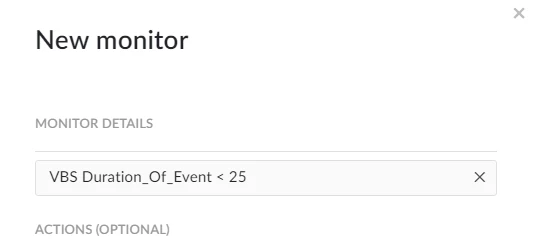
In the chemical industry, monitoring specific events that occur within a defined time frame - such as under X minutes - is crucial for ensuring safety, maintaining product quality, and optimizing processes. While such short-duration events might be fleeting, their impact can be significant, and timely detection is essential to prevent disruptions or inefficiencies. In this article, I will demonstrate how to monitor short-duration events in TrendMiner effectively, enabling proactive responses to these critical occurrences.Why monitor short-duration events?Short-duration events can provide key insights into process dynamics, equipment performance, and potential risks. By monitoring and addressing these brief occurrences, you can enhance operations and safeguard compliance. Here are some practical examples:Environmental compliance and safety: Detecting leaks or abnormal emissions that last less than X minutes is essential for mitigating environmental risks and ensuring safety protocols a
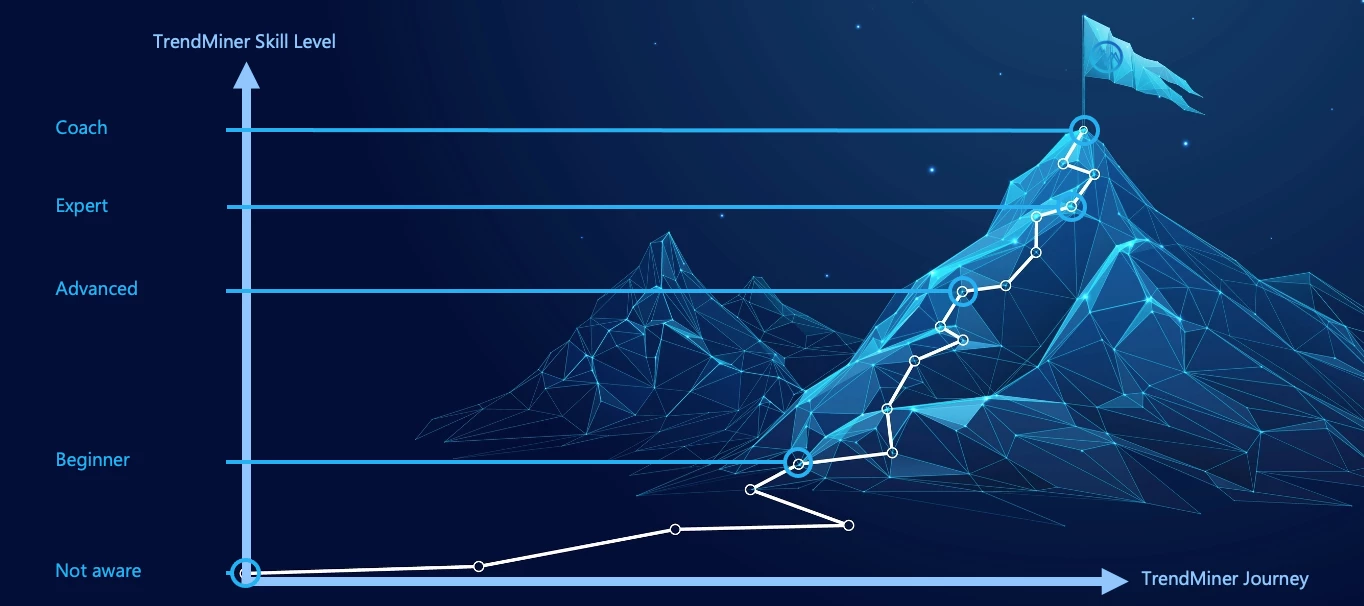
Increase TrendMiner usage and improve user skills by applying a skills matrix that provides key users with a structured path for skills development, providing a clear roadmap to progress from someone who is not aware to beginner, advanced, expert and finally to TrendMiner Coach level. Embark on the journey and reach the summit to become a TrendMiner coach! Follow these three steps to get started and benefit from the TrendMiner Skill Matrix yourself by improving your Skill Level: Take our TrendMiner Quiz and see how many points you have scored. Download the TrendMiner Skill Matrix, open the Excel sheet "Key User questionnaire", evaluate your skill level based on the points you have achieved in the quiz and the definitions of the Key Value Streams (General, Monitoring, Reporting, Dashboarding & Troubleshooting) given for each skill level (Not aware, Beginner, Advanced, Expert, Coach). Refer to the second sheet of the Excel file "Trainingsmaterial per Key Value" for relevant t
Hi everyone,Here is the recording of Clariant’s TrendLab presentation. In this session, David Judersleben (Assistant Plant Manager) @DavidJudersleben presents an use case on Clariant's energy management system, highlighting how it efficiently optimizes energy usage, reduces CO2 emissions, and lowers operational costs.About Clariant's Energy Management System:The Knapsack site of Clariant in Germany, a producer of flame retardants for construction and coatings, uses TrendMiner for continuous improvement in energy monitoring.Key Benefits of Using TrendMiner:Identifying energy waste, generating project ideas for improvement Substituting traditional lab analyses with real-time process monitoring Enhanced predictive maintenance Effective management of energy top-load Comprehensive project visualization Alarm raising and deviation tracking to preclude penalties due to excessive energy consumptionOne of the most significant achievements realized through this system is the optimization of hea
Hi everyone,Here is the recording of the recent TrendMiner 2024.R3.0 release webinar. This webinar includes new functionalities like;Scatter Plots to Event Analytics, Dashboard Configuration Improvements, Tag Dependencies in The Active Tags list, Plug 'n Play connectivity to Canary HistorianWatch the full recording to learn how these updates can benefit your operations and help you achieve your goals more effectively.You can find the slides here.Watch the webinar recording below:If you have any questions or feedback about the new release, feel free to share them in the comments below.
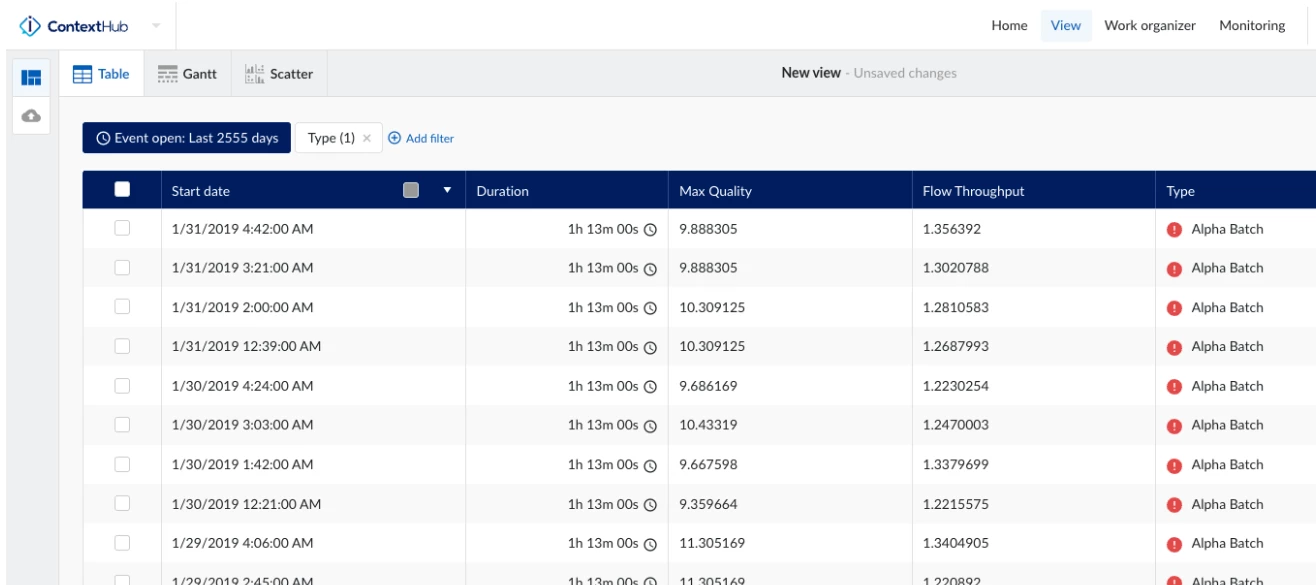
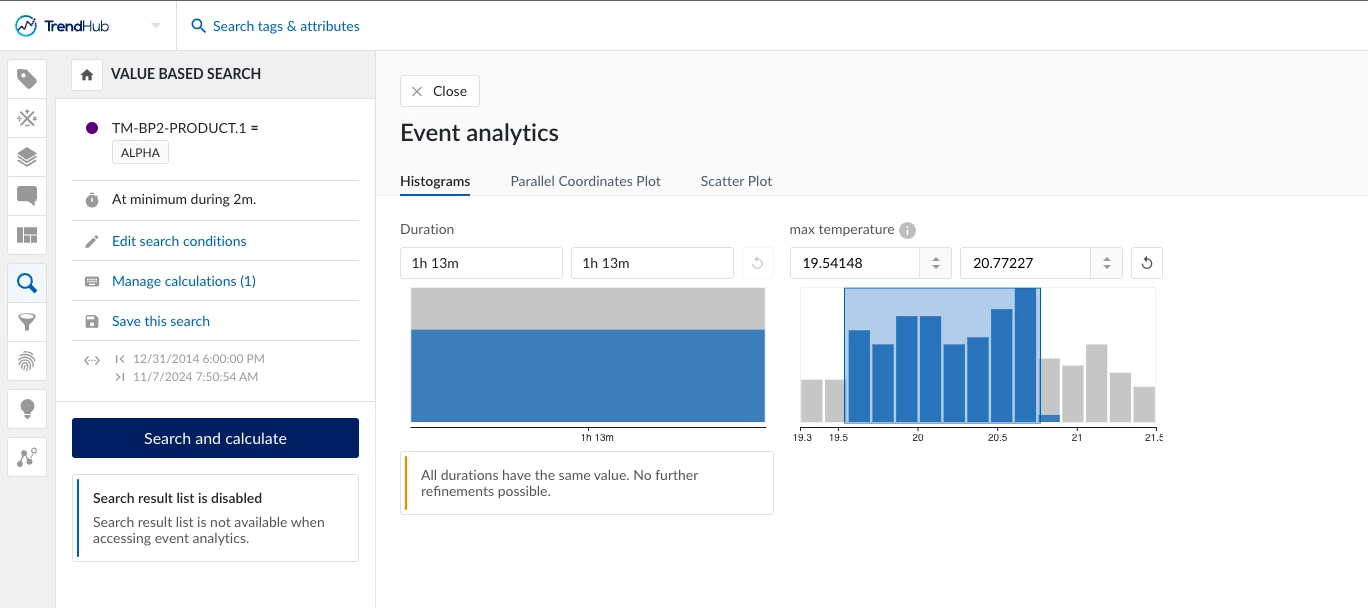
BackgroundIn batch processes, tracking key metrics like batch start and end times, cycle durations, and critical values such as maximum temperature can provide valuable insights. For instance, maintaining temperature within a certain threshold during a batch step can prevent quality issues and ensure process safety. This use case will guide you through how to document, track, and analyze batch cycle times, utilizing TrendMiner’s TrendHub and ContextHub features to streamline and automate this process.ChallengeTraditionally, batch cycle times have been recorded manually in Excel spreadsheets by board operators. This manual entry system often results in inconsistencies, especially when operators miss recording the start or end times of batches. TrendMiner provides a more reliable solution by automatically identifying and documenting batch steps and storing this information alongside tag data. By automating these records, TrendMiner reduces the reliance on Excel and increases accuracy.Sol
In process manufacturing, especially in chemical engineering, collaboration between Operational Technology (OT) and Information Technology (IT) teams is essential when implementing software like TrendMiner. For the software to work well, data from physical processes needs to be integrated with analytical tools. This requires good coordination between the OT and IT teams. Here are three key concepts that can help make your work with the IT team more effective.Data Integration and AccessibilityTo make software like TrendMiner work effectively, the data from physical processes needs to be easily accessible. The OT team collects real-time data from sensors and control systems, while the IT team ensures this data is available for analysis by providing the right infrastructure and secure connections.CybersecurityWhen OT systems (which often use older technology) are connected to IT systems, cybersecurity becomes crucial. IT teams focus on protecting systems from cyber threats, while OT needs
When creating a ticket for the TrendMiner support team it is useful to include detailed information about the issue. This will ensure that the issue can be investigated and fixed in shortest amount of time possible.Creating a detailed ticket will prevent a lot of back and forth communication and will increase the chance of a quick resolution.Steps on the creation of a detailed support ticket:Write a clear and concise title that describes the issue with a few words.Useful information to include in the ticket description:A detailed and clear explanation of the issue. Screenshots or videos provide additional clarity. Upload the appliance logs. This can be requested from your administrator if you do not have the required permissions: https://documentation.trendminer.com/en/how-to-extract-appliance-logs-.html If there are multiple TrendMiner installations within your organization. please specify which installation you are experiencing the issue on. Which version of TrendMiner are you using?
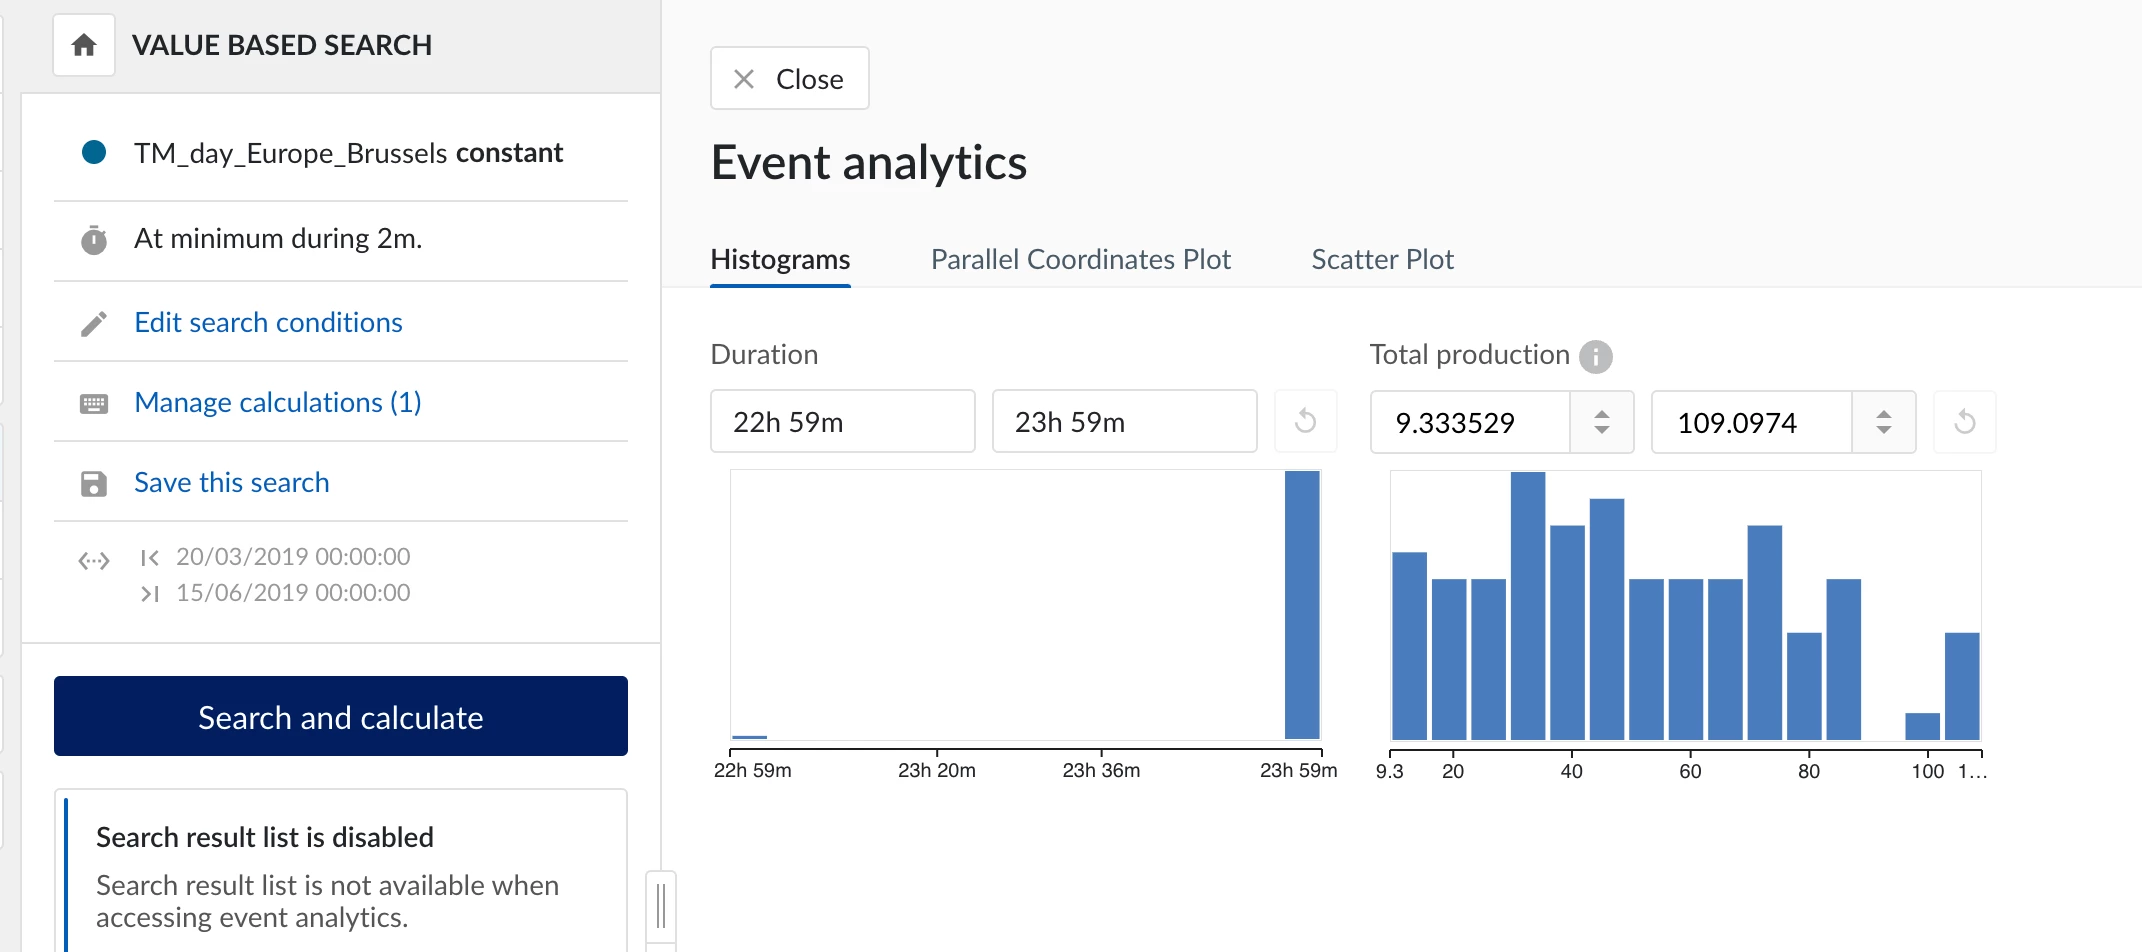
TrendMiner offers three main methods for calculating and tracking consumption or production over time, depending on your goals. You can use the Statistics Table, Calculations on Search Results, or set up a Consumption/Production Tag for continuous reporting. 1. Using the Statistics TableCalculating consumption or production for a given period is a simple one-step process, assuming there is already a tag representing the flow, rate, ... that is to be quantified. If this is not the case, such a tag can be created as a rate or through a formula. Once such a tag is in place you can navigate to the relevant period and open the statistics table. Here all the corresponding values can be read immediately. Often the total amount for the selected period is of interest, which can be read from the integral value, although the average value could also be interesting.Note: TrendMiner does not interpret the units of your tag. The integral value calculation always assumes your rate is expressed in 'pe
Hi everyone,We're excited to share a recording from the recent TrendLab Europe event (TrendMiner Community event), where Yusuf Hamurcu from ICIG provided an insightful presentation on how they leverage TrendMiner for troubleshooting, monitoring, reporting, and daily dashboard operations.Using TrendMiner brings ICIG the following value:Enhanced Process Insights: ICIG uses TrendMiner to gain real-time visual warnings, quickly identifying any out-of-spec products or batches. Improved Quality Control: Since adopting TrendMiner's soft sensor, ICIG has eliminated out-of-spec batches in their lengthy distillation process (5-15 days). Reduced Raw Material Consumption: In 2023, a valve leak was detected that resulted in a raw material loss of approximately $350,000, but it was detected and troubleshooted it so that it can be avoided now and in the future. Optimized Operations: TrendMiner's performance tags and daily dashboards support better decision-making on shutdowns, maintaining high standa
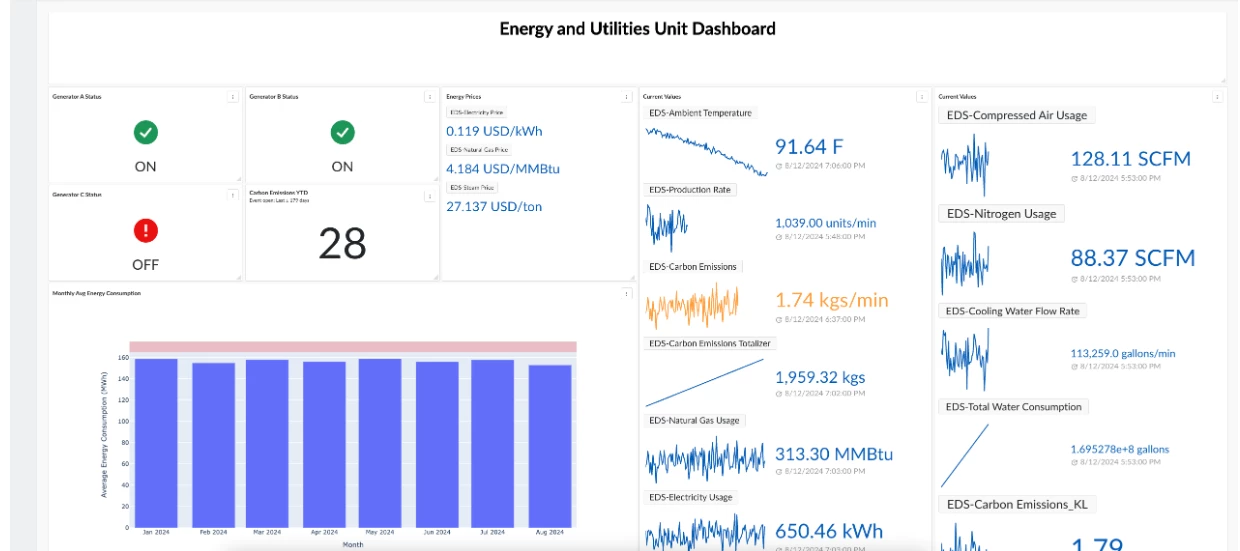
BackgroundThis use case shows how to create a custom visualization / chart that can be displayed on your DashHub dashboard as a tile. We can do this via MLHub. In this use case example, we will create a bar chart to track a key process metric at a facility, monthly average energy usage. Once we have added this visualization as a tile to the target dashboard, we can add other visualizations, as needed, following a similar procedure. These dashboards can then be shared with your peers. SolutionThe solution includes the following steps:Create a TrendHub view: Create a TrendHub view with all of the relevant tags. Adjust the time period on your focus chart. You will want to include all of the data that will be used to create your visualization. Save this TrendHub view. TrendHub view with focus chart duration spanning the entire year of 2024. Create a new MLHub notebook: Navigate to MLHub and create a new notebook. In
To ensure security, TrendMiner allows the installation and running of virus scanners next to the TrendMiner application, only on single node deployments and with certain conditions. While antivirus software is an important security measure, it is crucial to note that TrendMiner's performance is closely tied to I/O performance as the application builds a time series index using many small local files, grouped into time-based structures. Virus scanners, particularly those that scan all disk I/O, may still cause performance degradation or failures in some cases. Important Considerations:Performance Impact: Antivirus processes that scan disk I/O can introduce delays, potentially affecting TrendMiner’s responsiveness. In extreme cases, it may cause system failures, such as:User experience degradation due to slower I/O performance and CPU/Memory spikes caused by the antivirus software. Delays in monitoring events, due to slower indexing, related to slower I/O performance TrendMiner upgrade
Time to value is a key metric directly impacting the bottom line—profitability. The longer it takes, the more value is lost. TrendMiner can reduce the time to value down to a fraction when proper steps are implemented. Engineers struggle daily gathering data from various sources, stitching event information with process data, and using dated technologies built for megabyte-scale data. All this is done in addition to meeting the baseline operation and production at a minimum.Here are three simple steps your organization can implement for faster time to value.Clearly communicate the objectives and goals The organization's vision must be communicated from top to bottom. There is a reason the organization has selected TrendMiner! Objectives of the project must be aligned with the vision. Engineers involved in the day-to-day must be fully aware of the desired goals. The Sponsor, Project Manager, and the end-user must feel that they are integral to the set vision. Streamline the train
In industrial data analysis, preprocessing sensor data is crucial for accurate results, especially when dealing with sudden, abnormal spikes. These spikes can distort your analysis and lead to incorrect conclusions if not addressed properly. In this article, I will show you how to eliminate spikes from your sensor data using four different methods in TrendMiner, ensuring that your analysis is reliable and accurate.Examples of spikes in sensor dataSpikes in sensor data can occur due to various reasons such as sensor malfunctions, temporary communication errors, or unexpected events in the process. For instance, a sudden spike in temperature readings from a reactor might be caused by a faulty sensor rather than an actual temperature increase. Similarly, pressure spikes in a pipeline could be due to momentary errors in measurement. Removing these spikes from the dataset ensures that the analysis focuses on the real data and not on these anomalies. Methods for getting rid of spikesOption
Are you looking to discover where TrendMiner can bring additional value to your organization? By following these steps, you can follow a method that is used by TrendMiner customers to identify a scalable solution to implement across multiple assets, lines & factories. Step 1: Identify a strategic processThe identified process should be equipped with the required sensors to capture the data needed for analysis and monitoring. Choosing a high-value process ensures importance within the organization. A process that is similar across multiple lines or factories is preferred as that increases the scale at which the solution can be deployed. Step 2: Gather expert insightsThe process experts of the identified process have extensive knowledge on how the assets should operate to achieve optimal results. Gathering and organizing a conversation between the process experts yields the information we need for the next step. Step 3: Define Process limitsOnce the ideal operating zones for the proc
👉🏻 BackgroundIn a water purification system, efficient sludge transport is crucial tomaintaining optimal operations. The system employs five conveyor belts,which are dynamically activated based on the sludge load. At any giventime, a minimum of one and a maximum of four belts may be inoperation. However, the dynamic nature of this system introduceschallenges. If one of the belts malfunctions or operates inefficiently, it canlead to increased sludge accumulation, potentially disrupting the entirepurification process. To prevent this issue, a robust monitoring solution isessential to ensure that all belts function properly, regardless of the load.🕵 ChallengeMonitoring the operation of the conveyor belts is complicated by thevariability in the number of active belts. This dynamic operation makes itdifficult to determine when a belt is malfunctioning versus when it issimply under a different load condition. The challenge lies indistinguishing normal variations in performance from actual
Are you a project manager or sponsor and want to lead the way and make TrendMiner successful at your site? A successful project must have some clear goals to help you determine the right people and strategy to ensure its success. Rolling out TrendMiner at a new site or introducing it to a new group isn’t the exception.Here are 3 goals that can help drive a successful roll out.Reduce Process Variability and Cycle TimesConsistency is crucial for achieving high-quality production. One of the primary goals for any site is to reduce batch-to-batch variability and optimize cycle times. With TrendMiner, you can better identify key parameters that impact variability and make adjustments to your process (batch or continuous), leading to increased efficiency.Leverage Data from Multiple SourcesIntegrating data from various sources like LIMS, electronic batch record systems or logbooks and maintenance systems is crucial for achieving a comprehensive view of your operations. TrendMiner allows you t
Background So, you've found yourself wanting to historicize something you've observed in TrendHub. As the process engineer for the past two years, you've noticed a clear pattern between unit swings and recurring filter change on a feed pump. Now, you need to compile these findings into a list and annotate them on the trends. That is the only way you can convince everyone else that this is indeed the root cause of the swings and not just some random incident. Although you've briefly heard of ContextHub, once you reach this screen, you find yourself wondering, "What is a component, and what do you mean by Type???" Component and Type are two parameters that must be assigned to create a context item, or a block of information linked to a data point or a period of data associated with an event identified in your datasets. The Component links your observation to a particular tag, while the Type assigns a category that can later be used as a filter in ContextHub. Types There are several pre
Curious about selecting the right key users for your TrendMiner project? Empower the ideal candidates to drive impactful change and ensure seamless adoption. 🚀 Identify the right key users Each new tool requires specific key user profiles outlining which people are most likely to quickly adopt the new way of working. Select the right people who fit the pre-defined profile, so they can enable and support other users to more quickly adopt - and get value from - the new way of working. The key users play a central role We will work with the key users intensively during the hands-on sessions to get them to know the basics of the software and create first value. Furthermore, we will stay in close contact with these users to expand their TrendMiner knowledge and skills, and to measure the progress of the project. To maximize the chances of successful onboarding, key users should adhere to and be selected based on the following profile. The ideal key user… … commits to accompany the pilo
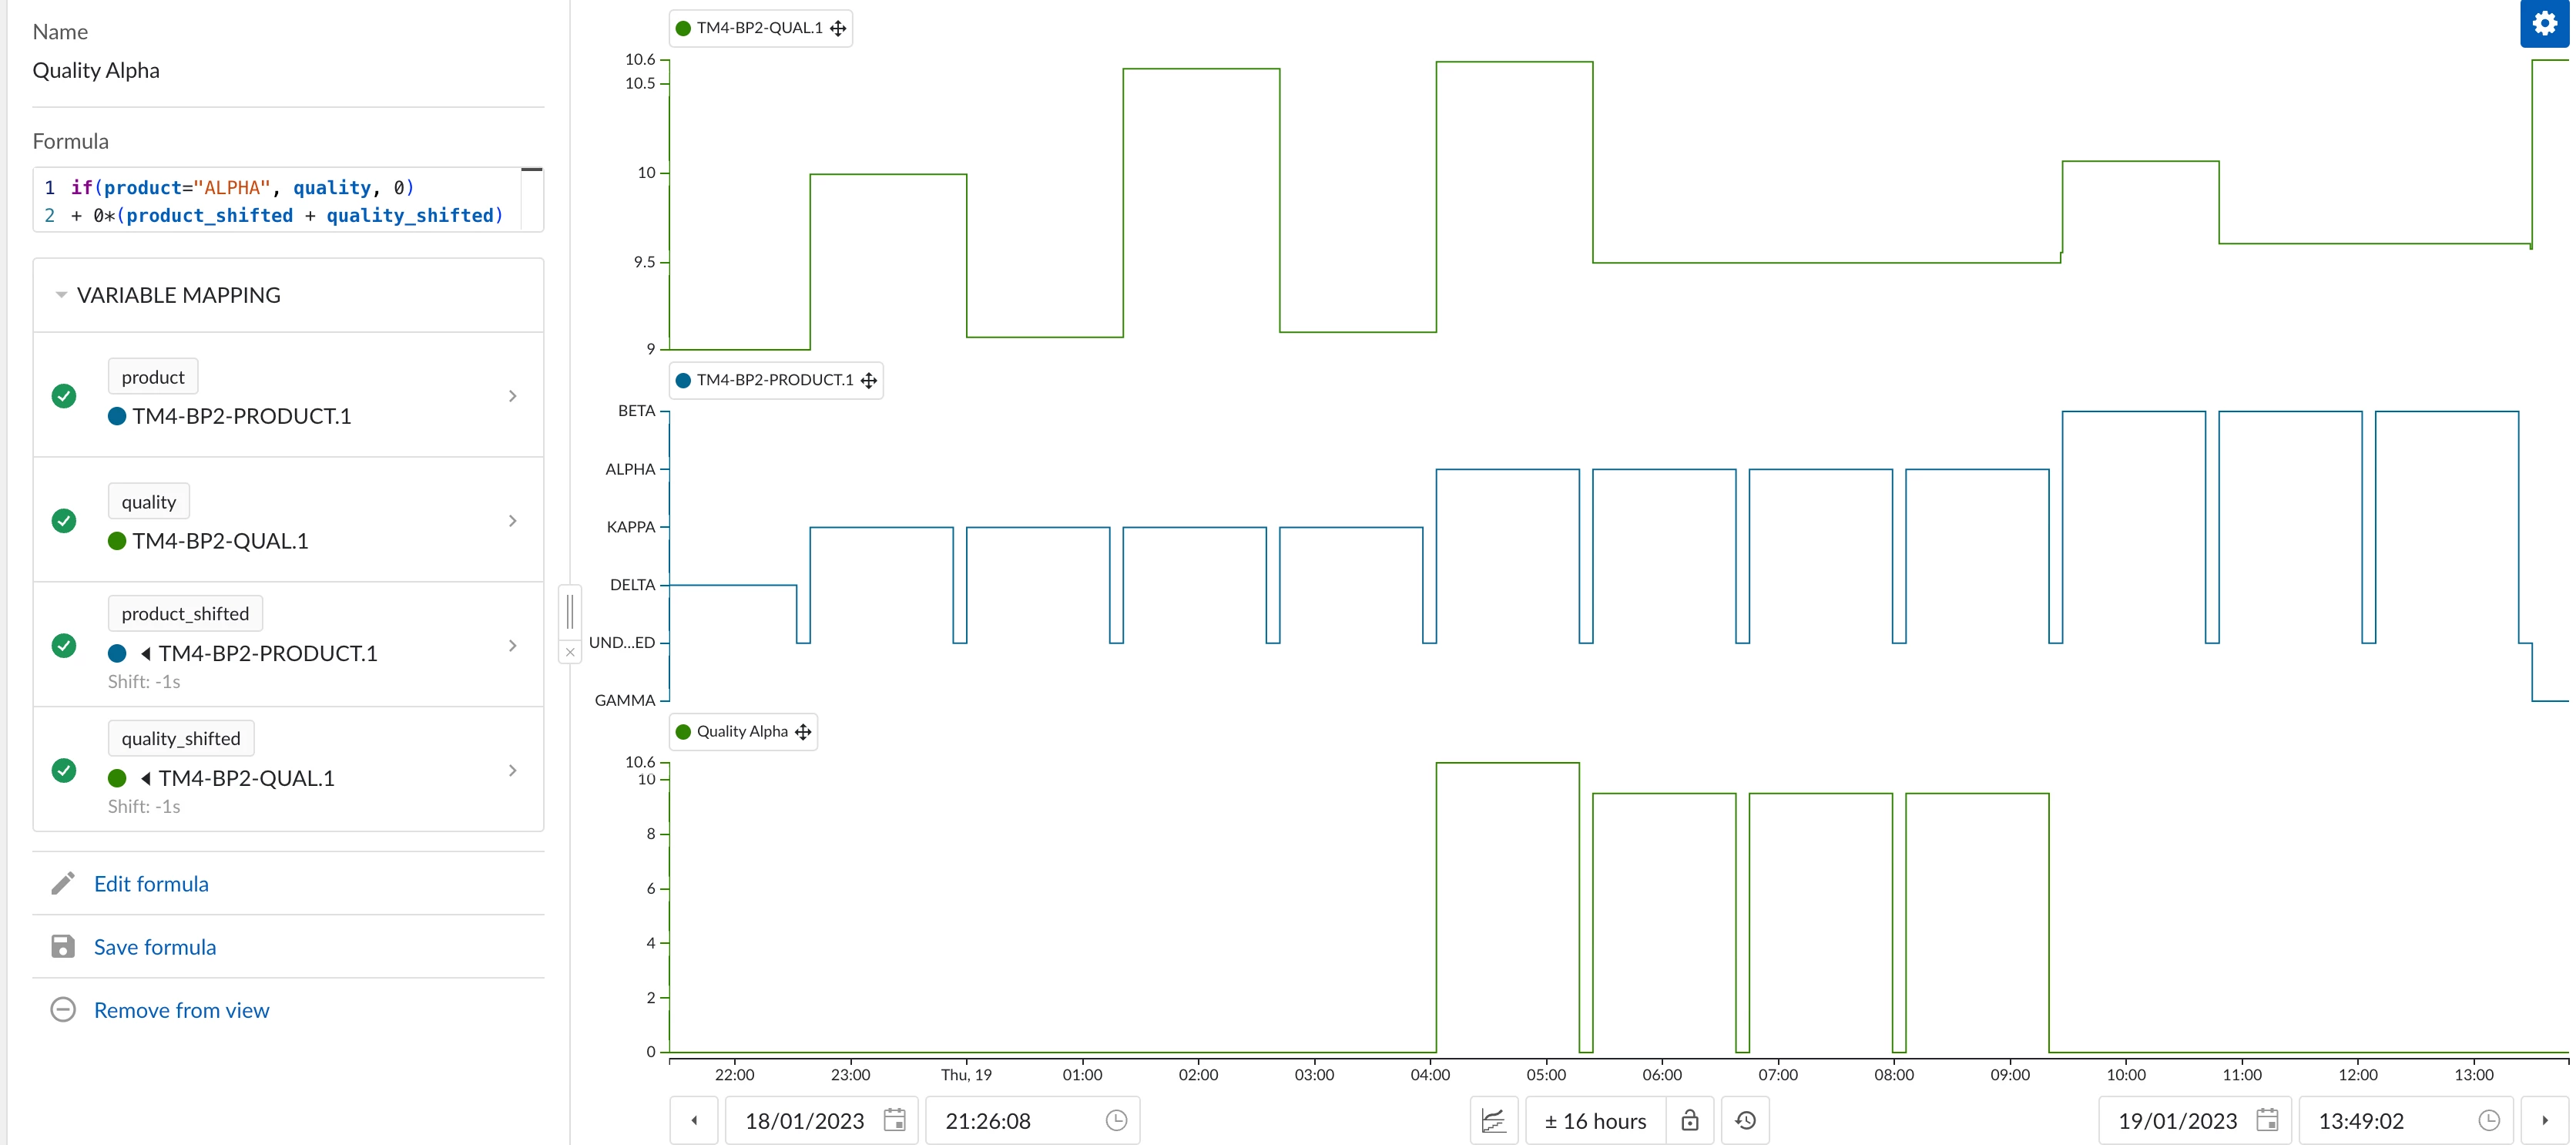
In industrial data analysis, it is often necessary to formulate complex conditions to achieve precise search results. However, it is not possible by default to combine AND and OR conditions within a value-based search in TrendMiner. TrendMiner allows you to combine multiple conditions in a value-based search, but you can only combine all conditions with either AND or all with OR—not both simultaneously. Here, I will show you how to effectively combine AND and OR conditions in a value-based search.Examples of combining AND and OR conditionsA typical example would be searching for production data where multiple products (e.g., ALPHA and BETA) are analyzed under specific temperature conditions. Other examples include identifying production phases where certain machines are either in "Standby" or "Maintenance" mode, but only if energy consumption is below a defined threshold. Another example could be analyzing phases where specific chemicals are either in a "Mixing" or "Reaction" state, b
Background Monitoring thresholds is a common use case in the chemical industry, essential for maintaining consistent production quality and ensuring operational safety. Thresholds act as predefined limits, signaling potential issues in the process when exceeded. Failure to effectively monitor these thresholds can lead to production inefficiencies, equipment damage, and reduced product quality. Such deviations can be caused by factors like temperature fluctuations, pressure variations, or torque instability, as well as unexpected changes in raw material quality. TrendMiner provides an effective solution by enabling reliable and continuous monitoring of these thresholds. ChallengeThe challenge in monitoring thresholds lies in precisely defining and continuously tracking them. TrendMiner offers a solution by enabling users to set up monitoring through value-based searches, which can trigger automatic alerts. Additionally, the creation of context items can be activated to allow for detai
If you ever downloaded TrendMiner from our file server you might have noticed there are a lot of files on there. The .tar.gz files are the actual TrendMiner installation/upgrade packages. The .zip file is the connector installation/upgrade package. But do you know what these .md5 and .sha1 files are? md5 and sha1 are 2 different cryptographic hash functions. A cryptographic hash function is a mathematical algorithm that takes an input of any size and produces a fixed-size, unique output (hash) that appears random. It is designed to be secure, meaning even a small change in the input drastically changes the output, and it is computationally infeasible to reverse or find two different inputs with the same hash.TrendMiner provides the hashes of the installation packages for you as a customer to verify that the file you downloaded is identical to the one which is hosted on our server and the file was not corrupted during download.How do you do that?Download and open the .md5 from our file
Sometimes, for better visualization and monitoring, it is helpful to represent the durations of certain important events in the plant within a variable. This is possible in TrendMiner by following a couple of steps.First, it is necessary to create a slope tag, from 0 to 1, that connects the start and end points of the event.This can be done with a conditional formula and time changes. For example, an event from the moment a batch starts until the “Phase 3” starts: It is important that the obtained variable consists of constant slopes from 0 to 1 and from 1 to 0. We do not want it to remain constant at values of 0 or 1 for long periods, as this could affect the second step of the workaround. This is why time shifts are used, indicating only the exact moment of start and end.Secondly, we need to transform the slope tag into another variable that indicates the duration of each slope. This is done with the formula 'if((a-b)>0,1/(a-b)/60,,0)' following the explanation provided below (to
Communication and collaboration in the form of a user community has anchored itself as a powerful technique that enhances the overall experience for everyone, from users to admins to developers. User communities foster collaboration, serve as inspiration, propel innovation, harvest a support system, and enablement of users. How well the users engage in the community can amplify the success of an organization. Here are at least four reasons to bring users to the TrendMiner community.Share knowledge and expertise. Every user brings a unique insight that can help the organization achieve its OKRs (objectives and key results). In a shared community space, everyone can tap into this resource and reap the benefits. It is not uncommon that users in different plants or business units and even in other organizations are facing similar challenges. By sharing these challenges, a solution can be reached faster and inspire new ideas. Sense of belonging and support. Plant life can be busy and probl
Already have an account? Login
No account yet? Create an account
Enter your E-mail address. We'll send you an e-mail with instructions to reset your password.