
























Discover our learning resources and share your experiences...
Recently active
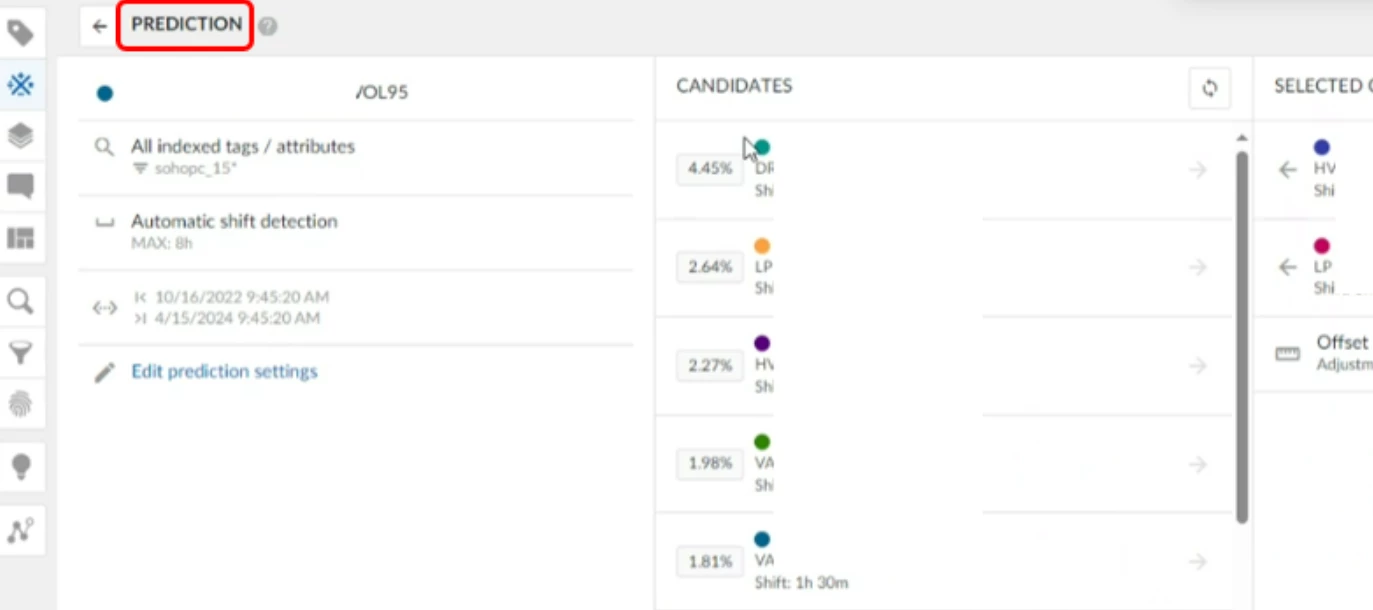
BackgroundIn one of the distillation units, one of the product temperatures is being lower than expected for around 1 year, leading to lower product recovery, as the separation is not as efficient as it should. This means a 10% recovery loss in the company, which is an important economical loss. ChallengeTroubleshoot the causes for this deterioration in performance, by detecting the influencing variables and the respective influence of each. Solution-Load all the related tags, as well as the key temperature-Run the correlations engine to find correlations against the potentially correlated variables and against all the variables of the asset-Layer 2 periods (high and low recovery) and compare statistics and trends of the potentially influencing parameters Results and value-Two process variables were identified as the main influencing factors. -It was identified that both variables weren't acting at the same time, but separately. That's why by themselves, the correlation is not to high,
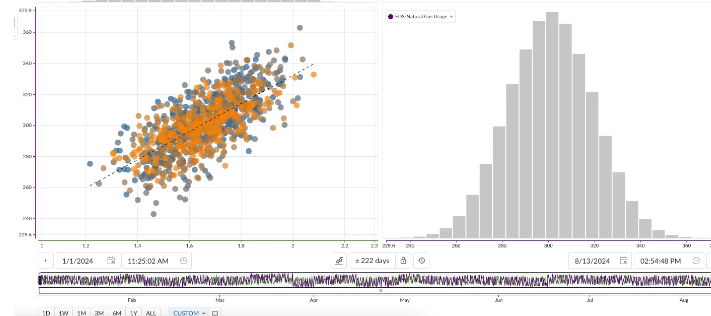
BackgroundAs a process engineer, understanding the relationship between two variables is crucial and often necessary. For example, how does tower pressure impact overhead rates? How does temperature affect conversion? Operations are constantly making adjustments, and process engineers need to grasp the impact of various levers or handles on final product specifications, operating envelopes, and process safety. TrendMiner enables users to quickly analyze relationships between tags or variables, both visually and quantitatively.Scatterplot of natural gas usage vs carbon emissions.Steps to Analyze Relationships in TrendMiner:Step 1: Add the tags you are interested in analyzing to the active tag list for bivariate relationships.Step 2: Switch to the Scatterplot view.Change view from “Trend” to “Scatter”.Step 3: Adjust the time period to include relevant data for your analysis.Step 4: Evaluate the relationship. Use the scatterplot to qualitatively assess the relationship between the variabl
A broad implementation of TrendMiner exponentially increases the value your organization can get from our product. If more people are using TrendMiner, more people can collaborate, learn from each other and in the end, it will be easier to maintain knowledge inside the organization. Therefore, it is crucial to ensure that new employees know about all the relevant tools used. There are several ways to make TrendMiner a part of your onboarding curriculum. Here are some tips: Make a checklist of all the onboarding steps, including the different important tools which are being used. Explain clearly why TrendMiner is important for your organization. Make sure new employees have immediate access to TrendMiner. Interactive Workshops: Organize sessions where new hires can practice using TrendMiner with real examples from your plant. Provide access to our training videos, documentation, and best practices guides that they can refer to as needed: https://userguide.trendminer.com/?lang=
Here's how TrendMiner can be utilized at each stage:Define: Use TrendMiner to define the problem or opportunity by analyzing historical process data to identify trends, patterns, and areas for improvement => Getting started with TrendMiner Collaborate with stakeholders to establish clear project goals and objectives. Measure: Utilize TrendMiner to collect and visualize real-time and historical process data from various sources (Time series, Context and Asset data). Measure key performance indicators (KPIs) and baseline process performance to establish a benchmark for improvement. Analyze: Apply advanced analytics and visualization tools within TrendMiner to analyze process data and identify root causes of inefficiencies or deviations. Use TrendMiner's self-service analytics capabilities to empower subject matter experts and process engineers to explore data and generate insights independently => Enable them to become data engineers with TrendMiner, even if they're not data e
Our recent release webinar recording is now available. You can watch it to see detailed explanations and demos of the latest TrendMiner functionalities. We encourage you to visit this community post and vote for your favorite functionality or share your feedback in the comments.
If you notice that a certain tag in TrendMiner is displaying data that might be incorrect, you can use the PlantIntegrations API to check which tag data is being retrieved from the historian.If the data in the historian corresponds with the data in TrendMiner, the faulty data is already present in the historian and should be rectified there.To access the PlantIntegrations API you can do the following:Open the IIS server on which PlantIntegrations is installed. Open the IIS manager and click on the PlantIntegrations website. On the right side of the screen you can now choose the ‘browse’ option which will lead you to the API. This will lead you to the following API page: To perform an index call here you need the following information:Tag name Historian name Tag type Interpolation type Start- and enddate of the period you want to request Number of intervalsYou can find an example of an index call below in which the parts in green need to be configured depending on the call you want to
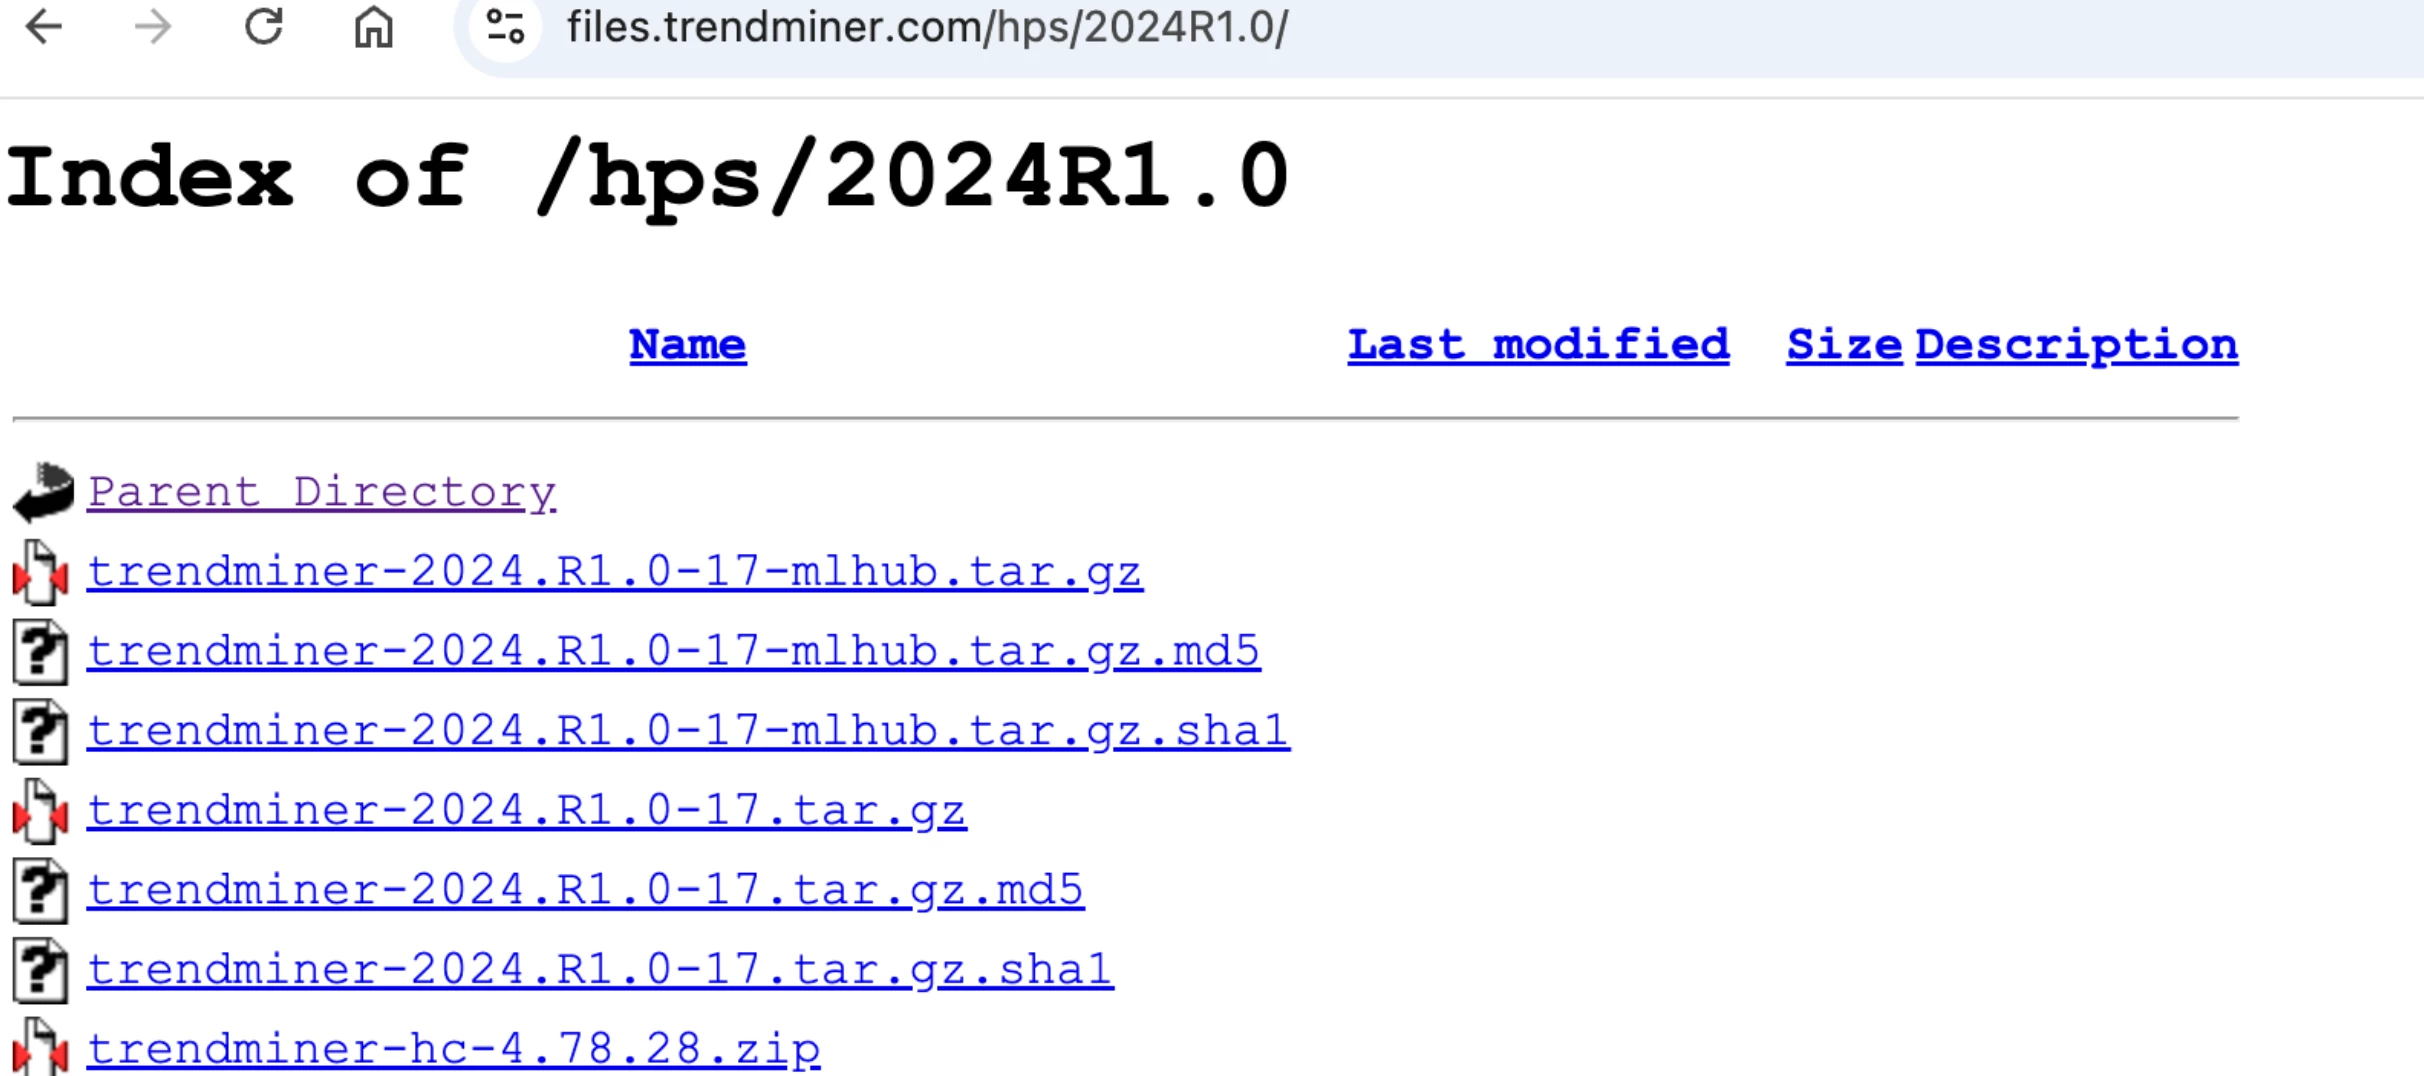
In our 2024.R1.0 release we introduced an additional layer of security, meaning an OTP code is mandatory to use the Admin account. (for ConfigHub and TrendHub login)You can read more about this in the article from Jef Vanlaer here.While trying to authenticate with the Admin account, I ran into following error message: Invalid authenticator codeI found out that the root cause of this error is due to my TrendMiner server time not being in sync, thus the server thinks that the code I am providing is long expired/not valid yet. After resolving the NTP issue my Admin login is working without issue again.
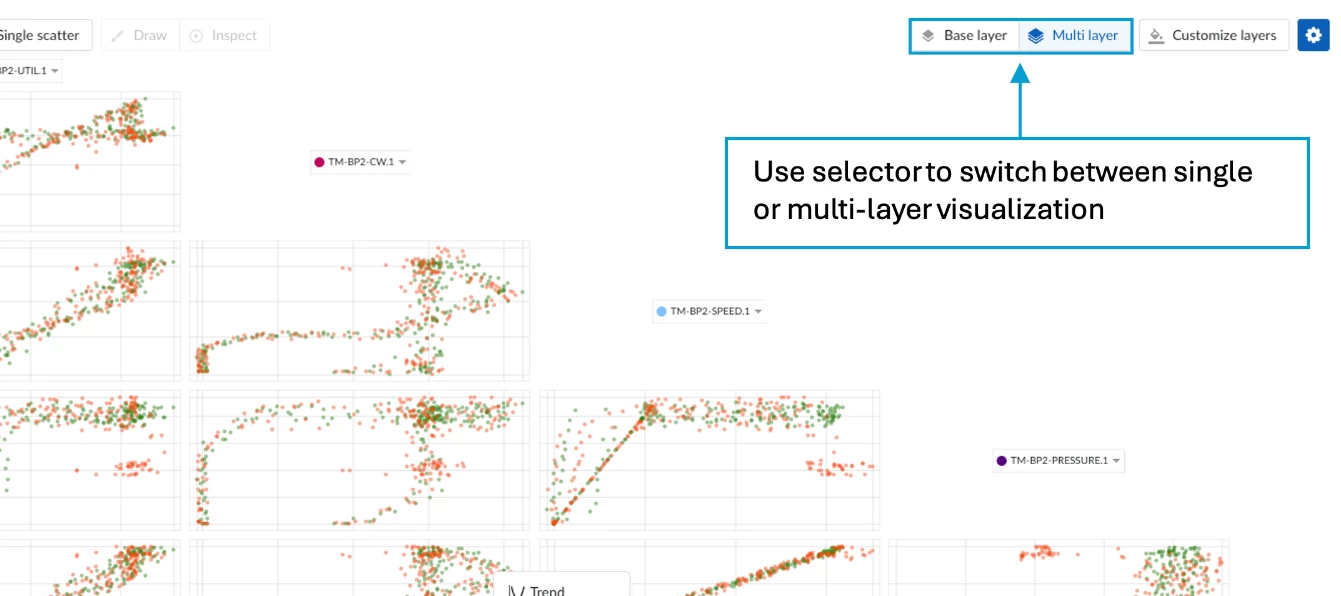
In our latest release, 2024R2, we’ve enhanced the Scatterplot display in TrendHub to visualize all layers of a TrendHub view, not just the base layer. This new feature enables you to compare relationships between different tags across multiple layers, making it a powerful tool for troubleshooting, root cause analysis, performance grading, and more. In this article, we'll walk you through how to use this new feature to its full potential.Step 1: Adding Different LayersThere are several ways to add layers in TrendMiner. In our example, we used value-based searches to identify high- and low-quality batches and added the three highest quality and three lowest quality batches as layers.Overview of all the layersStep 2: Switching to Scatterplot ViewBy changing the plot visualization to a scatterplot, you’ll immediately see the option to create a multi-layer scatterplot.Scatterplot visualization with multi-layer enabledStep 3: Customizing Your LayersClicking the “Customize Layers” button open
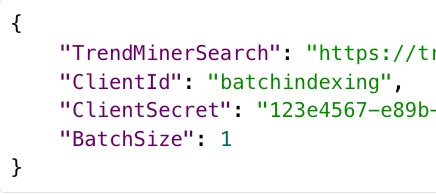
As you might already know TrendMiner provides some support scripts to make some tasks easier. Today we have 5 official support scripts: batch indexing: indexes the tags in a given list indexing performance testing: benchmarks the indexing performance provided by a historian at specific index resolutions listing tags in a historian: lists all tags available to TrendMiner for a specific historian listing indexed tags: lists all tags currently indexed in TrendMiner cleaning indexes: clears the index of those tags that match the provided criteria All details can be found in this documentation article: https://documentation.trendminer.com/en/support-scripts.html But next to these scripts you can also leverage the TrendMiner APIs to write your own script in your favourite language. For example: clean all indexes of a list of tags provided via a .csv file.Did you write your own scripts already? Which scripts would you like to see productised in TrendMiner? Let us know!
When was the last time you had a TrendMiner HealthCheck?You wouldn't drive your car for years without an oil change? Or skip your annual physical? Just like your vehicle and your body, you need a TrendMiner HealthCheck to ensure peak performance for your data analytics. What's a TrendMiner HealthCheck?Think of a HealthCheck as a tune-up for your TrendMiner implementation. It's a dedicated session with your Customer Success Manager and Data Analytics Engineer to review new features, optimize your current setup, and ensure you're squeezing every drop of value from our platform.How Can a TrendMiner HealthCheck Supercharge Your Analytics?Discover hidden gems: We're constantly rolling out new functionalities. Your CSM will showcase the latest and greatest, tailored to your specific needs. Optimize your workflow: Are you taking the scenic route when there's a shortcut available? We'll help streamline your processes for maximum efficiency. Align with best practices: Learn how industry leaders
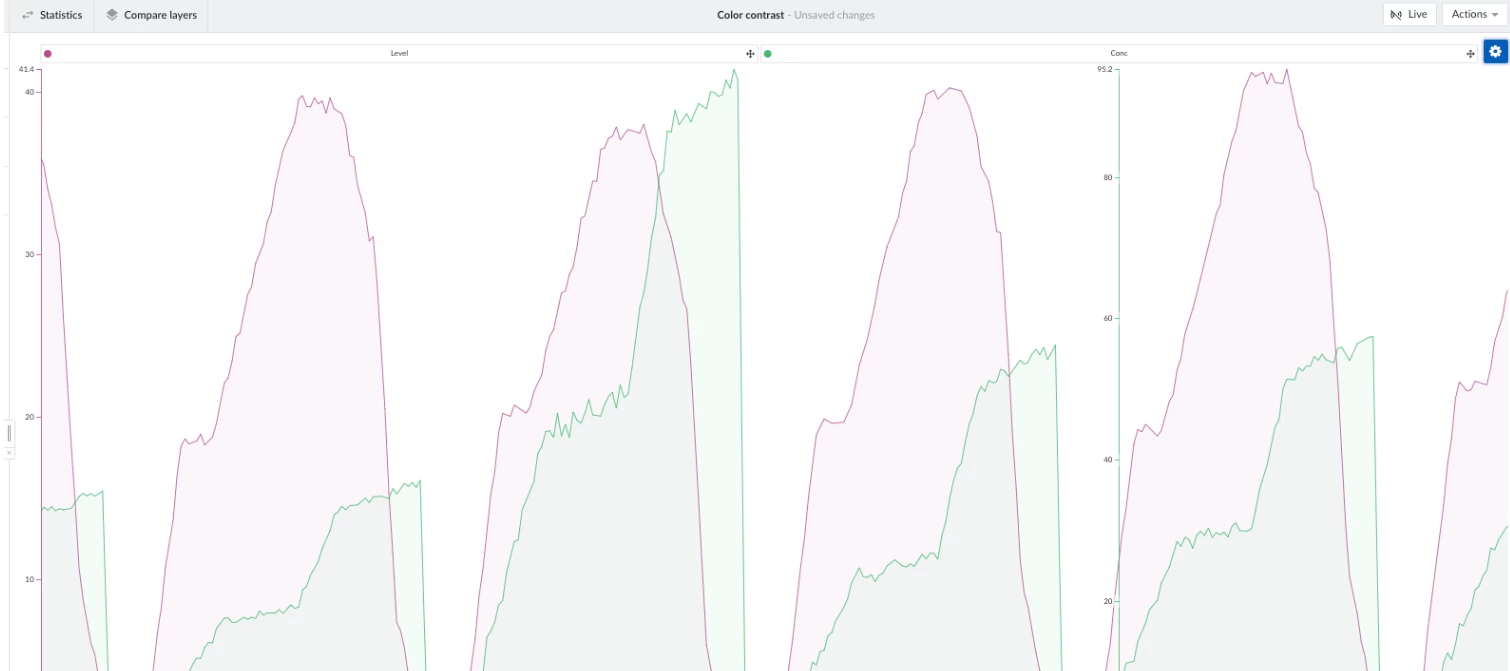
Creating clear and effective graphs is a vital skill for anyone involved in data presentation. In process engineering, the ability to visually convey complex information can significantly enhance the impact of your work. However, not all graphs are created equal. Poorly designed graphs can mislead, confuse, and obscure the very data they aim to highlight. This functional tip outlines essential best practices for making enhanced TrendHub views that are both informative and visually engaging. By following these guidelines, you can ensure your graphs not only accurately represent your data but also resonate with your audience, facilitating better understanding and decision-making. Keep It Simple: Avoid clutter by minimizing gridlines unless they are necessary. Try to avoid displaying excessive context items unless they are needed to emphasize a reoccurring issue. Consider whether all data actually needs to be displayed in the focus chart, or if keeping longer-range data i
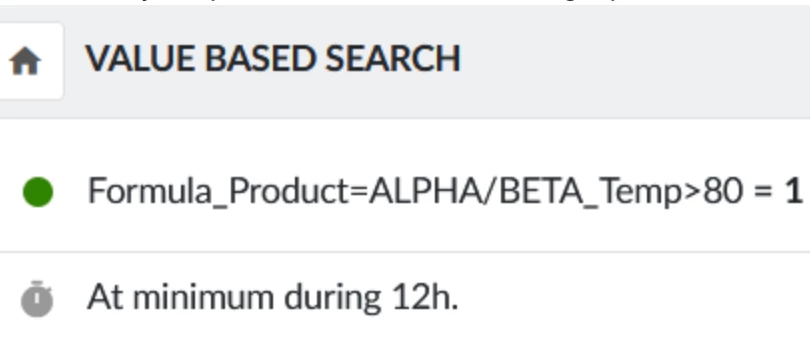
In industrial data analysis, precisely examining short events is crucial for optimizing processes and preventing disturbances. Short events, which are shorter than the index resolution, present a unique challenge as they can easily be overlooked. Here, I will show you how short events can still be analyzed in TrendMiner using a value-based search.Examples of short eventsExamples of short events include sudden pressure spikes in pipeline systems, which may indicate valve malfunctions or blockages, temporary temperature fluctuations in reactors, which can point to unexpected chemical reactions, and brief electrical spikes in systems, which may signal short circuits or overloads. Analyzing these events accurately allows for taking preventive measures and improving process stability and system safety. Background on indexing in TrendMinerTrendMiner uses indexing to enable fast, interactive visualization and analysis of time-series data. When a tag is accessed for the first time, it undergo
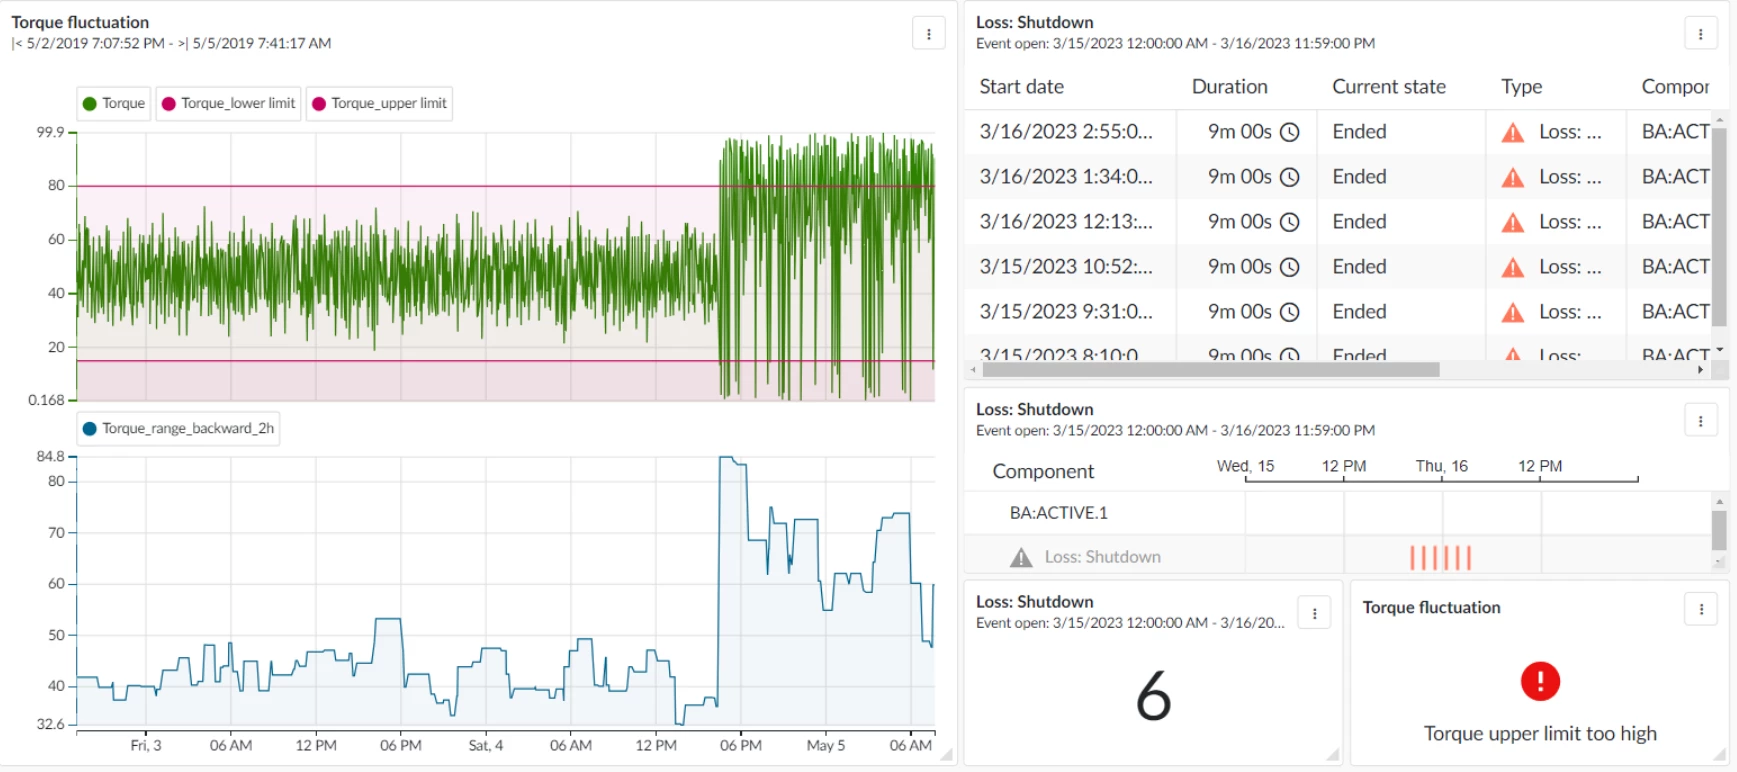
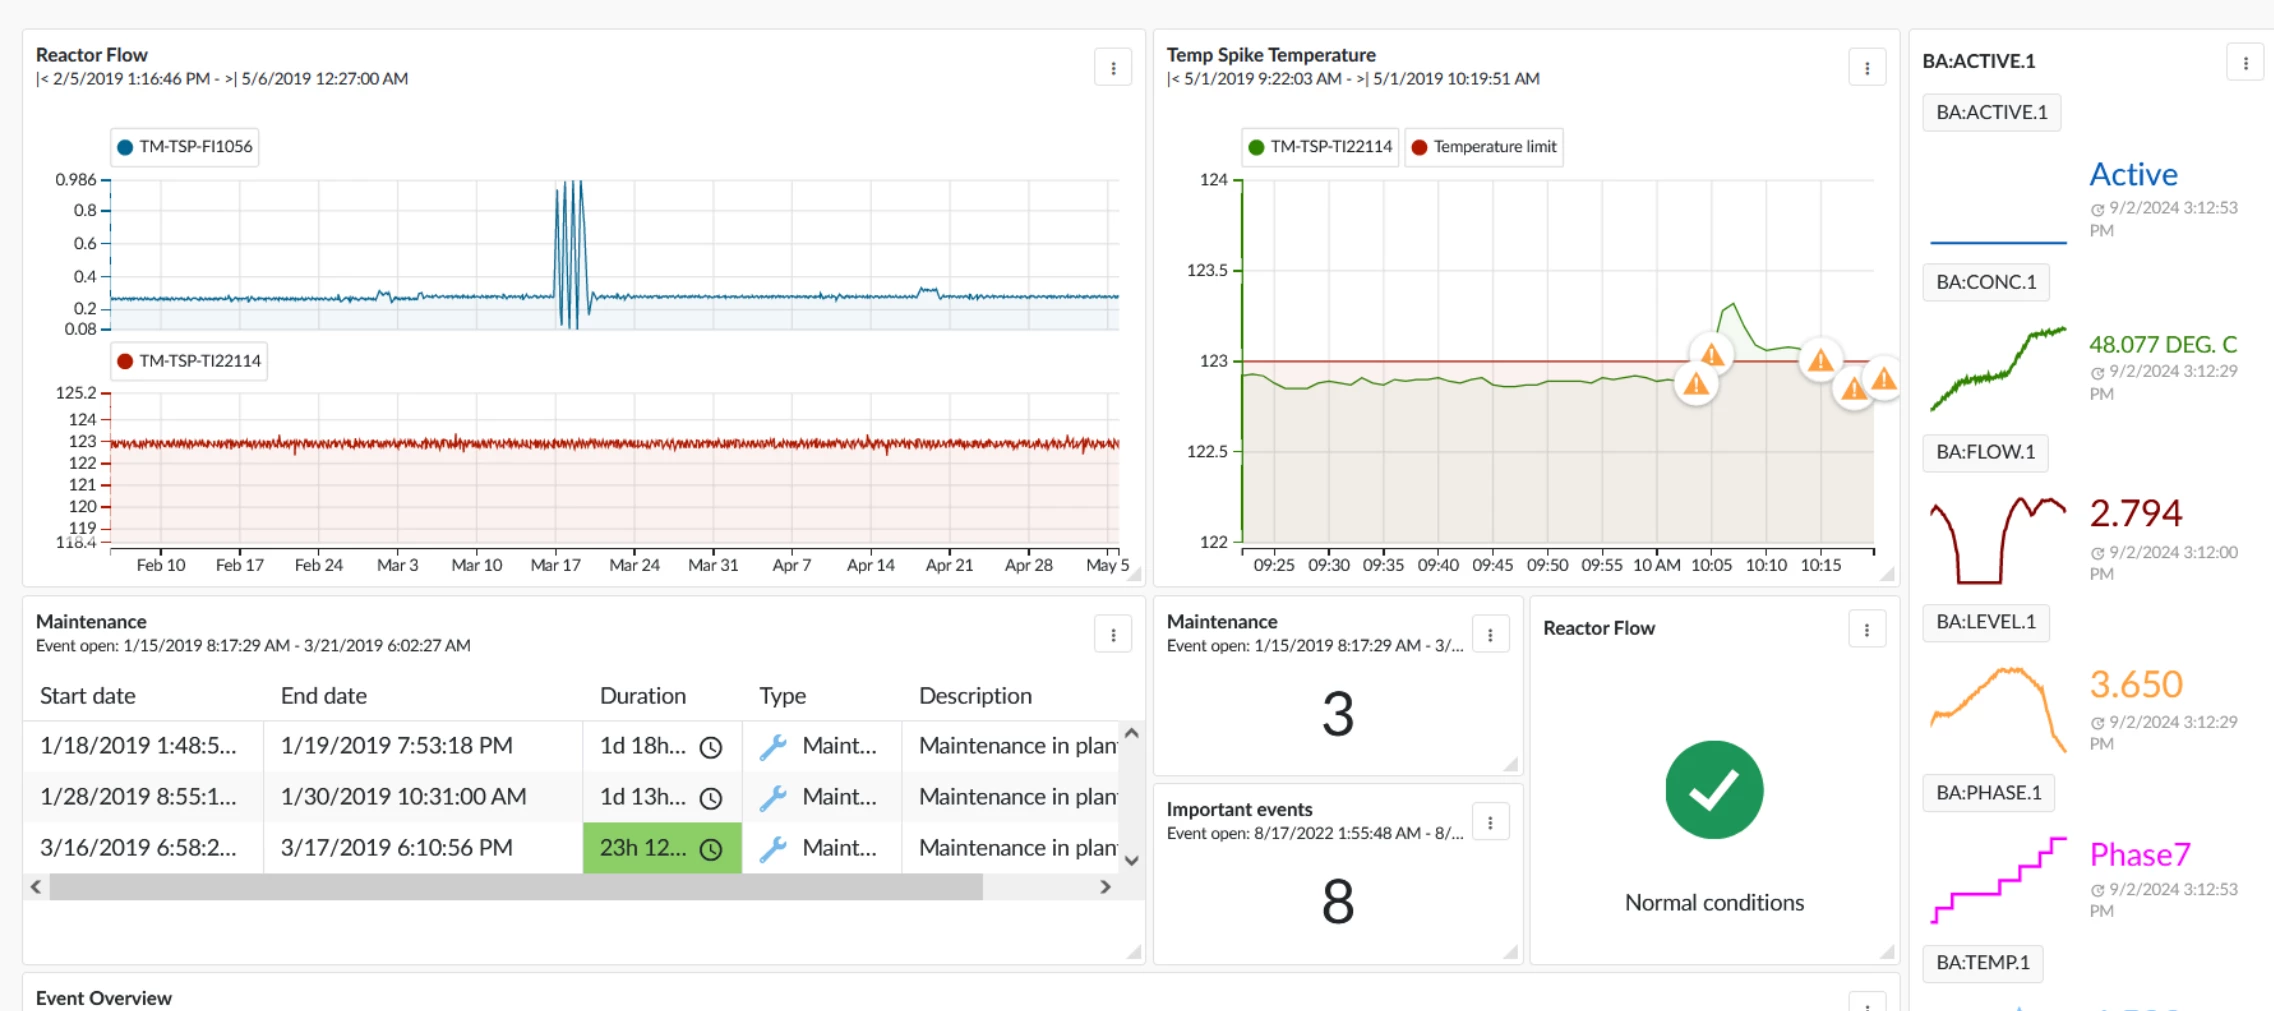
Background Fluctuating process parameters in the chemical industry present a significant challenge as they can impact the efficiency and quality of production. These variations can be caused by inaccurate measurements, unstable raw material quality, or insufficient process controls.For instance, Torque fluctuations in machinery may lead to mechanical damage, compromising operational safety. Temperature fluctuations in reactors can affect reaction kinetics, resulting in inconsistent product quality. Likewise, pressure fluctuations in pipelines or reaction vessels can affect product consistency and equipment safety. ChallengeManaging fluctuating process parameters may require setting and monitoring thresholds, tracking the range of variations, and creating context items. TrendMiner simplifies this by allowing users to define and oversee limits, measure fluctuations, and visualize all relevant data on a dashboard. SolutionDefining upper and lower limitsIn this step, upper and lower torq
BackgroundManufacturing plants often rely on both railcars and trucks to ship their products to distributors, retailers, or directly to customers. The choice between these transportation methods depends on various factors such as the nature of the goods, cost, distance, and delivery time requirements. Railcars are typically used for bulk shipments of heavy and large quantities of goods, such as raw materials, chemicals, and pellets, due to their capacity to transport large volumes efficiently over long distances. Conversely, trucks offer greater flexibility and are ideal for shorter distances and time-sensitive deliveries, providing door-to-door service and easier access to various destinations. This combination of transportation methods allows manufacturing plants to optimize their logistics and ensure timely and cost-effective distribution of their products. ChallengeKeeping an accurate count of how many vessels have been filled can be a challenging task for manufacturing plants, par
Gather Data Sources & Learn the Data Flow: Think beyond your data historian and understand the ecosystem. When initiating a pilot with TrendMiner, most discussions center around connecting to a data historian, where the process/manufacturing sensor data resides. However, to maximize the pilot's success, it may be beneficial to integrate other sources such as Laboratory Information Management Systems (LIMS) and Manufacturing Execution Systems (MES). Your Customer Success Manager can provide insights into which use-cases would benefit from such additional data integration. Even if you are not within the IT organization, having a basic understanding of how data flows through various components of TrendMiner is crucial for effectively communicating with stakeholders across different departments. TrendMiner’s Data Architect can clarify how the platform acquires and processes data. Get Buy-In from End Users: Consider who will be the end user for TrendMiner. Those working in Operations,
Often, we want to analyze or report on key KPIs, such as consumption, production, average temperatures, or maximum values of critical variables. However, these data need to be analyzed separately based on the recipe they correspond to.In TrendMiner, it is possible to unify all workflows so that reports for multiple recipes can be obtained with a single process. This is due to the ability to include the “constant” condition in the Value Based Search and to add string variable calculations. Here’s how it is done:Prepare the View: Load the tag indicating the recipe name and the rest of the necessary tags to create the report. Perform the Search: Go to the search menu and start a value-based search. The condition will be: Recipe name tag CONSTANT. The results obtained will correspond to the time period indicated in the context chart. Add Calculations to the Search Results: String Variables Calculation: Start value of the recipe name. This calculation will indicate which recipe each of t
BackgroundThe material management department needs the daily consumption of caustic to order the correct amount from suppliers and avoid shortages or excess.This is calculated from the reactor's weight sensor after each of the approximately 20 daily discharges.Before TrendMiner, we manually recorded these weights, a tedious process prone to errors, missing data, and a lack of consumption analysis. ChallengesUnderstand the normal daily raw material consumption to request the needed amount from providers and optimize inventory space. SolutionCreate a formula to create the derivative of the reactor weight only when it's negative (discharge). Value based search to search every day in the last 6 months Add calculations with the day name and the integral of the formula (daily consumption) Export report Results and value-A report of the last 6 months was created in 10 minutes, the same amount of time that it takes to manually get the report of 1 day. From now on, only 1 click is needed
🚀 Our CS team is dedicated to ensuring seamless roll-outs and maximizing the adoption of TrendMiner within your organization. To assist you, we've compiled a set of best practices. How do you approach the adoption process? What strategies do you use to activate new users or re-engage existing ones? Share your insights in the comments below! ⬇️
TrendMiner does not support changing the (interpolation) type of a tag in the data source. This implies that for example when you change a tag from linear to stepped interpolation in your historian the tag will not load anymore in TrendHub and an error will be shown. You will also notice that the tag index can no longer be updated and goes to a STALE state.TrendMiner support can typically derive this from the logfiles, but if you already know this is the root cause of the problem then there are a few steps you can perform to resolve the issue.Refresh the tag cache manually in ConfigHub for the data source the tag is synced from (or wait up to 24h for the changes to be synced automatically) Restart the tm-compute service in ConfigHub or Edge Manager. Keep in mind that restarting tm-compute will entail downtime for the users (typically a few minutes). Re-index the tag. Edit and save all calculated tags and searches which depend on the changed tag (it is not required to make any chang
Background:TrendMiner's "Event Analytics" is typically used for batch processes, but it can also optimize continuous processes. By breaking down the data into manageable hourly intervals, this approach provides detailed monitoring and identifies optimal conditions for enhanced efficiency and productivity.Steps: Preparation: Add the most important process parameters. Include the pre-installed TM_day_ tag. Data Splitting: Use the value-based search feature to segment data. Set the condition to TM_day_ constant. Ensure a minimum duration of 59 minutes. Adding Calculations: Add calculations on the search result. Example calculations: Average Temperature, Integral Cooling Water, Minimum Pressure. Event Analytics: Use the 1-hour aggregated data within Event Analytics. Analyze the data using histograms or parallel coordinate plots to visualize and identify optimal process conditions. Picture 1: This parallel coordinate plot from TrendMiner’s Event Analytics shows the relationship b
This use case demonstrates how TrendMiner's functionalities can be leveraged to perform retrospective analyses, leading to enhanced productivity and efficiency in our power plant operations. BackgroundIn our power plant, managing fuel consumption efficiently is crucial for operational cost savings and environmental impact reduction. This use case focuses on a retrospective analysis aimed at reducing fuel consumption by adjusting PID (Proportional-Integral-Derivative) parameters within our system.ChallengeThe primary challenge was to reduce fuel consumption without compromising the performance and stability of the power plant. The desired outcome was to identify the impact of PID parameter adjustments on fuel consumption by comparing data from specific periods before and after the changes were implemented.SolutionTo address this challenge, the following steps were taken: Parameter Adjustment: The PID parameters were adjusted in our power plant system to optimize fuel consumption. Data
On June 20th, we hosted an admin webinar to prepare our admins for the upcoming 2024.R2.0 TrendMiner release. With this release, we are moving to a new Operating System (OS) given the end-of-support for Red Hat Enterprise Linux 7 (RHEL 7) and the derived CentOS 7.Two actions will be needed to upgrade your TrendMiner setup to version 2024.R2.0 once it is publicly released:The creation of a new TrendMiner server based on the new OS A migration of the application data to the new serverThis webinar details the prerequisites and steps to be taken to complete these actions.Additionally, it explains the migration options, including the new and highly recommended full system backup/restore functionality with secure storage on your own AWS S3 or Azure Blob Storage, which includes index migration. A detailed demo of this process is provided.Finally some important considerations and recommendations for planning the migration are outlined.Check out the recording below and refer to the "OS Migratio
In Edge Manager → Diagnostics the available disk space and the total disk space of TrendMiner can be checked. The disk space shown there shows the space on the /mnt/data volume (the volume on which the TrendMiner appliance is installed and on which TrendMiner stores its data).Next to the /mnt/data volume there is also the root volume, on which the OS and system services are running. Both the root volume and the /mnt/data volume can run out of disk space which in both cases will result in service interruption.The root volume total disk space and usage is not shown in Edge Manager since TrendMiner does not actively use this volume. Disk space issues should not occur on this volume if the system requirements are met.The /mnt/data volume is used by the TrendMiner application for storing data. This data mainly consists of: Info stored in the database, e.g. saved work from users. Index data Logically, the more usage of TrendMiner and the more tags are being indexed, the more disk space wil
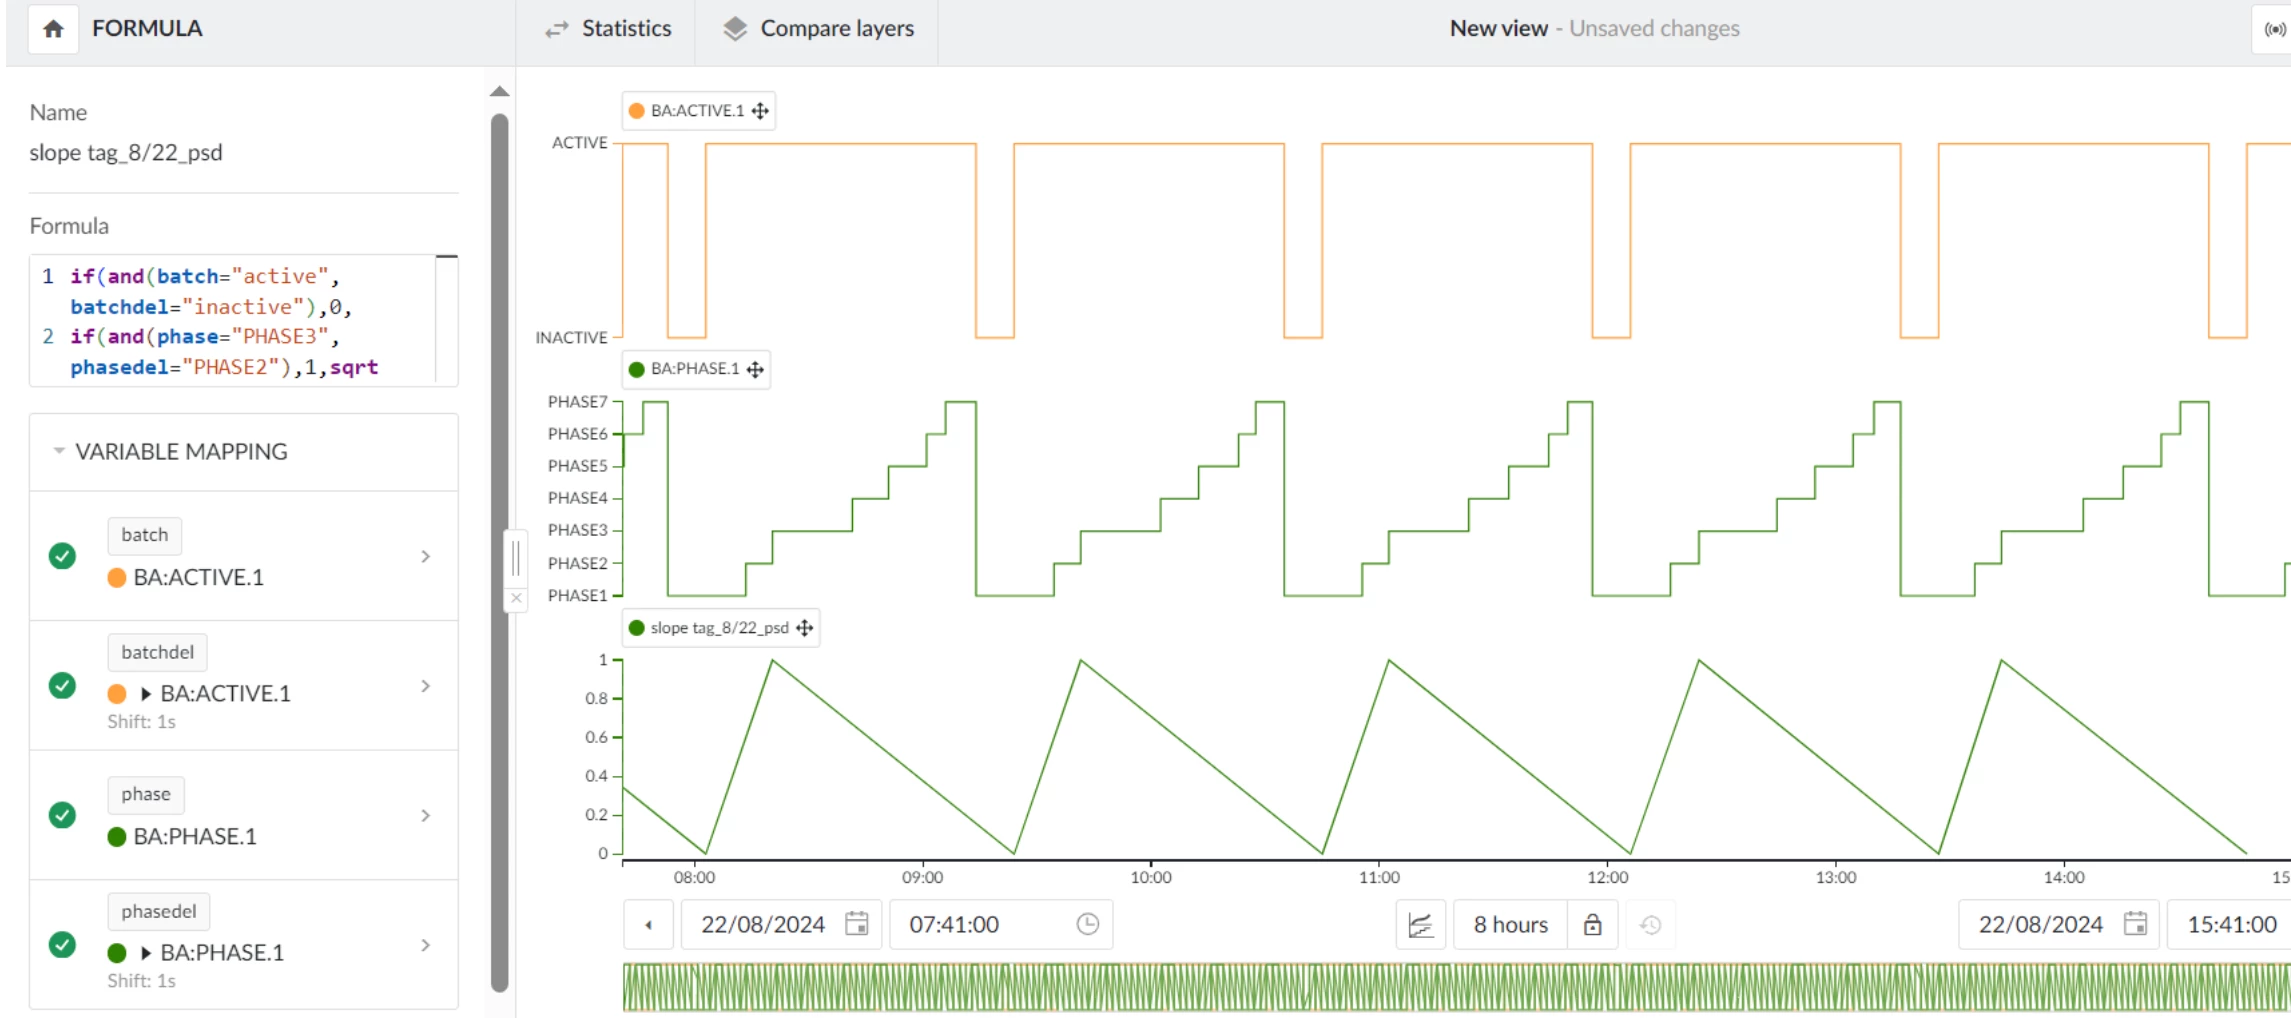
BackgroundOften times, we find ourselves wanting to know when a certain tag changes state. For example, if we have a batch process, I’d like to know when I transition from one phase to another in the process. Or for a multi-product line, I would like to know when we switch from manufacturing product A to product B. Not only would we like to know when these state changes occur, but also it would be useful to analyze the data per state or segment. Consider the batch process example again - it would be nice to know the duration of each phase. Or even, what is the maximum temperature at each phase of the batch process?In TrendMiner, we can quickly answer these questions by conducting a constant Value Based Search (VBS). When selecting constant in a VBS, we ask TrendMiner to identify every change of state or level. I say level too because constant VBS can apply to analog tags in addition to string and discrete tags. Below I will detail the steps to create a constant VBS. Step 1 - Create the
BackgroundThis use case is centered on finding the median value of a collection of tags. In TrendMiner, it is simple to calculate the mean or average value of a set of tags. This can be done in our formula tag builder. In some cases, however, the median value proves to be more useful of a central statistic than the mean. For example, consider a furnace where there are multiple thermocouples measuring the same point temperature. If one of these thermocouples were to malfunction and read a very high or very low value, the mean value will be skewed high or low, respectively. When outliers exist in the data, the median value proves to be a useful central statistic. ChallengeThere is no built-in function in formula tag builder for calculating the median value of a collection of tags. A simple, manual formula can be created to find the median for a collection of two or three tags; however, the manual formula grows exponentially when additional tags are added. Writing a formula to calculate t
Already have an account? Login
No account yet? Create an account
Enter your E-mail address. We'll send you an e-mail with instructions to reset your password.