















Tips and tricks for using the functionalities to get the best results
Recently active
In TrendMiner, time tags play a crucial role in process analysis. They allow users to define and segment data based on specific hours, days, weeks, months, quarters, and years, enabling precise time-based calculations. Many key performance indicators (KPIs) rely on time-based reporting, such as: Daily production totals Hourly average flowrates Monthly energy usage Quarterly business metrics Example of HOUR time tags in TrendMiner.TrendMiner time tags for the US Central time zone.Why Time Tags Matter in TrendMinerTime tags can be especially useful when defining formula tags that incorporate a time-based component. For example, you might need to calculate averages over specific time intervals or align production metrics with financial reporting periods. Like any other tag, time tags can also be utilized in value-based searches and monitors.Handling Less Common Time ZonesTrendMiner includes predefined time tags for commonly used time zones, making it easy to apply time-based ana
I just saw a question pop up in the community asking whether TrendMiner has built-in steam equations. While they are not built-in, here’s a way to start using steam equations in TrendMiner...A while back, I implemented the numeric steam table equations found on https://iapws.org/relguide/IF97-Rev.html into TrendMiner Formula Tags. I am posting those here in the hopes it can help some other users too.The attached zip file contains txt files for formulas that can be copy-pasted into a Tag Builder formula for steam table calculations.Formula units are currently in Celsius and bar, so you might need to adjust accordingly. Text search and replace should work to change the input units, for example 'P' -> '(P*1000)' to use tags that are in mbar. To change the output unit you can simply multiply the formula by a constant value.
This tutorial will guide you through pulling ContextHub data into Power BI using Power Query. We'll cover the following steps:Setting up parameters to make the queries dynamic. Writing queries for API interaction. Explaining how to configure the entire setup step by step.In this example, we will use a context type filter and a time filter. However, other filters are also available and can be applied similarly. Step 1: Define ParametersTo make the queries dynamic, define the necessary parameters in Power Query Editor. Make sure to change the name to the given name, otherwise the script won’t work.How to Add ParametersOpen Power Query Editor. Go to the Manage Parameters section in the toolbar. Click New Parameter to define a parameter.Required Parameters:ServerURL Name: ServerURL Description: The base URL of your TrendMiner server. Type: Text Current Value: Enter your TrendMiner server URL (e.g., https://myserver.trendminer.com). Item Type List Name: itemTypeList Description: List o
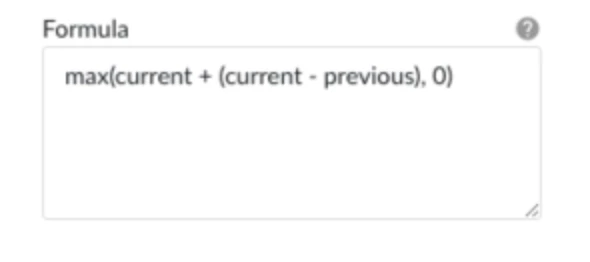
Linearly extrapolating the current trend of a tag to estimate what its value is going to be at some point in the future is the probably the simplest form of predictive analytics, but it can be very effective in some cases.We can implement such a tag by taking the current value of the tag and adding the increase over the last x time. For example, if a tag currently has a value of 10, and the value 5 minutes ago was 8, then we would extrapolate that the value in 5 minutes will be 10 + (10-8) = 12. An obvious requirement is that the tag behaves somewhat linearly within the scope of our use case. Linear extrapolation will always be a simplification of your process. Of course, should you have a more custom formula can predict future values better you should implement that formula instead.After creating the predictive tag we will typically want to monitor on those future values to receive early warnings. Some use cases I have seen solved this way include:Monitor whether a tank will be empty
IntroductionDaily production is a key performance indicator (KPI) in continuous processes, helping process experts track efficiency and performance. However, in many cases, daily production is not readily available as a default variable in data historians. A recent question in the TrendMiner Community addressed this challenge: How to calculate a daily average of a signal with a single result per day?. This article explains four different approaches to calculating daily production in TrendMiner, depending on the user’s needs. 1️⃣ Continuous Rolling Last 24 Hours Production 📌 BackgroundThis method ensures that at any given time, the production of the last 24 hours is always available as a continuously updating value. This is particularly useful for real-time monitoring and trend analysis.🛠 Steps Load the relevant tag related to production. Set the context and focus chart to visualize the required time range. Create a new aggregation: Select the production signal. Use a back
Applying Transformations to Your Tag Data in TrendHub In process data analysis, relationships between variables are often assumed to be linear. However, real-world process relationships can be more complex and often are. For example, the relationship between pressure drop and flowrate is only linear under laminar flow conditions. In turbulent flow, which is more common in industrial processes, the relationship follows a quadratic function, as described by the Darcy-Weisbach equation.Because of these complexities, it is crucial to apply transformations to your data to properly analyze and interpret process relationships. TrendMiner's formula tag builder provides a way to achieve this.Example: Analyzing Pressure Drop Across a Flow PumpIn this example, we analyze the pressure drop across a pump using two tags: Flowmeter Tag (Q) - “TM-HEX-FI0620” Pressure Drop Tag (ΔP) - “TM-HEX-PDI0620” When plotting these tags on a scatterplot, we observe that the relationship is not linear. Instead, i
Using TrendMiner’s Cross-Correlations Tool for Root Cause Analysis One of the most powerful features within TrendMiner is the cross-correlations tool. It is especially useful when conducting root cause analysis because it helps identify correlated tags that could serve as early indicators for your tag of interest. Identifying the Root Cause of a Process Disturbance Let’s look at an example of how to identify the root cause of a process disturbance.A process engineer monitoring a reactor unit notices an abnormal temperature spike in the reactor. The unit supervisor asks the engineer to determine what may have caused this increase. However, without immediate input from board operators and field operators, it can be difficult to know where to start. Reactor temperature fluctuations can result from many different factors, making troubleshooting a complex task.This is where TrendMiner can help.By using the cross-correlations tool, TrendMiner can quickly compute correlations between the reac
Hello 🖐🏻Identifying periods where parameter readings increase or decrease is crucial for process monitoring!🤔Why it matters? Changes often indicate potential issues or opportunities for optimization.✍How to analyze? Calculating the derivative of a tag allows for a more precise assessment of how sensitive a process is to fluctuations in specific parameters.📊 In TrendMiner : Different methods are available to determine the derivative based on the type of analysis needed. 👉🏻 Preparation: Smoothing Signals For noisy or highly fluctuating signals, it is recommended to perform an aggregation before calculating the derivative.This helps achieve a more accurate approximation of the derivative of the selected function.Recommended Aggregation:Tag: The tag for which the derivative should be calculated Operator: Average Direction: e.g., Backward Aggregation interval: e.g., 10 minutes 👉🏻 Option A: Calculating the Derivative Using a Formula The derivative can be determined by calculating
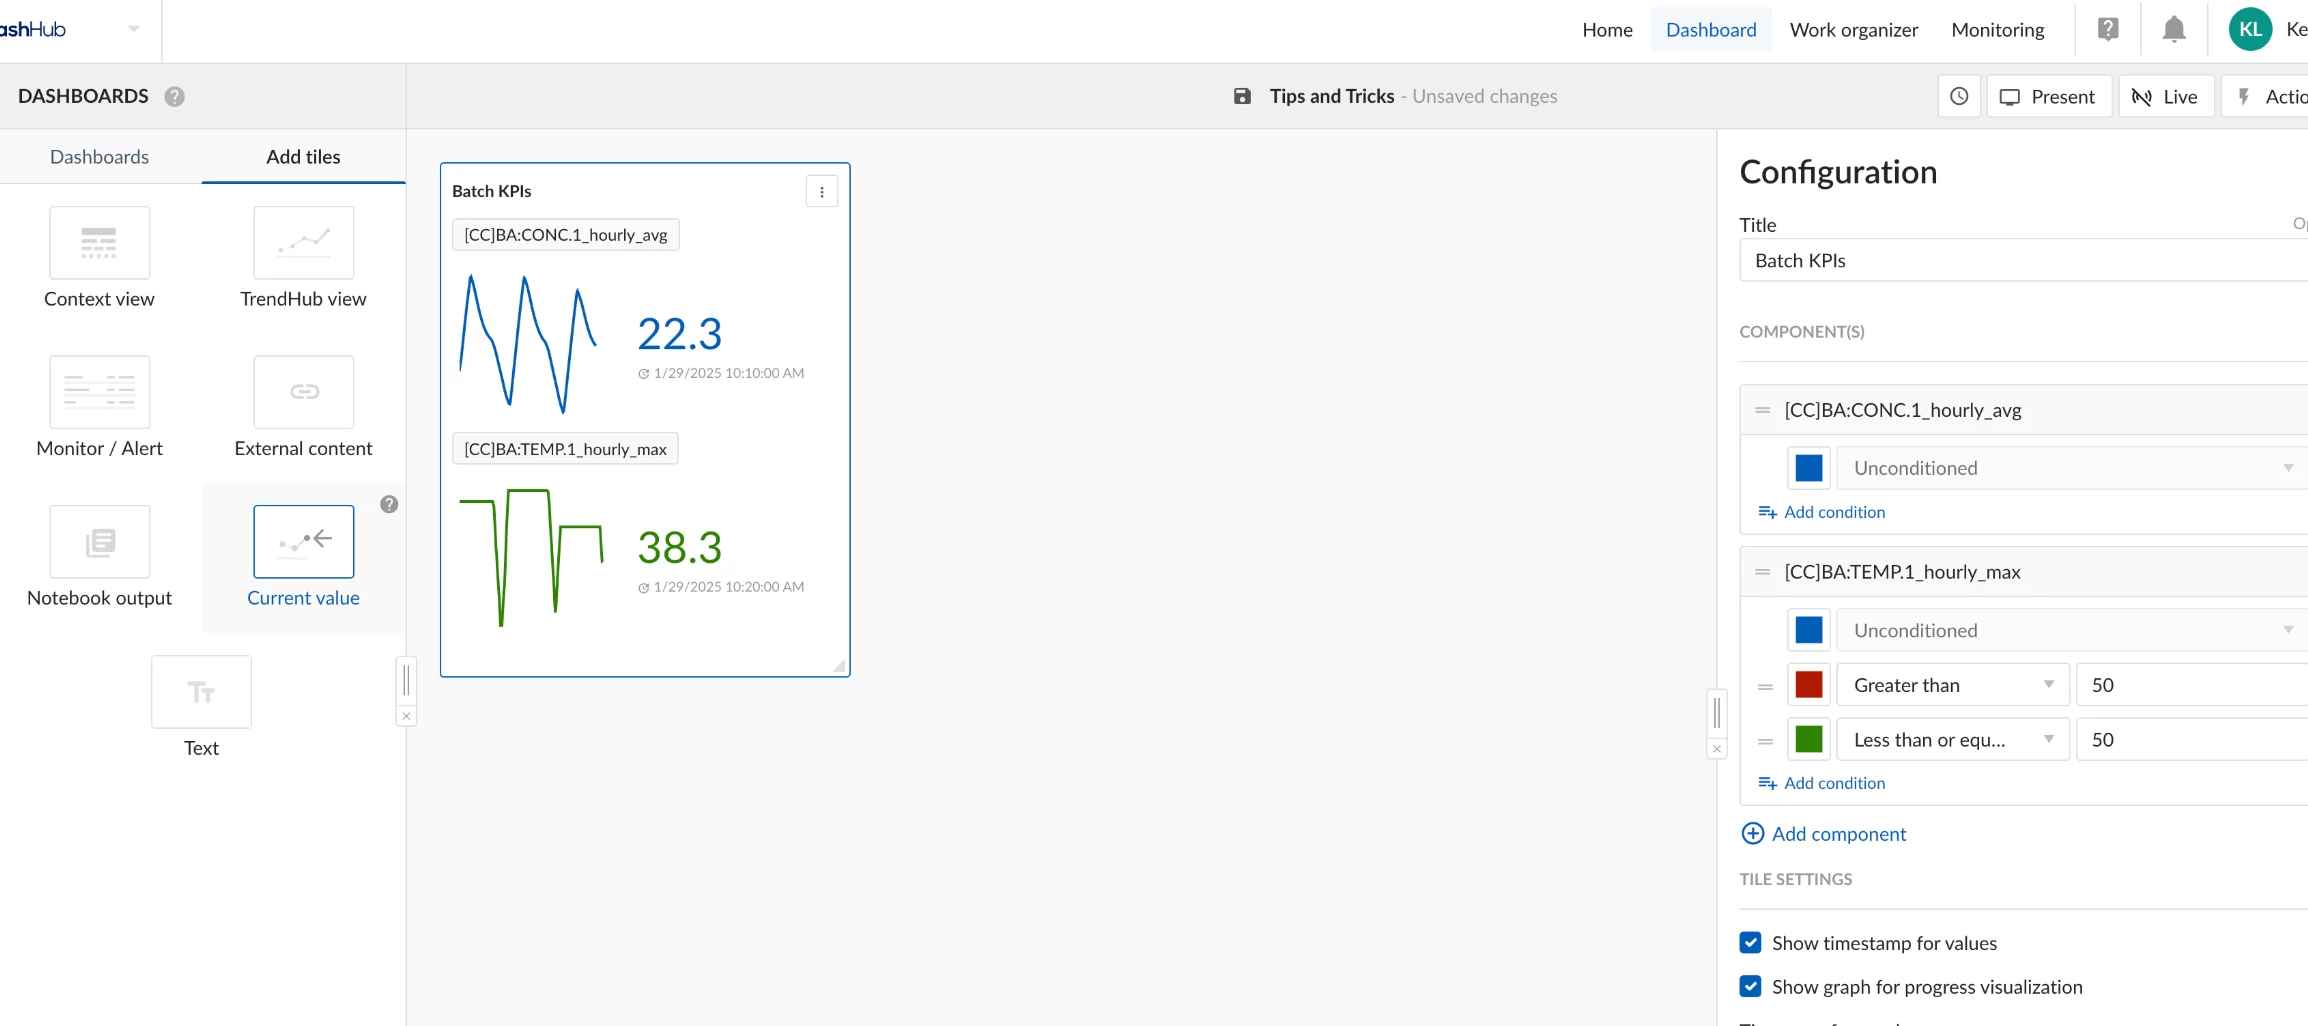
In this post, we will cover how to create a KPI tag using tag aggregation and how to track the KPI in real time within a TrendMiner dashboard. This example begins in TrendHub, where we create the aggregation tags, and then transitions to DashHub, where we use the current value tile to display the KPI in real time. Creating KPI Aggregation Tags in TrendHubIn TrendHub, we can create an aggregation tag from process tags. For example, if we want to calculate the 1-hour average of concentration, we can aggregate the concentration tag and select the average operator. This will be the first KPI to track. The second KPI is the maximum temperature from the past hour. Instead of the average operator, we need to select the maximum operator and apply it to the temperature tag. The screenshots below illustrate the parameter selection for creating these two aggregation tags in TrendHub.Creating the [CC]BA:CONC.1_hourly_avg tag: tag aggregation with average operator and backward 1 hour specification.
TrendMiner is a powerful software tool for analyzing process data, and its user-friendliness is enhanced by the ability to customize the interface language. Changing the language is one of the most frequently asked questions from our community, especially when a global team with diverse linguistic needs is collaborating on a project. How TrendMiner Determines the LanguageTrendMiner automatically adopts the language set in your browser. To adjust the language, you’ll need to update your browser settings, as explained below for different browsers.Supported languages are English, German, French, Spanish, Portuguese and Chinese. Browser-Specific Considerations: 🌐 Google Chrome: Chrome often uses the preferred language set in the browser settings. To check or modify this: Navigate to Settings > Languages. Add your desired language and set it as default. Restart TrendMiner if the changes are not immediately reflected. 🦊 Mozilla Firefox: Firefox also follows the language preferences
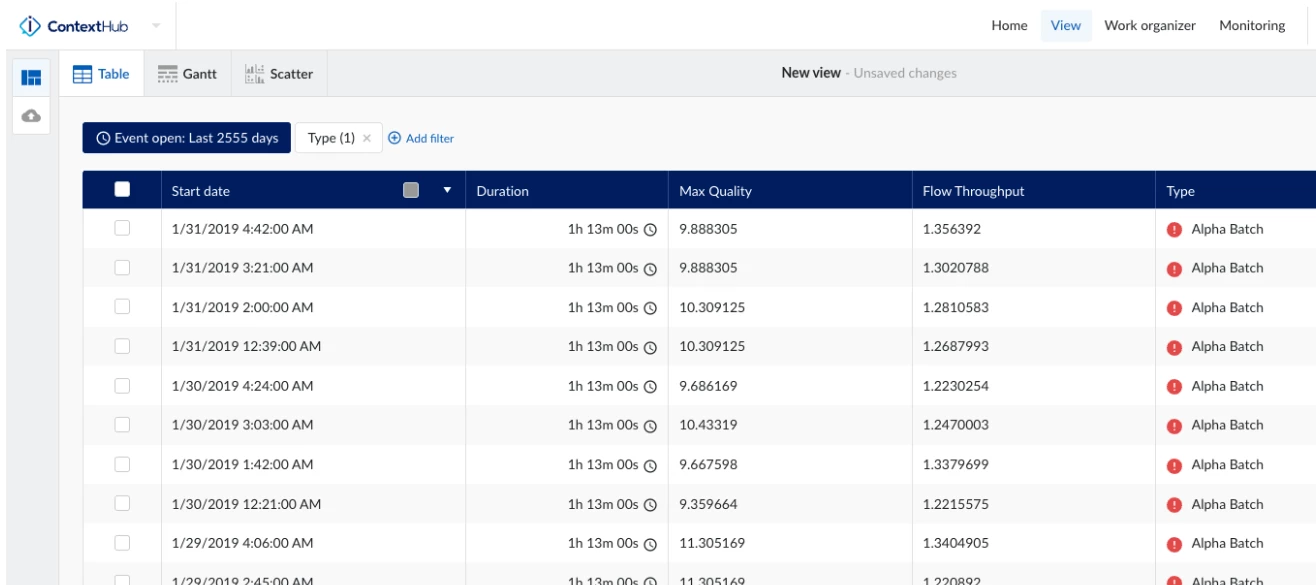
When creating context items via search results, it is often useful to map calculations on your search results to a context field for that context item. Once the calculation is mapped to the context item, the calculation can be displayed as a table column in your context view. This feature can come in handy when you want to display metrics or to report KPIs. We will explore a batch example where we leverage this feature. Consider a batch process where a variety of product grades are manufactured. For a specific product grade, for example product ALPHA, we would like to know the total feed throughput as well as the max quality during the batch. For this demonstration, we will be using the TM-BP2-PRODUCT.1, TM-BP2-QUAL.1, and TM-BP2-CW.1 tags.TrendHub view with PRODUCT, QUALITY, and FLOW tags. 1. Create context items via value-based searchTo begin, start a new value-based search to identify periods when product ALPHA is produced.Create a value-based search for ALPHA batches. 2. Add calcul
Best Practice for Tag Nomenclature in TrendMinerOrganizing tags effectively is crucial for efficient data analysis in TrendMiner. A clear and consistent naming convention allows teams to quickly identify, manage, and collaborate on tags. To address this, we recommend adopting a structured format that simplifies tag creation and ensures long-term usability.Using a standardized approach benefits everyone involved. Whether you’re searching for specific types of tags, identifying a calculation, or finding the creator of a custom tag, a proper naming convention saves time and effort. This system ensures that tags are intuitive and easy to understand, even for new team members, while also enabling existing users to locate information quickly and reliably. Introducing a Drop-Down Menu Solution in ExcelTo make this system even easier to use, we’ve developed an Excel template where users can generate tags effortlessly. The template features drop-down menus for each part of the tag name, so user
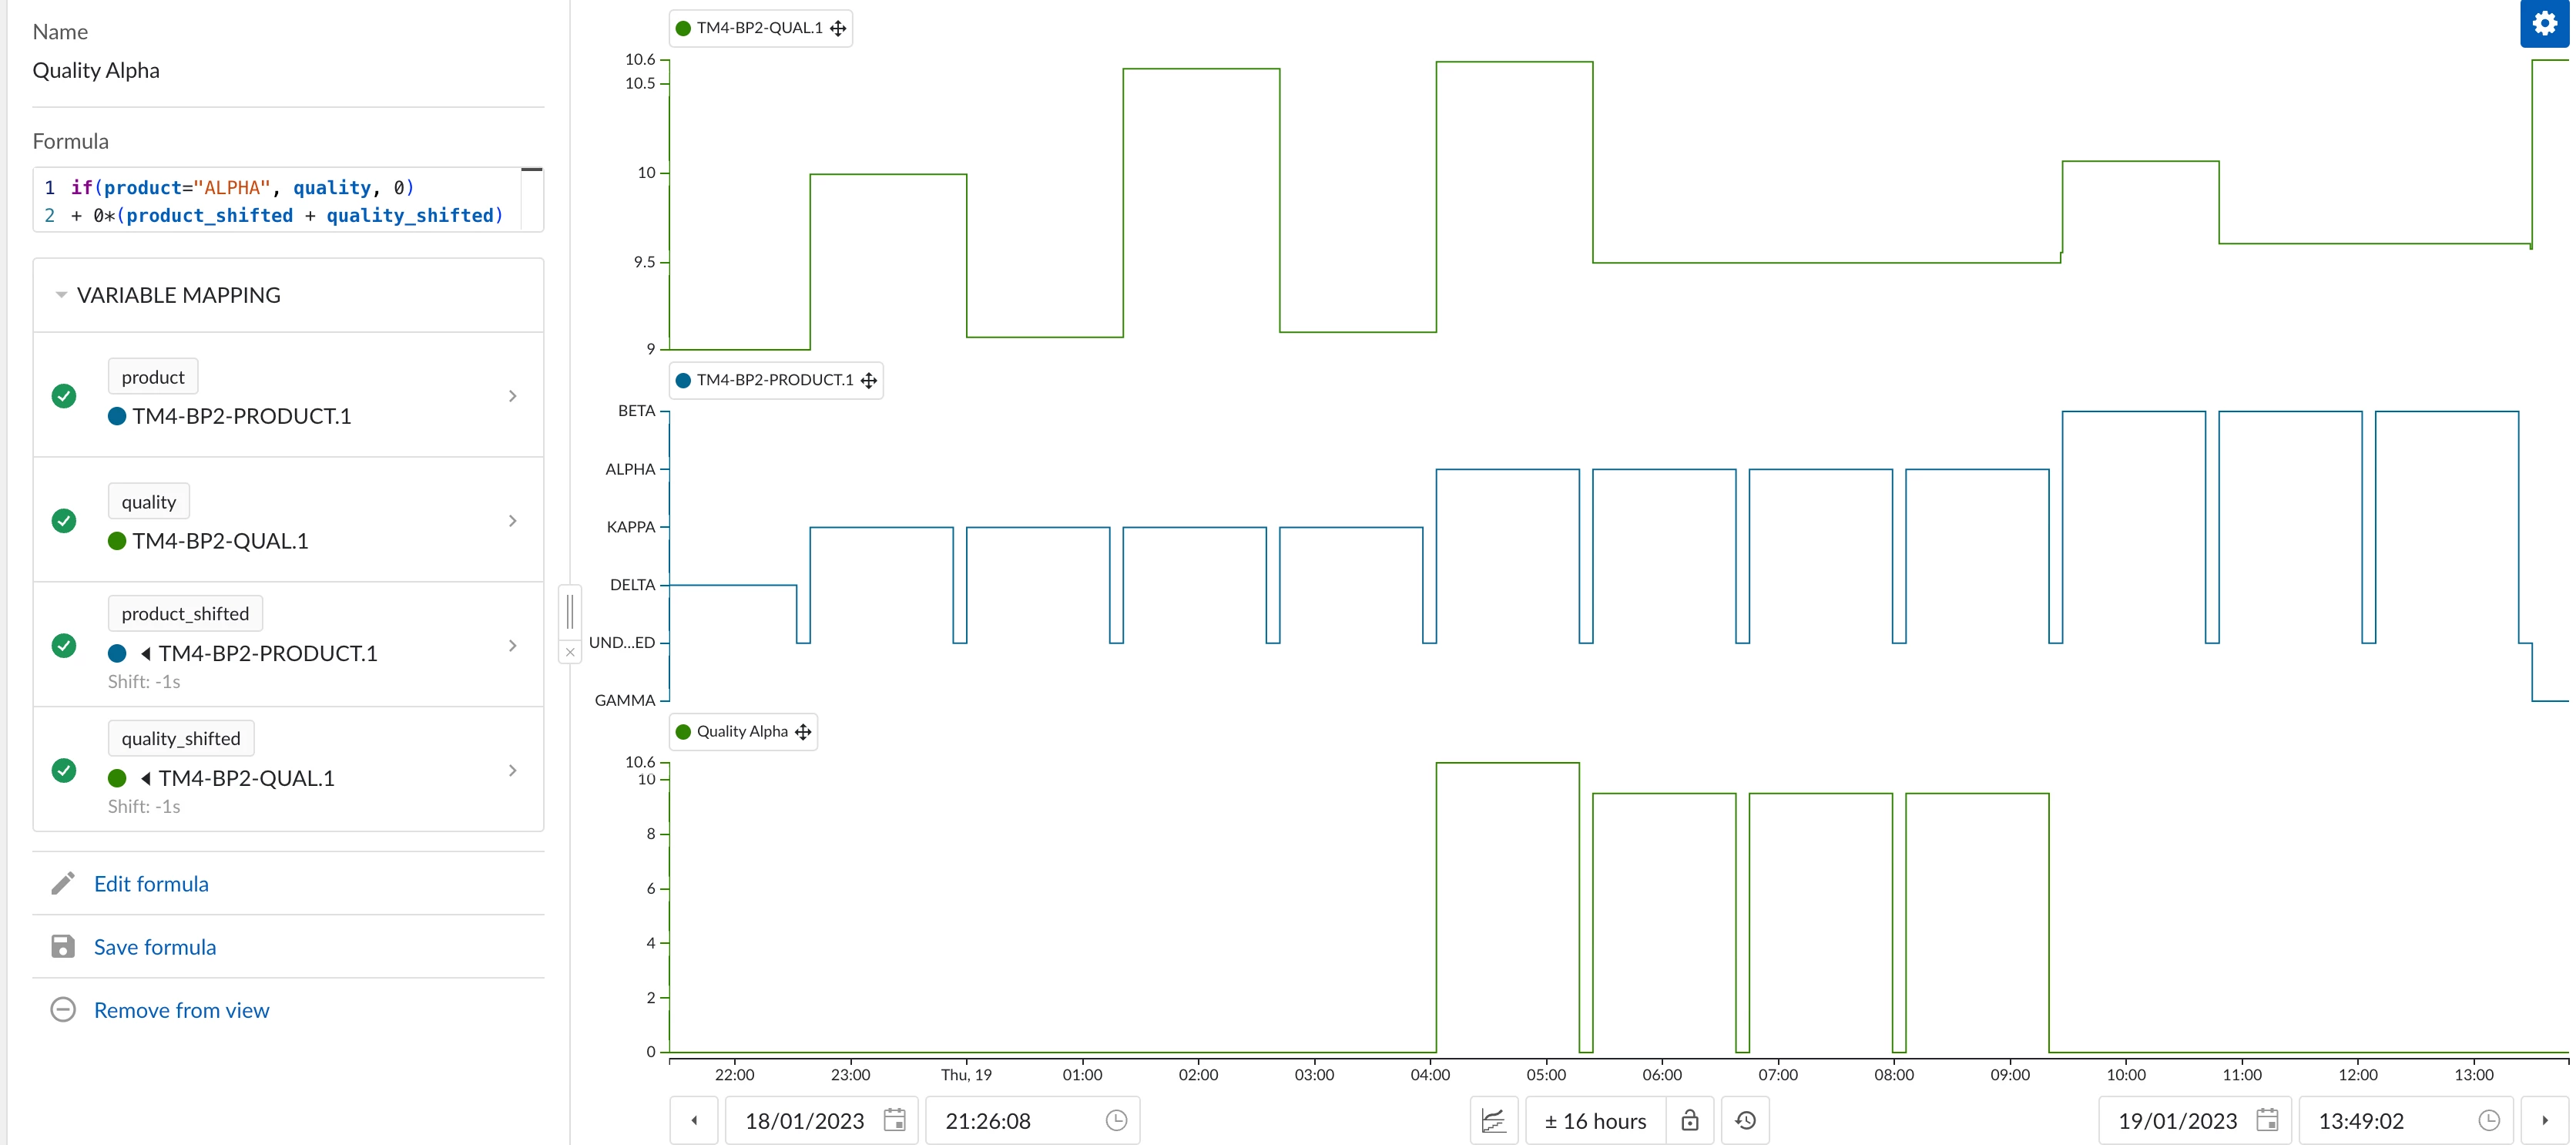
You may have experienced that when working with stepped tags in formulas, your output is not quite what you were expecting. As an easy example, let's look at a batch process where we have a a discrete tag with the quality (top), and a digital tag with the product name (middle). Suppose now we want to create a tag that only shows the quality when the product is Alpha, you might think to implement it as in the screenshot below. However, as you can see, the result (bottom tag) is not quite what you would be expecting: So why we do we get this sawtooth pattern? The first thing to understand is that our resulting formula tag only gets calculated where one of our input tags has a datapoint. Where there is a datapoint for any of the input tags, values for the other input tags are obtained through interpolation. The second factor that gives us this result in that formula tags are always of the analog type, meaning the interpolation is linear. Since our underlying discrete tags are sparse (the
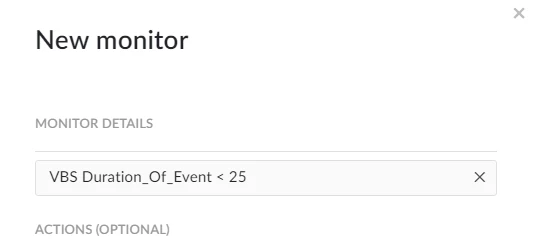
In the chemical industry, monitoring specific events that occur within a defined time frame - such as under X minutes - is crucial for ensuring safety, maintaining product quality, and optimizing processes. While such short-duration events might be fleeting, their impact can be significant, and timely detection is essential to prevent disruptions or inefficiencies. In this article, I will demonstrate how to monitor short-duration events in TrendMiner effectively, enabling proactive responses to these critical occurrences.Why monitor short-duration events?Short-duration events can provide key insights into process dynamics, equipment performance, and potential risks. By monitoring and addressing these brief occurrences, you can enhance operations and safeguard compliance. Here are some practical examples:Environmental compliance and safety: Detecting leaks or abnormal emissions that last less than X minutes is essential for mitigating environmental risks and ensuring safety protocols a
TrendMiner offers three main methods for calculating and tracking consumption or production over time, depending on your goals. You can use the Statistics Table, Calculations on Search Results, or set up a Consumption/Production Tag for continuous reporting. 1. Using the Statistics TableCalculating consumption or production for a given period is a simple one-step process, assuming there is already a tag representing the flow, rate, ... that is to be quantified. If this is not the case, such a tag can be created as a rate or through a formula. Once such a tag is in place you can navigate to the relevant period and open the statistics table. Here all the corresponding values can be read immediately. Often the total amount for the selected period is of interest, which can be read from the integral value, although the average value could also be interesting.Note: TrendMiner does not interpret the units of your tag. The integral value calculation always assumes your rate is expressed in 'pe
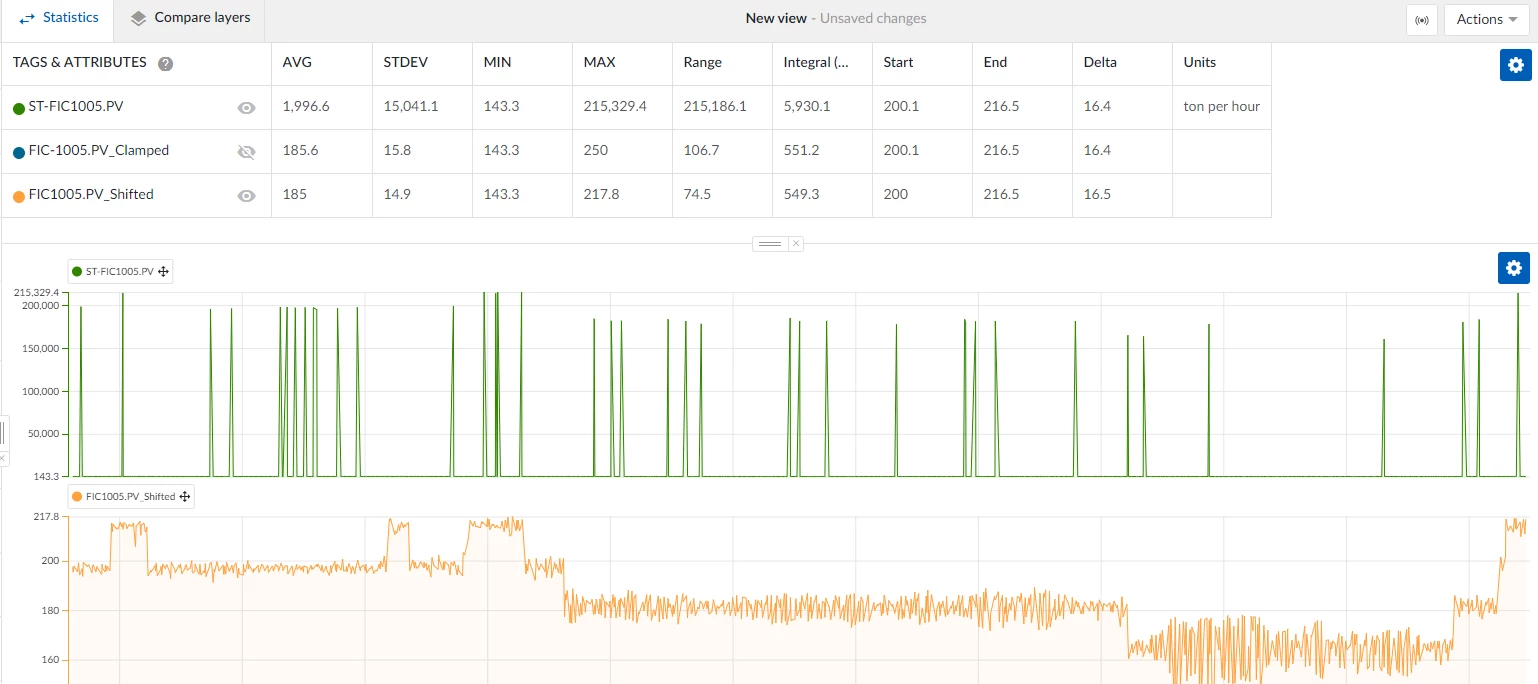
In industrial data analysis, preprocessing sensor data is crucial for accurate results, especially when dealing with sudden, abnormal spikes. These spikes can distort your analysis and lead to incorrect conclusions if not addressed properly. In this article, I will show you how to eliminate spikes from your sensor data using four different methods in TrendMiner, ensuring that your analysis is reliable and accurate.Examples of spikes in sensor dataSpikes in sensor data can occur due to various reasons such as sensor malfunctions, temporary communication errors, or unexpected events in the process. For instance, a sudden spike in temperature readings from a reactor might be caused by a faulty sensor rather than an actual temperature increase. Similarly, pressure spikes in a pipeline could be due to momentary errors in measurement. Removing these spikes from the dataset ensures that the analysis focuses on the real data and not on these anomalies. Methods for getting rid of spikesOption
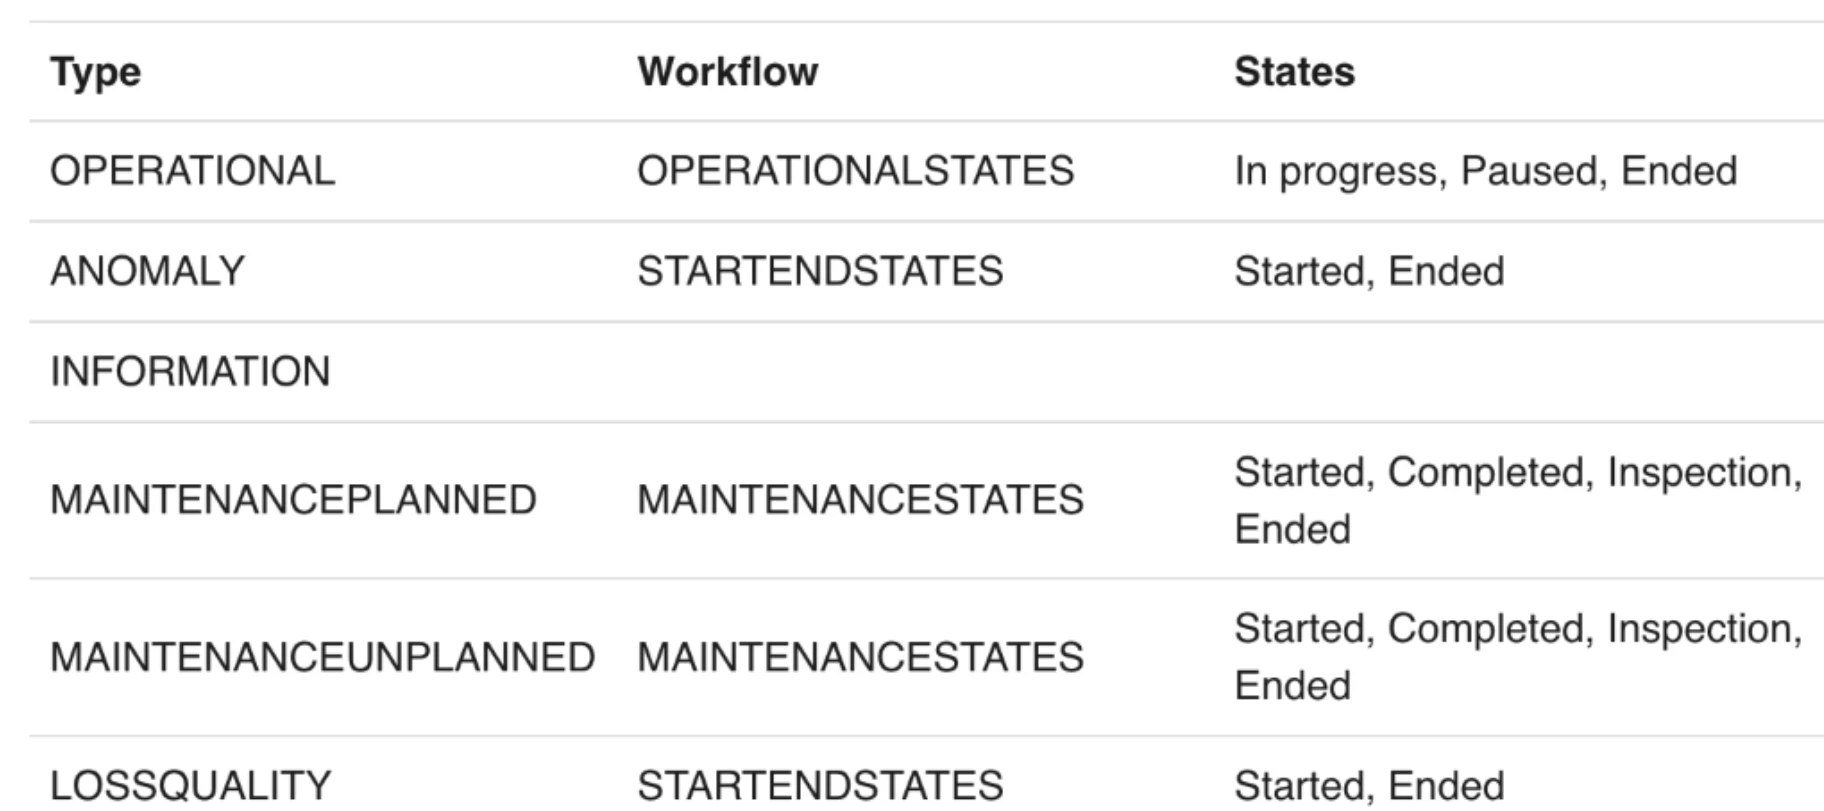
Background So, you've found yourself wanting to historicize something you've observed in TrendHub. As the process engineer for the past two years, you've noticed a clear pattern between unit swings and recurring filter change on a feed pump. Now, you need to compile these findings into a list and annotate them on the trends. That is the only way you can convince everyone else that this is indeed the root cause of the swings and not just some random incident. Although you've briefly heard of ContextHub, once you reach this screen, you find yourself wondering, "What is a component, and what do you mean by Type???" Component and Type are two parameters that must be assigned to create a context item, or a block of information linked to a data point or a period of data associated with an event identified in your datasets. The Component links your observation to a particular tag, while the Type assigns a category that can later be used as a filter in ContextHub. Types There are several pre
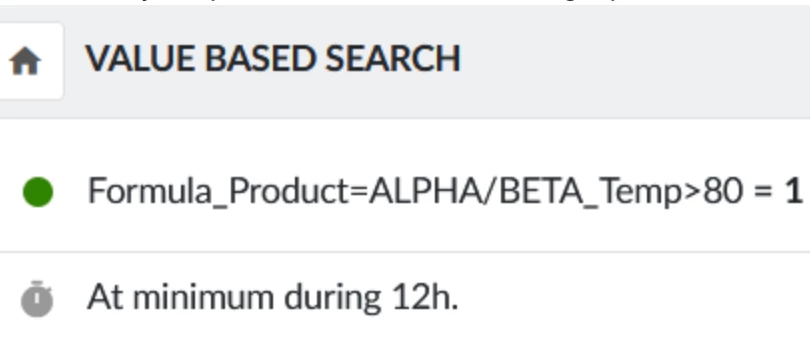
In industrial data analysis, it is often necessary to formulate complex conditions to achieve precise search results. However, it is not possible by default to combine AND and OR conditions within a value-based search in TrendMiner. TrendMiner allows you to combine multiple conditions in a value-based search, but you can only combine all conditions with either AND or all with OR—not both simultaneously. Here, I will show you how to effectively combine AND and OR conditions in a value-based search.Examples of combining AND and OR conditionsA typical example would be searching for production data where multiple products (e.g., ALPHA and BETA) are analyzed under specific temperature conditions. Other examples include identifying production phases where certain machines are either in "Standby" or "Maintenance" mode, but only if energy consumption is below a defined threshold. Another example could be analyzing phases where specific chemicals are either in a "Mixing" or "Reaction" state, b
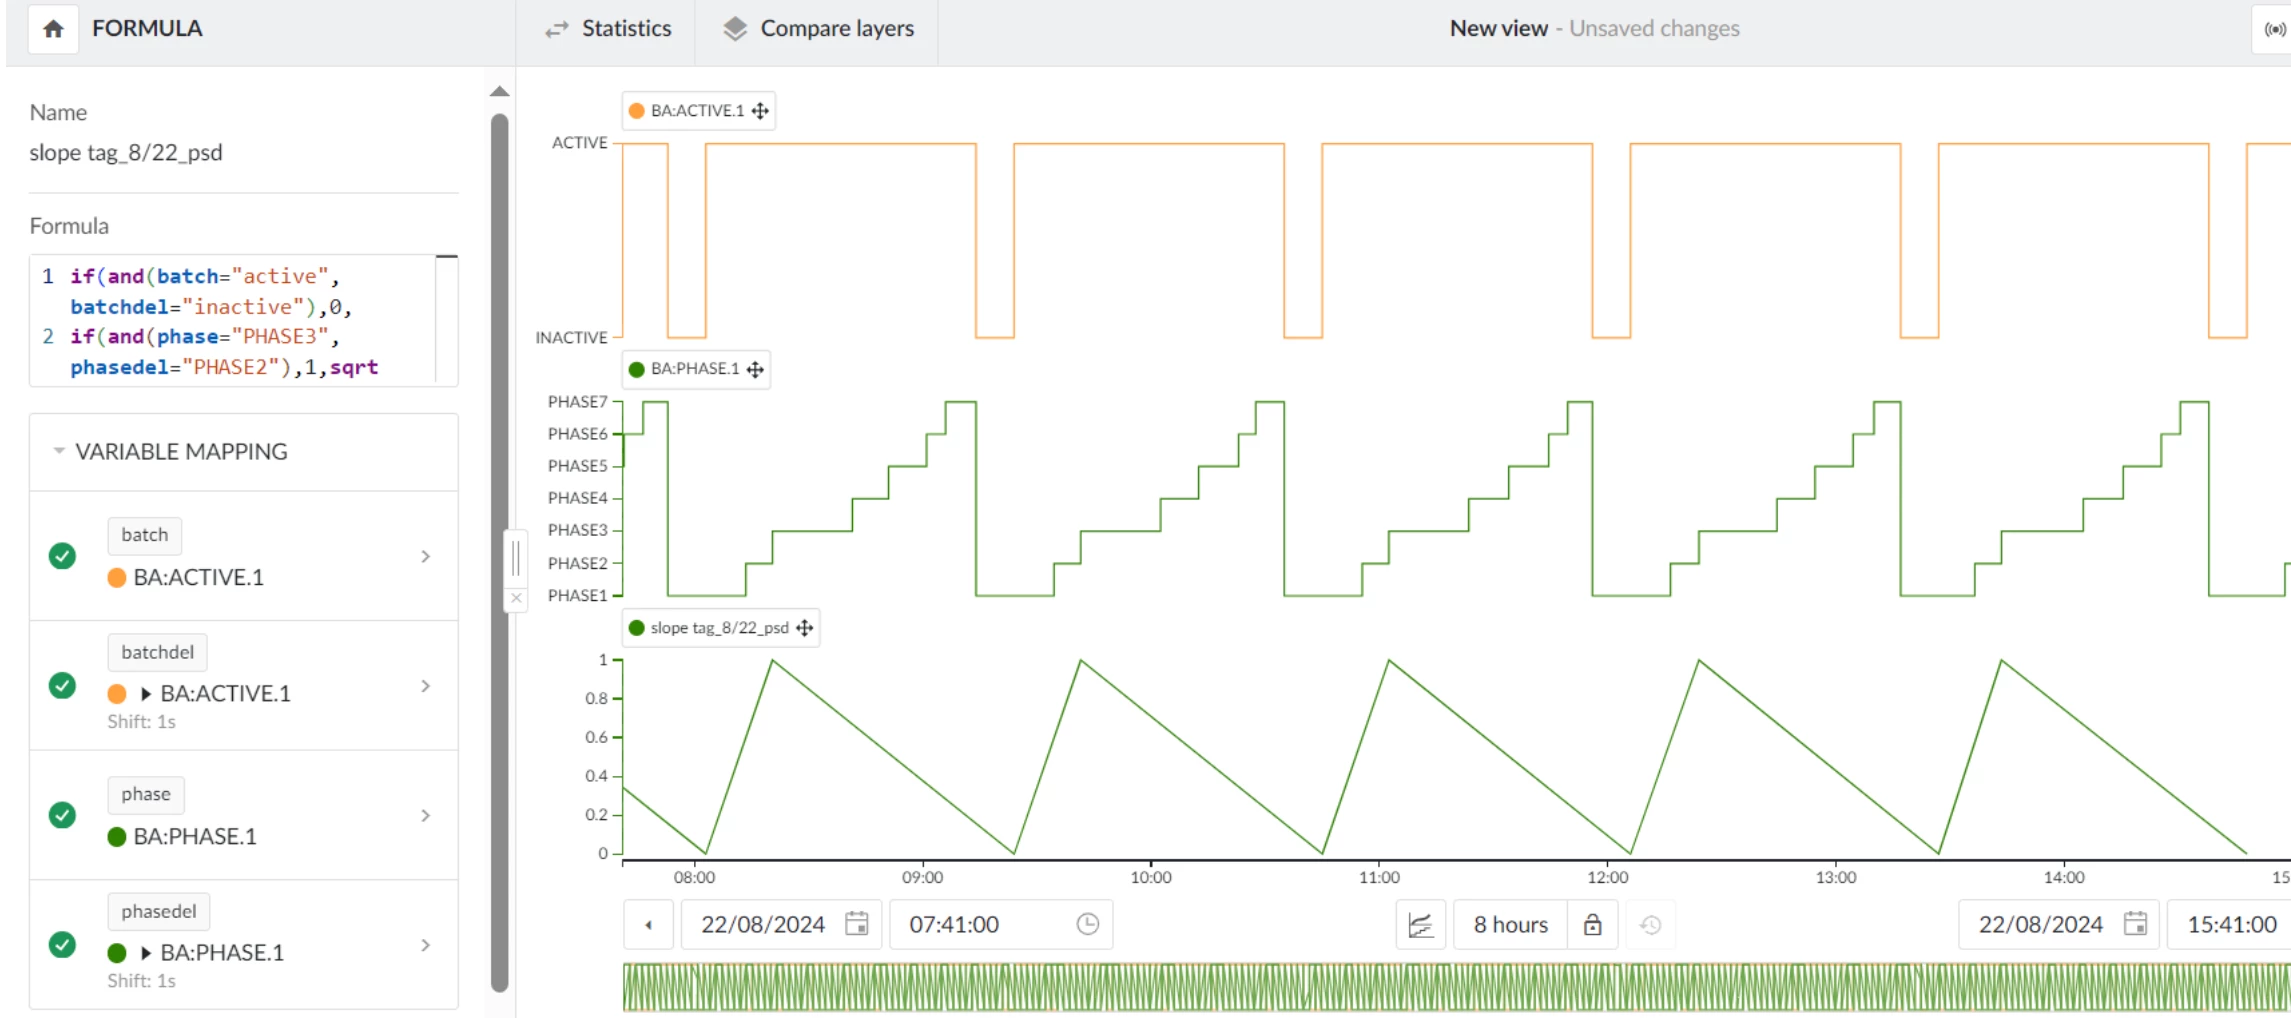
Sometimes, for better visualization and monitoring, it is helpful to represent the durations of certain important events in the plant within a variable. This is possible in TrendMiner by following a couple of steps.First, it is necessary to create a slope tag, from 0 to 1, that connects the start and end points of the event.This can be done with a conditional formula and time changes. For example, an event from the moment a batch starts until the “Phase 3” starts: It is important that the obtained variable consists of constant slopes from 0 to 1 and from 1 to 0. We do not want it to remain constant at values of 0 or 1 for long periods, as this could affect the second step of the workaround. This is why time shifts are used, indicating only the exact moment of start and end.Secondly, we need to transform the slope tag into another variable that indicates the duration of each slope. This is done with the formula 'if((a-b)>0,1/(a-b)/60,,0)' following the explanation provided below (to
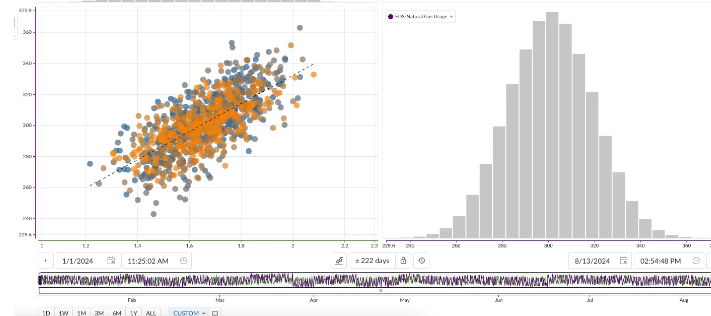
BackgroundAs a process engineer, understanding the relationship between two variables is crucial and often necessary. For example, how does tower pressure impact overhead rates? How does temperature affect conversion? Operations are constantly making adjustments, and process engineers need to grasp the impact of various levers or handles on final product specifications, operating envelopes, and process safety. TrendMiner enables users to quickly analyze relationships between tags or variables, both visually and quantitatively.Scatterplot of natural gas usage vs carbon emissions.Steps to Analyze Relationships in TrendMiner:Step 1: Add the tags you are interested in analyzing to the active tag list for bivariate relationships.Step 2: Switch to the Scatterplot view.Change view from “Trend” to “Scatter”.Step 3: Adjust the time period to include relevant data for your analysis.Step 4: Evaluate the relationship. Use the scatterplot to qualitatively assess the relationship between the variabl
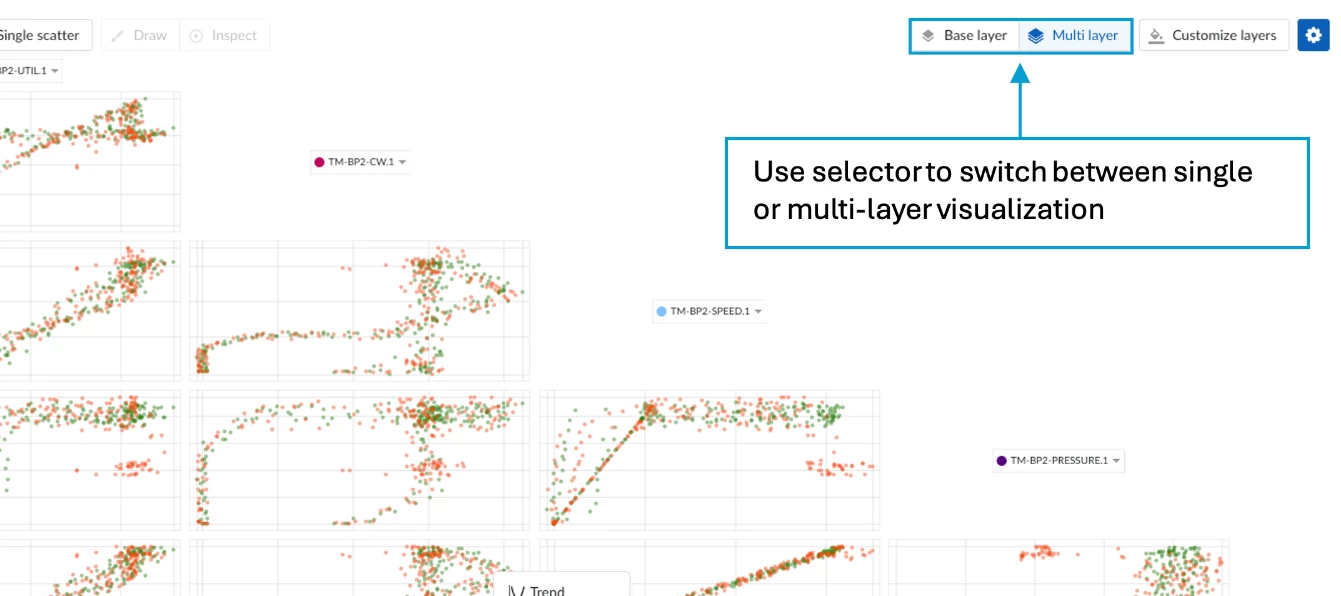
In our latest release, 2024R2, we’ve enhanced the Scatterplot display in TrendHub to visualize all layers of a TrendHub view, not just the base layer. This new feature enables you to compare relationships between different tags across multiple layers, making it a powerful tool for troubleshooting, root cause analysis, performance grading, and more. In this article, we'll walk you through how to use this new feature to its full potential.Step 1: Adding Different LayersThere are several ways to add layers in TrendMiner. In our example, we used value-based searches to identify high- and low-quality batches and added the three highest quality and three lowest quality batches as layers.Overview of all the layersStep 2: Switching to Scatterplot ViewBy changing the plot visualization to a scatterplot, you’ll immediately see the option to create a multi-layer scatterplot.Scatterplot visualization with multi-layer enabledStep 3: Customizing Your LayersClicking the “Customize Layers” button open
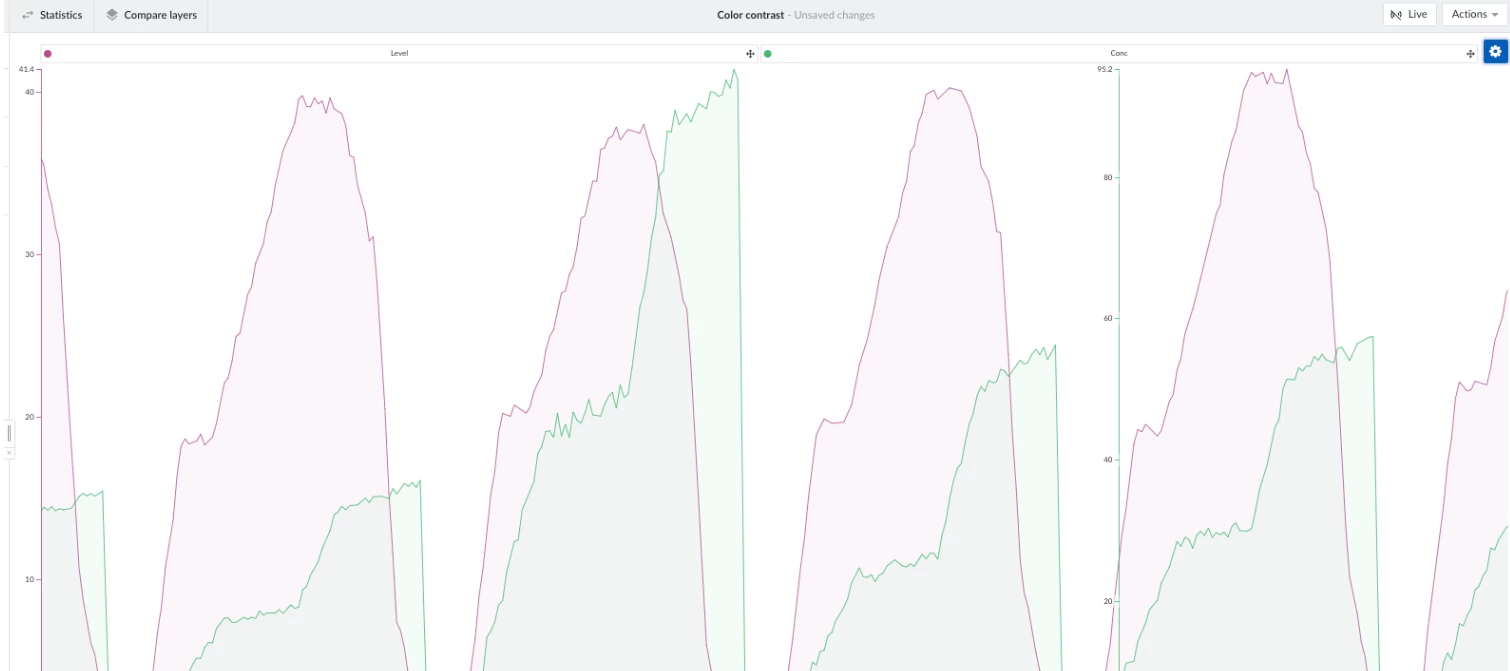
Creating clear and effective graphs is a vital skill for anyone involved in data presentation. In process engineering, the ability to visually convey complex information can significantly enhance the impact of your work. However, not all graphs are created equal. Poorly designed graphs can mislead, confuse, and obscure the very data they aim to highlight. This functional tip outlines essential best practices for making enhanced TrendHub views that are both informative and visually engaging. By following these guidelines, you can ensure your graphs not only accurately represent your data but also resonate with your audience, facilitating better understanding and decision-making. Keep It Simple: Avoid clutter by minimizing gridlines unless they are necessary. Try to avoid displaying excessive context items unless they are needed to emphasize a reoccurring issue. Consider whether all data actually needs to be displayed in the focus chart, or if keeping longer-range data i
In industrial data analysis, precisely examining short events is crucial for optimizing processes and preventing disturbances. Short events, which are shorter than the index resolution, present a unique challenge as they can easily be overlooked. Here, I will show you how short events can still be analyzed in TrendMiner using a value-based search.Examples of short eventsExamples of short events include sudden pressure spikes in pipeline systems, which may indicate valve malfunctions or blockages, temporary temperature fluctuations in reactors, which can point to unexpected chemical reactions, and brief electrical spikes in systems, which may signal short circuits or overloads. Analyzing these events accurately allows for taking preventive measures and improving process stability and system safety. Background on indexing in TrendMinerTrendMiner uses indexing to enable fast, interactive visualization and analysis of time-series data. When a tag is accessed for the first time, it undergo
Often, we want to analyze or report on key KPIs, such as consumption, production, average temperatures, or maximum values of critical variables. However, these data need to be analyzed separately based on the recipe they correspond to.In TrendMiner, it is possible to unify all workflows so that reports for multiple recipes can be obtained with a single process. This is due to the ability to include the “constant” condition in the Value Based Search and to add string variable calculations. Here’s how it is done:Prepare the View: Load the tag indicating the recipe name and the rest of the necessary tags to create the report. Perform the Search: Go to the search menu and start a value-based search. The condition will be: Recipe name tag CONSTANT. The results obtained will correspond to the time period indicated in the context chart. Add Calculations to the Search Results: String Variables Calculation: Start value of the recipe name. This calculation will indicate which recipe each of t
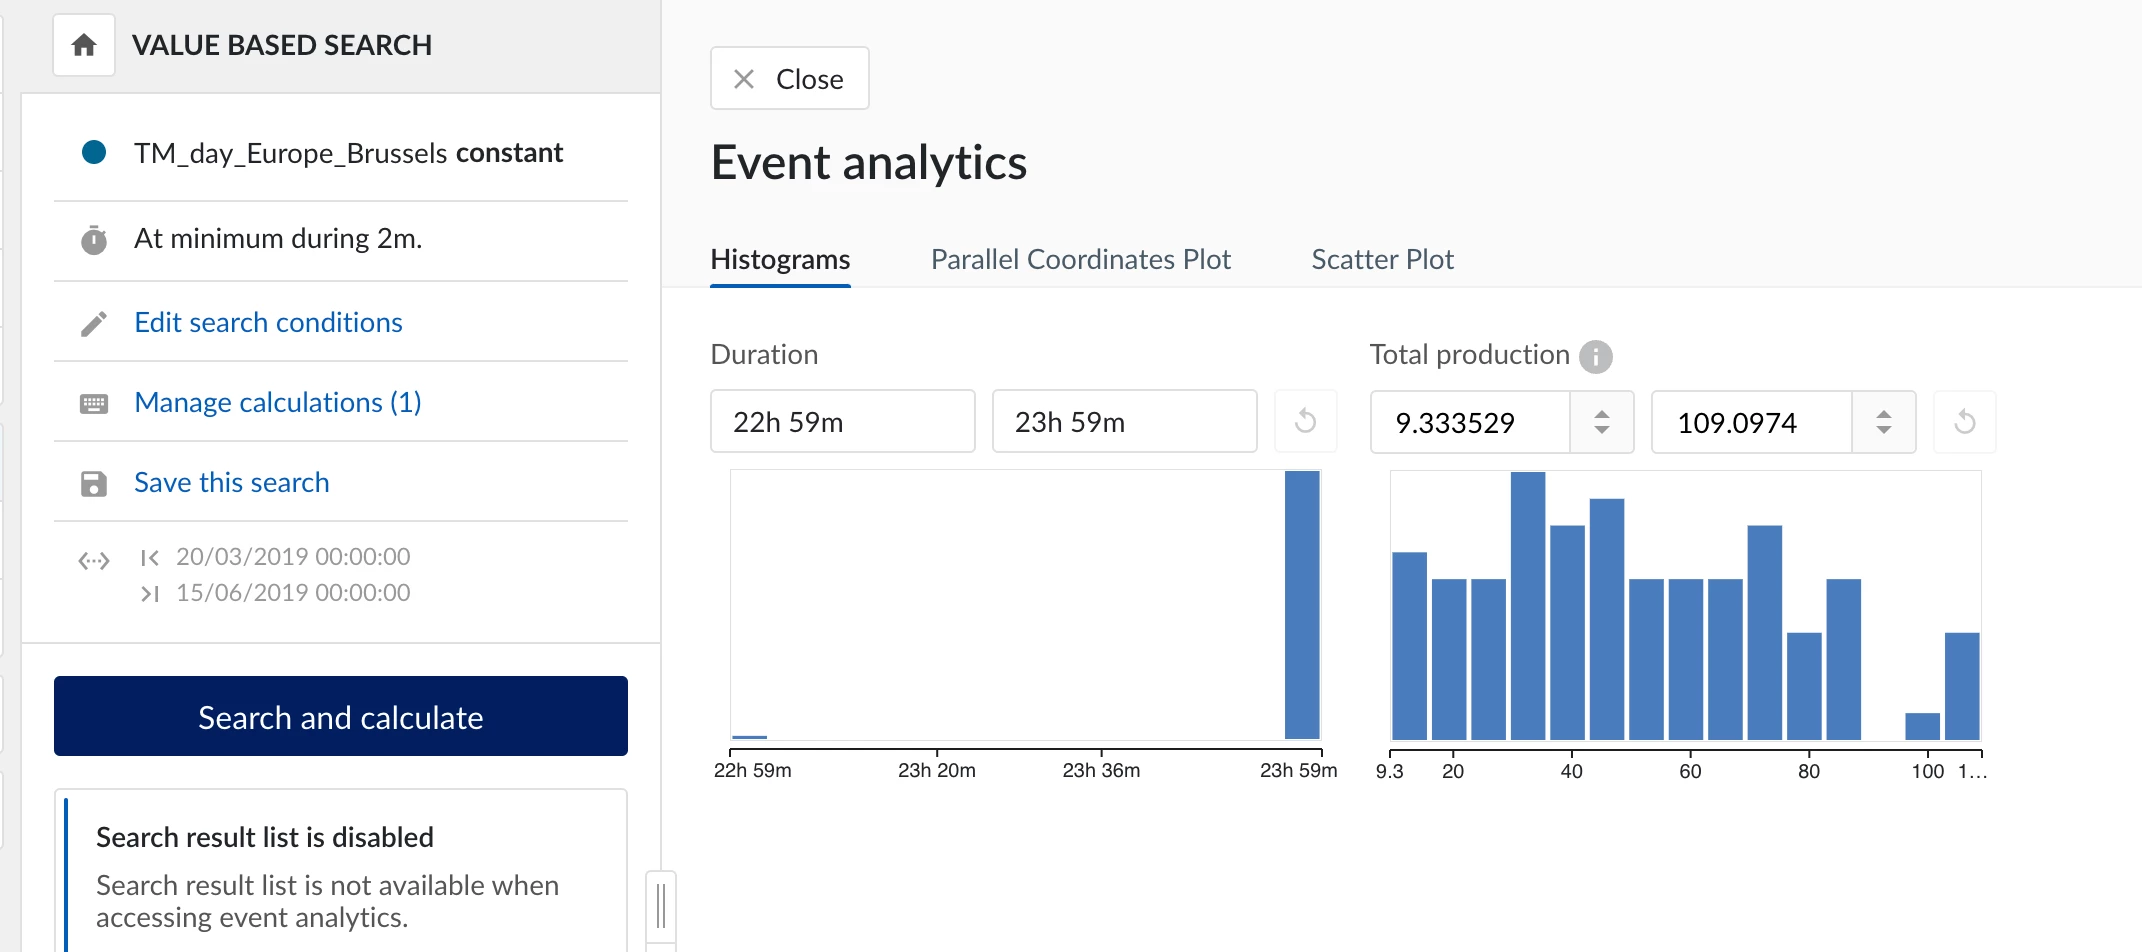
Background:TrendMiner's "Event Analytics" is typically used for batch processes, but it can also optimize continuous processes. By breaking down the data into manageable hourly intervals, this approach provides detailed monitoring and identifies optimal conditions for enhanced efficiency and productivity.Steps: Preparation: Add the most important process parameters. Include the pre-installed TM_day_ tag. Data Splitting: Use the value-based search feature to segment data. Set the condition to TM_day_ constant. Ensure a minimum duration of 59 minutes. Adding Calculations: Add calculations on the search result. Example calculations: Average Temperature, Integral Cooling Water, Minimum Pressure. Event Analytics: Use the 1-hour aggregated data within Event Analytics. Analyze the data using histograms or parallel coordinate plots to visualize and identify optimal process conditions. Picture 1: This parallel coordinate plot from TrendMiner’s Event Analytics shows the relationship b
Already have an account? Login
No account yet? Create an account
Enter your E-mail address. We'll send you an e-mail with instructions to reset your password.